XLF weekly set up for ABCXLF weekly set up for ABC expect some form of retracement can zoom in on daily but expect ot to be volatile.
Retracement

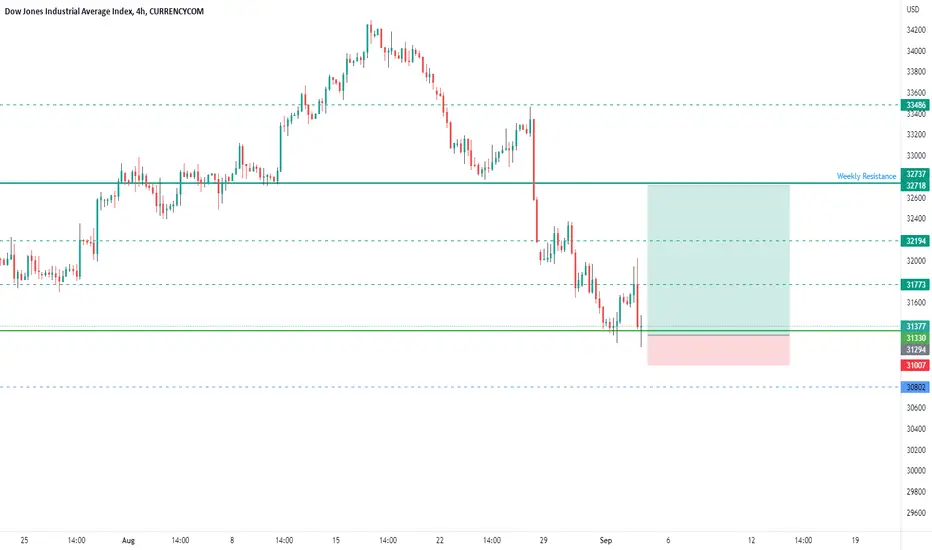
DJI - God Help Us All... Welcome to the Great depression 2022 Dow Jones industrial average index has lost its February 2020 support. As this support did not hold i am convinced that the oldest US index has begun the great depression, not recession but depression. You can already see what fiat pairs with the USD are doing.
The run up was just phenomenal to say the least. We've been essentially parabolic since 2009, with the total run up since 1987 flash crash. Since then economy was on steroids.
The first sign of realism came with the dot.com bubble. It was especially hard on the S&P 500 index which lost more than 80% back then. Then came 2008 financial crisis which was seen predominant in the DJI. After that it was just up up up, sideways and up.
Covid dump just showed how laveraged this market is and sparked asset inflation on steroids. .... NOW ... Will see what happens.
DJI could still drop by 1k points, but not much lower for now as it is expected to go into a retracement first, if it doesn't go already. This retracement could drag out for year or two before continuation down. Where you might think?... below 2008 bottom is quite realistic, but for that it can take 10-30 years to play out. Again its a depression not recession, remember that. We are clearly not dropping like in the 1929-1932, therefore i think we will bleed slower.
Aftermath could be ... who knows... 20-30% of people out of job.... in 1930s there were around 25-30% of them on the streets.
During DJI retracement there could still be a rotation in the stock and crypto market, with little projects reaching new ATHs, but still lets not expect to much, and rather realize that the US economy has POPPED.
DISCLAMER:
I am not a financial advisor so non of this should be taken as a financial advise. Be well.
TVC:DJI

📉✌BTC 1H Short Position : Risky✌📈BINANCE:BTCUSDT
COINBASE:BTCUSD
Hi traders, first take a look at my previous analysis and positions.
by the time the price is in the middle of the yellow lines, you can open a short position in two or three steps.
If the price falls and reaches the risk-free level, you can risk-free your position.
TP1-2-3-4 are on the chart.
The optimum stop-loss is above the determined lines.
Please share ideas and leave a comment,
let me know what's your idea.
CrazyS✌

GBPCAD / SELL ZONE! CONTINUED SHORTSNot a lot happening across the board in terms of getting into new positions, this is one of the only ones I'm looking at taking a position on. GBPCAD if we see a rejection around 1.48000 ill be taking shorts to hopefully catch the continuation move to push towards last weeks lows.

SPX +FVG failure I'm usually looking for my trades between 7am-12pm. Initially was looking for a BUY but the sell setup took over and I needed to remind myself of what it looks like when a +FVG.
Bullish POI, where I would normally be looking for a BUY entry and target the last highs made.
Price traded through the Bullish POI, a +FVG, then we traded retested the lows of it and continued to fall from there.
SPX
No trades tomorrow!

EURUSD (EU) buy opportunity for a retrace to the upsideEURUSD has stalled at a critical weekly low after a sharp sell-off. The long term trend is down but I believe a retracement is on the cards back to the 1.00 (parity) area.

Still in strong downtrend resistance So we are still in a strong resistance.. seems like it’s playing with it .. 0.7550 area has a strong resistance so there is a chance of the price rejection.. if not then should see the bulls to go aggressive to breakout all the way through.
Hey Ripple had done this before in the past ., we might be seeing a bit different so let’s becareful and watch any reversals
Let’s see how this play out.. are we going to break break out the surface or fake it do do a drop retrace it to make the bears exhausted.

Short term predictionThis is the bounce off the first test of -20%ish decline. I expect a +5% move to happen fairly quickly, then a lower retest near Fed announcement, then a slow retrace to roughly -10% from ATH before the next leg down.

US10Y, It most likely goes higherIs the correction over for US10Y ?
Elliott wave count suggests that US10Y will go higher and uptrend resumption may has been started.
US10Y as shown on the chart is in typical Retracement zone for wave 4s. Wave 4s usually retrace not more than 50 % ( some experts accept a shadow down to 0.618 level) of wave 3. In addition our wave iv is in territory of circled wave 4 which fulfills one of important Elliott waves guidelines which says : :larger degree wave 4s usually end in territory of smaller degree wave 4s.
upside targets are also shown on the chart which were obtained by typical Fibonacci levels for wave 5.
please note there is one more impulsive section on the wave pattern on higher degree waves. I did not include those wave labels to keep the chart simple and clean.
Good luck everybody.

SPX500 likely to retrace UP!Hey tradomaniacs,
orderflow and footprint showing absoprtion due to exthausted sellers.
Likely to retrace back to resistance that would give us a nice chance to follow trend!
What do you think?

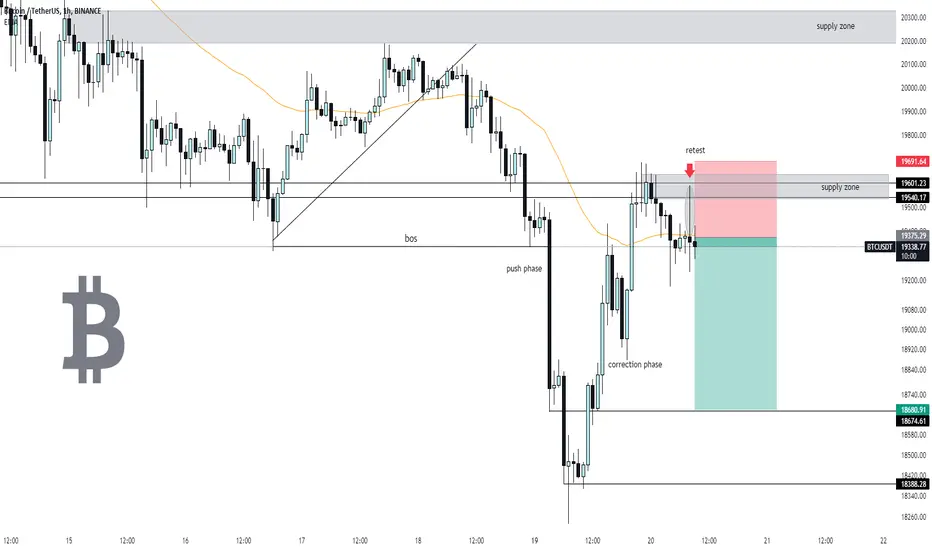
bitcoin Below 20000Bitcoin continues to fall against the strength of the dollar, after breaking the support level of 19600, the price is retesting the area, and the second rejection from the supply indicates the continuation of the fall.
XAUUSD MINI BULLISH RUN FOR RETRACEMENT
After a solid bear run, last week broke the daily swing low at 1680.88 but does not end there as the market target is below 1555. Now, it forms a change of character at the 15Minute TF to initiate the upside movement reaching at least 50% of the 4H swing in order to go lower. I did catch the rocket entering at 1664-1662 targeting 1682.

MTGOX DEADLINE EVENTThis is the huge event for Bitcoin and other cryptos but mostly this is the big day for bitcoin.
MtGox is going to release 137,000 that’s worth over 3 billion of bitcoin. It’s going to take months to process and complete it, the big dump should be expecting soon while correcting the drop.
It’s going to be pretty volatile but becareful.
More events are coming on the 21st of the hike decision making following along on the 22nd the ADA Hardfork event.
If buy reversal ever come out of nowhere please becareful of the the huge spike down comes if happens then the buy around 10K maybe 12k we are already in range for the drop meltdown like the plane crash. We are still In crypto winter and bear market it’s far to soon To say it’s over and we are now bullish.. no we aren’t yet please do not jinx it yet.
10K has stronger bottom floors, 17,600 is NOT the bottom.

Triangle Pattern formation in 1 WTF!>Good formation of the triangle pattern happened but the most important thing we need to watch for is good Volume build-up!
> The upper Trend Line should be broken with the good volumes is the only concern!
>Good formation of 'V' Shaped Candle Sticks is happened just below the 20 DMA.
>The 4 Supports Levels are significant because they represent the higher low's formed in the above triangle.
>Let the break-out happen first, then entry is what I am planning or else if you want to enter it now go by the stop-loss I gave.
>The Stop-Loss is some what more but it is favorable when compared to RRR which is '2.02'.
>The first Target would be the 52w high.
Let's Watch with patience!!!
***Container Corporation of India Limited (CONCOR) is under the ownership of Indian Railways, Ministry of Railways, Government of India.

KR SHORT IDEANYSE:KR
KR made a big move this week after the Q2 earnings call. I believe that it is now overextended.
On the 15-minute chart, the big price action is seen. However, the RSI indicator shows a flat relative
strength suggestive of bearish divergence. The Mass Index peaked out over 27.5 and is now dropped
below is the suggested trigger for a reversal of 26.5 Trading volume is about 250% of the average
on Friday overall while concentrated on the early morning rapid trend reversal and late afternoon
profit taking. I will look to capitalize on a quick downtrend correction with a put option with
5DTE below the current market price for maximal return albeit with the added risk of time decay.

BTC SHORT? Maybe I have been looking at these charts for too long but this looks good to me. If nothing more then part of it completed. Technically it's too soon to consider this because if you look up still plenty of room, but without some retracement is unlikely to me. We are also about to enter2nd MM Killzone. We just tapped the ceiling so, tapping the floor seems logical. I am just messing around not risking much on this trade. Don't have to risk much if it even half is right. As of now we are still very much in an uptrend and we technically made a higher high which makes this trade about absurd and against the trend which is not the best thing to do in most cases. I opened the position cause something on a volume footprint chart that was out of place. It indicated to me we could reverse soon. This probably is not the smartest trade, but I have never been great at following the crowd. Even funding rates are positive and predicated rates are positive.
24500 Is a massive supply zone or resistance if you prefer. It has a ton or orders stacked there. 25000 is the heaviest looking at it from a market maker view. There is almost no support below volume or limit order wise. Below 23600 is empty at the moment it would move through there with haste if it gets there.
If this has already started by the time this is published you can always find a pull back and enter the new downtrend I believe is going to form. Lets see how it plays out. My long that just completed played out wonderfully. Wish I had published that one. I only published it private cause I had my personal levels on it I have since removed.
We just 10 seconds ago enter KZ2 I mentioned earlier. Lets se what happens and who gets taken out. Good luck. Looks like it already started, sorry for late post, but it could very well come back close to entry a few times yet. Oh and I know that's not the traditional way to use FIB levels, it's something I use just to mark areas of value. I use the volume profile more. Set TP at higher volume locations.

BTCUSDT wants the local retracement?the price got the liquidity from the demand zone as I said in my previous idea where we were waiting for a clear breakout of 20k resistance.
How to approach it?
We could see a retracement on the Fibonacci level in order to grab a new long position for a new breakout from 22k, where the market has a strong resistance.
So if the price is going to lose the support and retest as new resistance, According to Plancton's strategy , we can set a nice order
–––––
Keep in mind.
🟣 Purple structure -> Monthly structure.
🔴 Red structure -> Weekly structure.
🔵 Blue structure -> Daily structure.
🟡 Yellow structure -> 4h structure.
–––––
Follow the Shrimp 🦐

USDJPY It will retrace to Support ZoneWelcome back! Let me know your thoughts in the comments!
**USDJPY - Listen to video!
We recommend that you keep this pair on your watchlist and enter when the entry criteria of your strategy is met.
Please support this idea with a LIKE and COMMENT if you find it useful and Click "Follow" on our profile if you'd like these trade ideas delivered straight to your email in the future.
Thanks for your continued support!
Brian & Kenya Horton, BK Forex Academy

USDCAD SHORT OUTLOOKWith a 86% Retracement we are looking for short setups as long as High Point A is not taken out. That will be a possible Divergence setup if A does nto hold.

AUDUSD LONG POSSIBILITYAs long as Low point A holds we are looking for long opportunities for AU. Fibonacci Retracement 86.0%. Tight STOP. Looking for Bullish set up.

US30 DOUBLE BOTTOMPrice has formed a double bottom pattern with bullish divergence suggesting bullish movement.
The initial target for bullish retracement is the 32800 resistance zone.
Has inflation really peaked? Not so sureWe have been inside this green triangle since 1915.
The downtrend line has been tested a few times and this is the first year it actually went past it and recently came down for a retest.
Hard to feel like inflation has peaked also considering oil is still in an uptrend and the Fed couldn't have been more hawkish in the last Powell's speech, so we may be up for a rough surprise in tomorrow's CPI report. The Fib retracement points at a possible 12.50-13.00% inflation read, let's see what we get.

BTC Will Probably Stay Boring For A While Before Retracement.As we have finally showing solid signs of bottoming, i would say that we have entered a wyckoff accumulation pattern at the lows. We've done something similar in 2015 and even in 2018, but it is looking more like '15. We are talking about completed crashing structure here, and not that we are just going to a new bull market here, at least not for BTC. With the Altcoins there could very well be a different story here, what i've already presented in a previous idea. Retracements usually reach to at least 0.5 / 0.618 fib. level., something what BTC still hasn't done yet. This always happens at some point. Best case scenario we could see prices to reach .702, even .786 (78.6% of the initial fall) which sits at 55k area, before turning back down again. This would trap a LOT of retail investors in, and this is something markets love to do.
I am not a financial advisor so non of this should be taken as a financial advise. Be well.
