Reversal VS retracement *BACKTEST*Simply * Back Testing *
in the image I tried to put into simplest terms how to differentiate a Reversal Patter vs retracement patterns and Tried to add some context to the topic. This is not financial advise.
Another EX:
Retracement

Eye on the SPY! What I'm seeing and the potential moves.This movement we saw going in to Memorial Day Weekend doesn't give me confidence in the market reversing out of this corrective movement. There are many factors that make me think this is just a breather before we see more down trend. I will need to see more levels shattered before I see a clear uptrend. For now, I'm just playing the directional momentum, and waiting before I commit to more exposure in investments.

Pullback Buy In The AUD/USDThe Aussie has broken above topside resistance. Now, there's a pullback buying opportunity in play:
1) Buy 0.7152 (Weekly 38% Retracement)
2) Initial Stop Loss @ 0.7122
3) Profit Target @ 0.7182 1:1 risk vs reward ratio

Why Do Pullbacks / Retracements Happen?When price moves from A to B, it rarely moves in a straight line.
To get from A to B, price moves in that direction, retraces a little, then moves in that direction again.
Why does that happen ?
1. Natural supply / demand dynamics
The further price stretches up the less buyers join into the move. After some time whoever wants to buy already has bought. The others which have not yet will look for a retracement to buy again or to even short the move.Sellers will inevitably start testing the move. To see its strength at a point where they feel buying is at its weakest. As the sellers join the fight, buyers will see the upward momentum drop. Some will begin to sell out pushing momentum further down. The market makers who are moving the market the most will also reduce their buying pressure so they can save their capital to support the market after the retracement In order to ensure that there will be a higher swing low.
2. Manipulation by market makers.
"Saving their capital" sometimes generates whole trends, rather than just a small pullback. Long uptrends for long periods of times will eventually finally hit consistent supply above which MM will not be able to push further. At this point the big players will start dumping a large amount of their supply the market goes into a steep decline covering almost the entire distance of the uptrend before the big player starts to scoop up all the inventory at a low price and repeat the upside move again.
3. Shaking out weak hands
In order for a market to push higher. It needs to shake out the weak hands by engineering pullbacks. Weak hands will provide the necessary liquidity for the market maker to push the price higher.
4. Stops hunting. Market makers know perfectly well there will be traders moving up their stops up with the market. They will hunt them down. Sophisticated algos and trading programs will be used for this which further adds to the supply that causes retracements to occur.
If you enjoyed this information make sure to live a like!
Let me know in the comments what you think about it!

BTC to 25k or lowerIn the last few weeks, Btc showed an uptrend, that is lately losing momentum due to a lot of bearish pressure. This pressure seems to be manipulated, and Btc will more likely retrace to new lows below 25k. For now, Btc is building a descending triangle (diagonal red line and blue line), and fakeouts seem to trap bulls.
Possible scenarios:
1) If BTC goes up, it will probably not go over the short term resistance of 31k and will retrace to lower levels touching the blue line.
2) If BTC loses 28.6k support, it'll dive to 25k and below.
If none of these 2 scenarios happens, we will continue the sideways trend between 32k and 27k for a long while.
I would stay away from trading until positive signals.
This is not financial advice. Make your own research.

Dominance BTC - Inevitable MovementA recovery of Bitcoin's Dominance percentage is inevitable for a correct technical trend. This will reach 56.30% and then see it lower and lower in the future.

Fibonacci retracement long term projection $BTC $BTCUSDT $BTCUSDFibonacci retracement long term projection $BTC $BTCUSDT $BTCUSD
What if we apply the Fibonacci retracement levels in advance and we adjust the low for the current cycle to the next cycle so that it is the N+1 level.
So the current (N) 0.382 becomes the next (N+1) 0.236. Which give us roughly 120k. I am curious how this plays out.

FTM AnalyzeHi friends.
AN ABC correction will compelete in 38.2% retracement.
divergence between Rsi and price is clear (like i show it).
also momentum is in oversold area.
we see an volume profit support in 0.37$
and a volume profit resistance in 0.7$.
Good luck Friends.
(this isnt trade advise)

Buy NZDUSD retracement Hello traders.
Since DXY is getting weaker, the New Zealand dollar has also changed the order flow to bullish. This is after the Liquidity void below was filled and a breaker has been formed.
There is also the formation of equal lows which is a good signal of the bullish takeover.
Be patient to enter the trade at a lower price in order to reduce the risk.
Like and Subscribe.

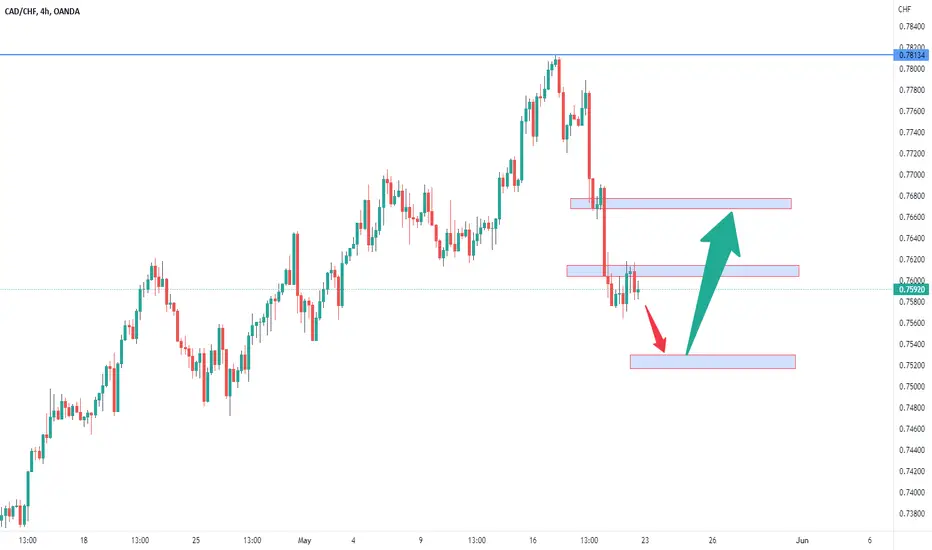
CADCHF PERFECT DROPCADCHF touched the resistance and dropped as predicted hitting both targets.
The price might continue dropping towards the pivot from where we can expect a retracement.
GBPUSD INVERTED HEAD & SHOULDERSGBPUSD has formed an inverted head n shoulder pattern indicating a bullish retracement is happening.
The Retracement target is the broken support turned resistance.

AUTO STOCHASTIC RETRACEMENT... 100% WORKINGalways we talk about fibonacci retracement and we know it can gives us good idea about the best key levels on the chart....
in same time i used to use stochastic to get that strong confirmation point to open or close postion...
and i found this stochastic retracement this level
0.9
0.5
0.2
0
-0.2
-0.5
-0.9
and it works with all time frame and pair's.............
stochastic sitting is (10,7,7)
====================================================================
this is some chart on different time frame
1 hour
4 hours
15 min
========================================
good luck

Chainlink at a fork in the roadSitting at $7.60 resistance, chainlink looking to test $9 but having difficulty doing so. Possible retest of support around $6.50 if it doesn't break upward. Watch out for the false break higher. Keep an eye on the candles. Watch out for long candles in the current stagnant trend, if that happens expect an inevitable retracement depending on the direction.. expect a hard retrace lower to an unbelievable $4.80 not currently looking that way but keep an eye on your tops and bottoms.

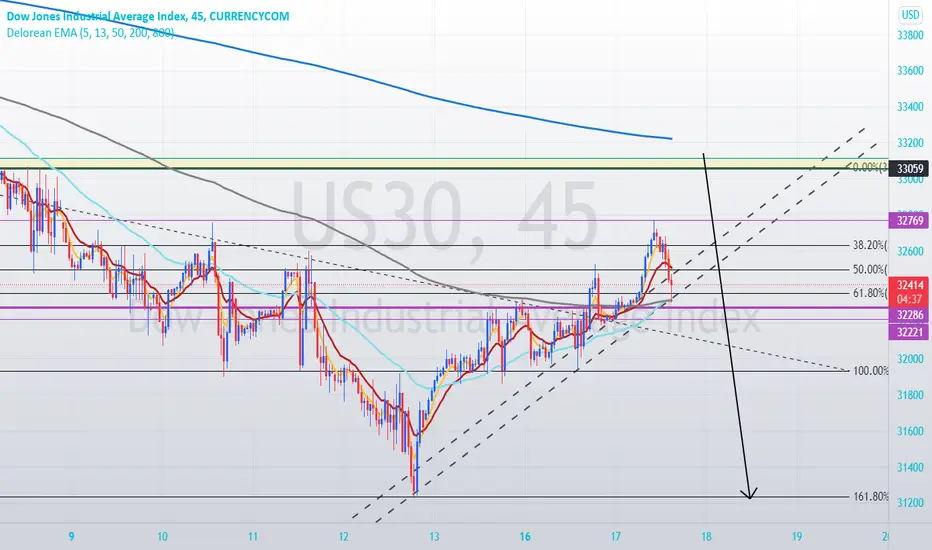
US30 MAY RETRACE TO $33,000 AREA Dear Traders,
I see the possibility of US 30 retracing to the 33k area before downward continuation. This Index has sold for so long and I expect reasonable retracement.
Trade safely.
Regards
Buy the retracement on AUDJPYHello traders
At the previous week's low, a bullish Order Block has been created which has led to the creation of a breaker block.
After the price rallied up high it retested the breaker block and created a bullish order block within it. I look forward to see the price rally higher to take out the liquidity on the upside.

Netflix entry time This point can be considered as the best time to take a long position.
I’m expecting 42% retracement.

EURJPY SURRENDERS TO BEARISH PRESSUREEURJPY dropped exactly as predicted in my previous analysis and attempted to rebound positively on the support level.
The retracement is still not complete and I'm expecting the price to continue dropping to 131.3 which is the 50% retracement level and monthly support.

DXY Dollar Index :- Day Trading ShortsPrice Chart making ASCENDING TRIANGLE on bigger time frame and on 12H TIME FRAME we see HANGING MAN on the top of above the TREND TINE and price is going to RETRACE and test the SUPPORT area then continue to the BULLISH SIDE ... We see on LOWER TIME FRAME price making LL 1 LH 1 we wait for price RETRACE back to LH then we enter that trade one possibilty is that and second is we wait for break the support area and retest that if we see comfirmationn like candlestick pattren or momentum then we looking for sells
TVC:DXY

EURUSD 4 - HOUR ORDER BLOCK MADNESSHi Traders,
Today, I want to go over two trades that I took.
These were short positions on the 4-hour Time Frame.
Both of these positions were based on Order-block entries.
Once I identified my Order-blocks, I waited for the price to retrace back into my retrace zone ( The green box on the chart )
When the price retraced into that zone, my short positions were opened.
My targets previously were the price structures below.
The Risk/Reward was 1 / 4
I only enter these types of trades if the price does indeed close below previous support.
NB ONLY if price closes below previous support.
These OB positions are lovely when they show up.
Clean, simple, and easy to see.
There is no reason to make your trading complicated. Keep it simple!
Enjoy the video below for a clearer explanation.
See you all on the next one,
The Vortex Trader

trade idea on TSLANASDAQ:TSLA
I can see TSLA retesting $800
If the retracement broke and the channel broke then my analysis is invalid.

Time for a USD retrace move? The US Dollar has been bullish for months... Global economic uncertainty caused by inflation, COVID, and the Russian and Ukrainian conflict have caused cash to flow to USD assets. Could the USD be currently over-valued? My analysis suggests that USD price is due a retrace move, especially on very over-extended pairs such as USDCHF, USDJPY, EURUSD and GBPUSD... Analysis for USDJPY and GBPUSD below...
USDJPY - 9 consecutive bullish weeks (almost a record?) Weekly RSI currently hitting over 88. Lower time-frames show weakening upside momentum. Possible retrace move due to previous monthly resistance at 124.00. I am expecting the retrace move to start by the end of June (hopefully this week as I am already holding out of the money USDJPY put options)
GBPUSD - testing key support area around 1.2200. Weekly RSI hitting around 22. Possible inverted head and shoulder trend reversal pattern (or range) on the weekly time-frame. I am expecting the retrace move to start by the end of June (hopefully this week as I am already holding out of the money GBPUSD call options).
Don't get me wrong, I expect the USD bullish trends to continue, perhaps now is just a good time to get off any long positions and open those shorts... Fingers crossed!

#AUDNZD# SELL FORECASTLooking for sell On AUD NZD possible reversal,,, possible retrcement to the previous resistence

Trade idea on Nasdaq SHORTCME_MINI:NQ1!
short entry on NASDAQ or QQQ at 50% retracement. It perfectly aligns with the top channel forming.
i can see NQ! back to retest the lower channel and bouncing at demand levels.
if the analysis is correct then the trade idea on TSLA will work as well.
if the NQ! break the channel and the 50-60% fibonacci levels, then the trade is invalid.
