Buy BTC It is The Right timeIt Has Been holding This can be a good Opportunity.I
If you are leveraged in TC please keep a conservative 23% stop. But if you are just Buying... forget about the stop and just buy... It will not be for ever
Retracement

BBMA : MATIC still BULLISH.Here is my follow up on the Bearish MATIC analysis.
On this Daily Chart, there is momentum candlestick that break above the Daily Upper Band. The key is there is no Extreme Momentum shown during the break. (Which is the 5/10 High MA break the Upper Band. This tell us that the Bullish Momentum is still VALID.
You can Buy using Cost Averaging at MID BB and if the price goes down, Buy more around the 50 EMA Zone.

MATIC SHORT TO $2.19 (or) $1.97A quick analysis on MATIC using both wave theory, Fibonacci analysis :
Wave theory Analysis:
1) MATIC had a nice IMPULSE run-up from Jul 18th to Sep 4th going from $0.61 to $1.78 after a big correction from the previous high of $2.81 to $0.61
2) After a good impulse phase comes the CORRECTION phase, markets usually stay two-thirds of the time in a correction phase
3) Looks like the 2nd wave correction is a simple zig-zag correction touching the support at $1.01 on 25 Sep 2021
4) New impulse Wave 3 then started from $1.01 on 25 Sep 2021 and ended at $2.91 on Dec 26, 2021
5) Wave 3 are usually the longest in the 5 wave series and this seems to be a perfect extended W1
Fibonacci analysis :
1) Wave 2 retraced perfectly at 61.8% of Wave 1 to at $1.01 on 25 Sep 2021
2) Wave 3 extended perfectly at 161% of Wave 1 to $2.91 on Dec 26, 2021
3) Now its time for Wave 4 which I think might take support at 23%, 38% or 50% retracement
4) Right now the Fib 23% is being tested at $2.47, if it doesn't hold maybe next support at 38% $2.2 or at 50% at $1.97
5) Once the FIB 23, 38 & 50 are tested then it will be on its wave 5
Pattern Analysis:
1) In the short term it fits into a nice classic head and shoulders pattern
2) The second shoulder is being just completed
Summary :
-------------
1) Looks like the bears are still in control on Wave 4
2) The support line Fib 23% is being tested at $2.47, if it doesn't hold maybe next support at 38% $2.2 or at 50% at $1.97 should be tested
Happy New year and happy trading guys !!!!!

CHFJPY - In Trend Engulfing Long Setup 4HCHFJPY has formed a perfect in trend engulfing long setup on the 4 hour time frame.
The engulfing candle formed December 23rd at 8am (closed at 12pm noon) engulfed 3-5 previous candles.
A perfect rejection and wick through 61.8% retracement level confirms this long setup.
Entry is at the 61.8% retracement level.
SL is set 2 pips below the engulfing candle low.
TP is set at 3X the risk.
Very similar setup to EURJPY which confirms JPY weakness.

(BULLISH) 3 Point Retracement(BULLISH) 3 Point Retracement with Hidden Divergence and 0.382 fib confluence appearing on the hourly charts of Bitcoin
Entry: $49.500
Stops: $48.800
Break-Even: $50.400
Target: $52.900
Good luck to all trading BTCUSD!

SHIBA INU retracing before SHOOTING for previous high at 0.00088The token has cleared previous near equal highs at 0.00061313 before the bears took over so I expect the retracement to last until the range, 0.00055708 and 0.00050039 .

NANO's New Groove Hello people!
I like trading NANO and now it seems we are reaching an interesting stage.
I used fib retracement and fib speed fan to determine realistic trading ranges and time frames.
I believe that the range 7.7 5.3 is where it seems to be heading if the movement keeps the inertia.
The price can easily navigate waters under 5.3usdt for a long time eventually leading up to the price of 11.8usdt
Breaking 11.8 we are going to have another interesting moment in the price action, potentially meaning moon or drastic fall. Both represent potentially profitable opportunities.
However, I do not make any recommendations.
Thanks for coming on this journey.
Happy trading.

XAUUSD short I see a nice potential short position at the NYC opening tomorrow theres low volatility as its Christmas but a nice supply area will be our entry and it'll also be a 78.6% retracement on the previous drop into demmand. The short term POC is also below price around our TP. 1800 will be a tough level to break.


Bitcoin need retracement before 50K+Hello Traders!
Bitcoin is ready to give some retracement as it has broken the S/R level but it never tested back so it will come back after exhaustion.
According to my theory, the market never abandons any S/R level and the Market leaves its print on every S/R level. In this case, 46579 S/R level is still unused and the market will come back to leave its print above this level.
The market always forms multiple patterns before coming back to the level.
Don't forget to hit the like bottom and follow to stay connected.

Potential Crab Forming 🦀USOIL - Potential Crab Forming, after yesterdays bearish move price rejected from the Daily demand zone and is potentially going to continue it's bullish run, I'm waiting for a fakeout/pullback with LTF before potentially swinging this long! (I will probably scalp the LTF both direction with confirmations)
Let me know your thoughts?
** Disclaimer ***
These ideas I never trade until the end target with my initial lots, I focused on high probable entries with higher lots and use a specific partial taking strategy giving me a very high win rate and take most of my profits very early, I only leave a small % of my capital to run the entire trade. On the flip side im constantly monitoring LTF momentum and will close early if things change, these analysis's are for research purposes only.

NKE Short to 61.8 Retracement. NKE tried to consolidate and break higher but has since failed. Consolidation broke to the downside and retested the support on a long wick. I believe this trade is short as long as we are below 166. The target to the downside is the 61.8 retracement level at about 158.

BTC My Humble Future Price Prediction In this idea i want to present how i personally see the price of BTC to behave especially after the abc retracement and alt season. Price will of course behave much differently than of what is shown on the chart, also from the time perspective. The main purpose of this is to show that this bear market can last much longer and get MUCH deeper.
Usually btc is expected to eventually correct down into the 13-15k, which would be the normal 85% correction from its ATH, but..... i know you gonna hate what i am about to say ...
Right now it is absurd to think btc can see 2.5k at one point in time, but let me tell you this... btc has never experienced REAL stock bear market. Usually during the btc bear markets, the stock market went sideways more or less, then up again as btc went on the bull run. Dow is expected to collapse below 2008 financial crisis (explained in previous ideas abot DJI) like it did in 1929 where it went below 1921 bottom (now days 2008). Till then it is yet to be seen what will happen to crypto if all this is to play out in the future. I would personally see this as the best investment opportunity of our lifetime.
Stay safe.
I am not a financial advisor so non of this should be taken as a financial advise.
BITSTAMP:BTCUSD

BTC Looking For A Possible Short Squeeze To HappenI know I've mentioned this many times now, but still... Either it happens from here, or maybe we have to grind a bit lower to shake retail investors and grab large orders between 42-45k area. In such situations price first moves up relatively fast into the capitulation area (54-58k), that presents a huge resistence right now, then it BTC continues to crash. It is also a low possibility, that we could just broke 42k from here and finish the crash then go into a retracement, but i highly doubt that. I still expect prices to fall into the 33-38k, depending on how laveraged BTC is or will get especially if we get that massive short squeeze. A lot of retail investors will get euphoric on the squeeze and will open over laveraged long positions right at the end of a squeeze. What comes next is a massive liquidation event largely because of over laveraged market.
I am not a financial advisor so non of this should be taken as a financial advise.
BINANCE:BTCUSDT

(BULLISH) Gartley or Flag ?(BULLISH) Gartley pattern appearing on the 4-hour charts of Bitcoin!
Or is it a flag pattern ????
Good luck to everyone trading BTC!

Will Harmony repeat the last run?During the first run Harmony reached a 5100% increase and then retraced to 0.61 Fibonacci within a symmetrical triangle.
This led to a breakout of the triangle in a positive way by proposing a new run that led us to an increase of 459% .
It currently appears to be heading towards a retracement in the 0.61 Fibonacci area within what appears to be a new symmetrical triangle .
If it continues inside the triangle we could expect new All Time Highs between May and July 2022.
Otherwise, if it were to break the pattern, we could find ourselves facing a bear market period.

Fibonacci levels giving crazy levelsIf we do a fib retracement from ATH to the local bottom of 30K we can notice that the middle top is located a 0.38 fib level.
If we then do a second fib retracement but this time using the 40K local bottom and align the 0.38 with the ATH we can see that it's targeting 110K
I'm not betting my life on this analysis but it's interesting to see what would happen if it played out.

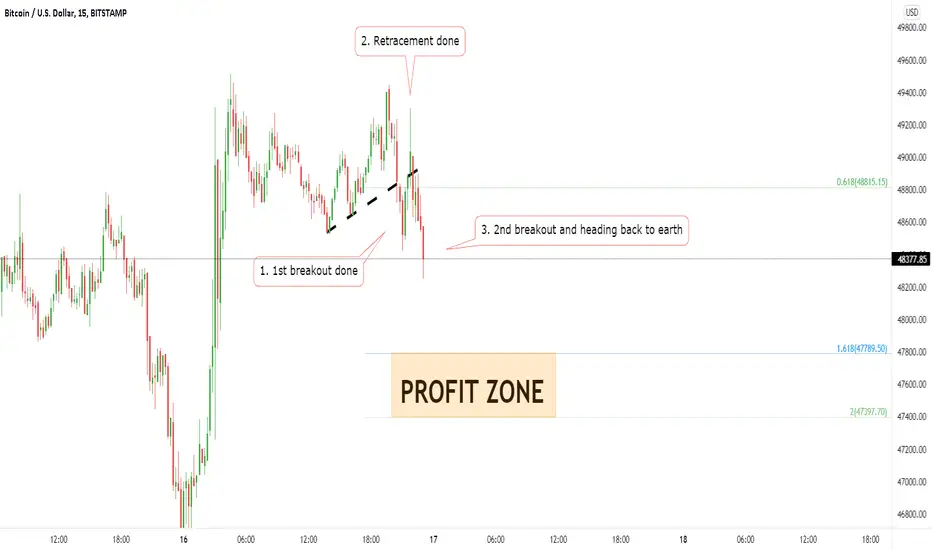
Bitcoin trading and back to earth update on 16 Dec 2021Short-term trading Bitcoin
Follow my entry points,by fullfill 3 steps
1. 1st breakout done
2. Retracement done
3. 2nd breakout and back to the earth
Good Luck ~
ETH Bullish And Bearish Scenario - ETH In The Gray Area Eth is at really hard place right now. As with BTC its market cap chart has already extended aver all major fibonacci extension levels (will show the chart later in the update of this idea). While i am confident that BTC has entered a bear market, i am a little less with ETH. Imo there are two scenarios for eth, one is bullish , the other one is bearish . Whatever scenario first happens i think in both the price will likely pump a bit to retest a previous capitulation point (blue area). After that we should fall with BTC . If ETH is able to find support in the yellow area we should be able to eventually set a new ath , but not go above 6k as eth is very overvalued as it is with BTC . If we don't hold and fall in to the orange area or even set a new low, you can be quite shore that also eth has entered a bear market and the money will flow from BTC and eth into the rest of the alts as they are going into a ABC retracement.
Again with BTC a am shore we are done, but not so much with eth as we need more information of the price in the near future.
BINANCE:ETHUSDT

XAUUSD 1H-4HFalling wedge inside a double bottom pattern! This is just a retracement of bearish trend i think!
Whats your idea?

SXP elliot analysei belive that the yellow box is a best place to buy SXP at least for short time we expect a good pump there, we should see what is BTC position nxt days

(BULLISH) 3 Point Retracement(BULLISH) 3 Point Retracement appearing on the hourly charts of Bitcoin
Trade Execution and Management
Entry: Buy Limit 0.618
Stops: 0.786
Break-Even: 0.382
Target: 1.272
Good luck to all trading Bitcoin!

BTC My Personal View Of The Price Action For Next Few MonthsI expect BTC to eventually fall through this orange rectangle price area, like it did right after setting the ATH at 69k. Retail investors still have a lot of hope that BTC price will somehow recover from here and that is not usually the sign that we've bottomed yet. After capitulation i expect the price to first reach 0.618 fib. retr. lvl., then have a bit of correction, only to recover to right about 0.702 fib. retr.
Obviously price will almost certainly behave differently than what i have shown on the charts. It is just how i visualise it at the moment.
Below in the update a will show how such ABC retracement happened after BTC reached its ath 2013/14 and 2017/2018.
I am not a financial advisor so non of this should be taken as a financial advise. Be well.
BINANCE:BTCUSDT
