BTC: targeting 69.5k as a TP.If 59k was a key level and 64.5k was the midrange, i’m looking at 69.5k as a possible first stop. 70k is also a psychological level.
We could even get a 66.5/67 > retrace to 64.5k midrange > blast off to 69.5k. This is inside the realm of possibilities.
Good luck!
Retracement

Potential Crab Forming GBPUSD - Entered a short on the retraecmet, looking to complete this crab, fill the imbalance the potentially go long if targets are reached and PA confirms it!
Whats your thoughts?

GPUSD retracement. The pair has been on an uptrend recently and today being a Wednesday we look to sell on the retracement but later look for buys on the price indicated.

The Fat Lady Must SingIt ain't over till she sings. Overbought, again... gaps to fill near pivot price. More volatility incoming IMO. Trade with care!

NZDCHF - (D) IN TREND BEARISH ENGULFING SETUPNZDCHF has formed a significant bearish engulfing on the daily time frame
Entry at the 50% retracement level has been perfectly rejected 3 times.
The bearish engulfing candle engulfed 5 previous candles.
The daily time frame bearish engulfing candle closed Wednesday.
SL set above engulfing candle high. TP set at 3X risk.

SHIB is going to bounce at 200 or at 150 ? I think there are big demand zones there, let'see what happens.
There are also important fib retracement levels (0.382 and 0.236) of the entire rally.
I am going to enter at 150 with target 330 for a 1:5 Risk-Reward trade

WHETHER 200-EMA WILL STOP THE PHIZEZ SLIDING MODE?The Pfizer Inc. Stock has been in a sliding mode since August when it hit its all-time high at $51.84 per share. However, the slide was stopped yesterday from strong support 200-period Exponential moving average and 38.2 Fibo level, which prevented the stock from drifting lower. Overall, the stock continues to trade below the downside line taken from the high of September 7th, which keeps the short-term outlook negative. However, in order to get confident on a trend continuation, the experts would like to see a dip below $41.50.
A decisive break below that barrier would confirm a forthcoming lower low and may initially target the $38.15 per share hurdle, defined as a support by the 23.6 Fibo corrections. If investors are not willing to buy near that price, then the price could experience declines towards the $33.44 area, which acted as a temporary floor for the stock between October 2020 and March 2021.
Looking at our short-term oscillators, we see that the RSI moved lower but ticked up from slightly above 30, while the MACD, already negative, has just fallen below its trigger line. Both indicators detect downside speed, which enhances the case for further declines in this stock.
The move that could change the short-term picture to positive is the subsequent rebound from 200-EMA and 38.2 corrections and a break above $42.65. This will confirm the break above the pre-mentioned downside line and a forthcoming higher high. The bulls may get encouraged to push the action towards the high around $44.84 or the peak of September 07th, at $47.52. If they don’t stop there, we could see them aiming for the all-time high above $50.00.
Risk Disclosure: Trading Foreign Exchange (Forex) and Contracts of Difference (CFD's) carry a high-risk level. By registering and signing up, any client affirms their understanding of their own personal accountability for all transactions performed within their account and recognizes the risks associated with trading on such markets and such sites. Furthermore, one understands that the company carries zero influence over transactions, needs, and trading signals. Therefore, it cannot be held liable nor guarantee any profits or losses.

AMD short opportunityAMD: Using fib retracement, after an impulsive move a pullback to the 0.5, 0.618, or 0.786 is very likely and healthy in an uptrend.
~ Golden cross happened on the 11th signaling the start of another uptrend.
~ on the 11th AMD did a similar but smaller sized impulse with a pullback to the 0.786. This helps visualize the theory of fib
~ RSI on the hourly has a lot of room to "dump"

BTCUSD: More lows, retrace not over if healthy.Since end 10-2021 btcusd had a straight surge by almost 50% within a bullish mid term trend channel. Retracements were only minor, if any. But trading volume got lower on the way, bulls lost some power. For a healthy further upside, price should retest the last important levels to confirm the upside trend. It already went as low as 54.5k.
BTC already tested the .786 fib level of the range it traded in for the last 7 days, which is placed together with the .768 retracement level of the last major correction from Apr-Jul 2021. A retest of the .236 fib level (at least) of the current mid term upward trend should be on the roadmap, too. Hence, prepare to get as low as 53.6k in the next hours and days.
If supports hold, next price level to look for is around 64.4k.
_____
Of course, this is not a trading advice, just my private analysis as well as a text for entertainment purposes.
Never put your heart and your money in the same place.
You could end up with your balance getting f***** while you're doing the hard work.


Crab Complete Now The Bat! Crab completed along with small rejection now i'm looking to trade the CD leg of the bat, we have a very strong OB at 154.673 area, the bat could easily turn into a shark pattern sending us into some DD but I'd rather get in early in case we miss a potential reversal, start with small lots until we get confirmation of PA reversal if your trading this potential retracement!

Wait for a buying opportunity with AUDCADH4 time frame.
Structure: Downtrend.
After the price down to the support level of 0.91000, a double bottom pattern and divergence signal appeared.
Wait for the price increase to break the Key level at 0.92000 and have a confirmation move, then you can find buying opportunities.
The profit target is the 0.92700 zone.
-----------------------------------------------------------------------------------------------
Wish you all have a good trading day!

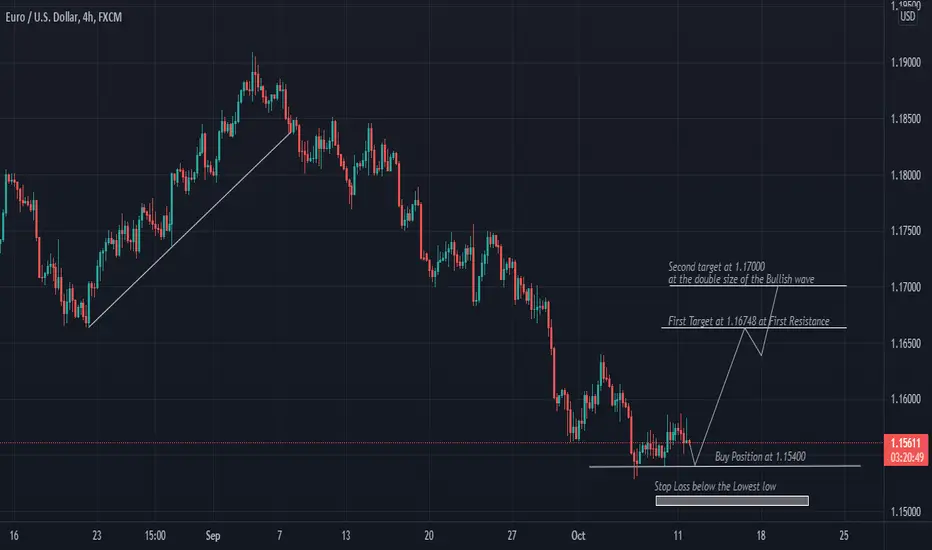
EURUSD Retracement Beginning On the 4H its clear for all that the price made rejection from the 150% Fibonacci extension after making new lower lows and now we all see the price preparing for a new highs before the continuation of the Bearish movement on the DAILY chart
we expect that the prices will start the strong bullish momentum after testing the levels of 1.15400 and the prices will start the upward movement and making new higher highs at the 4H chart , however we can position our orders at the numbers we mentioned before and our fixed stop loss will be below the lowest low plus the average true range of the 4H chart which will be equal to 1.15000 with 40PIPS RISK and regarding our targets our first potential target will be at the first resistance at 1.16748 with more than 120PIPS Profit and from there we will check the Price action for the second target at 1.17000
USE MONEY MANAGEMENT
TRADE SAFE
ETHEREUM IDEA!ETHEREUM broke the bearish pattern to downside, but was a fake out.
My idea is that it will try and tackle the upper resistance line of the channel that it keeps getting rejected at, If it gets rejected expect a sell-off.
This could see a retracement to the lower resistance line of the channel at $3350, if this fails then expect a 20% retracement to S1 at S3000.
Safe trading.

fibonacci retracement reach 50% and touch 38% a bullish sign nowFibonacci retracement reach 50% and touch the 38%
put stop loss below .236% 52502.66
take profit at 1.618 59581.54
if you make money from this TA feel free to support, follow, share and like.
DYOR
not a financial advise. i am not a financial adviser.
LET US MAKE SOME MONEY!
weekly timeframe bullish.
yesterday was a retracement now bulls are back.
all the best!
cheers!
leave your thoughts below what you think about it.
I long 20x

Total Market Cap UpdateI advise caution by Sunday as we get to the top of our Fib level and moving averages begin to curl down. I only expect a correction and not a mega dump but taking longer time frame long positions at this time is not advised. Watch for total to break that Fib level at apprx 2.46 Trillion for conformation
As always these are only ideas. Nothing to base your trades or finances on. Good luck

Time For A Pull Back?Hi all,
We had a great breakout above the down trend and the neck line together, showing major sign of strength, however got rejected from the dangerous neck line. It's good that it was surpassed and now it's weakened.
Downside target of a retracement and a retest of the down trend line happens to intersect with Fibonacci 0.382 at 49.600. If that is lost, we have 47.660 also coincides with Point of control and 45k as the last retracement levels. If 45k is lost, then it's game over :)
Upside target, 60k waits as a weekly and physiological target.
We should wait until support or resistance levels of the current sideways trading range is broken and verify the direction with a swing failure.
Note that there are many bull and bear traps now, so don't FOMO into anything, set your alerts and wait for confirmation before taking action.
But hey, what do i know :)
Trade safe!

Sell zone on GOLD after NFPWe've been waiting for this push on GOLD for a whole week now
A push that takes price up into our sell zone 1777-1790. As soon as we get an entry signal we will enter short with stops above 1810 and targets below 1725!
Those signals could be on the H1 timeframe as well!
Market closing below 1756 will only confirm our idea, therefore we can add to our positions around this level. We will look at this in our analysis next week.
Support us with a like and a comment!

Wait for retracement and buy signal with AUDUSDH4 time frame.
Structure: The downtrend has been broken.
Key level at 0.73200 was broken.
Wait for the price retracement to confirm the uptrend on the 4-hour timeframe and then look for a buying opportunity with AUDUSD.
The confluence between the 50-61 Fibonacci level and the 0.72400 and 0.72200 support levels is a potential price correction zone.
The profit target is 0.74800 zone.
-----------------------------------------------------------------------------------------------
Wish you all have a good trading day!

BUYUSDT LONGAfter completing the W4 wave I believe that this coin will start another impulse which is going to ascend until the next resistance.

Rejection of a level on GOLDYesterday we looked at two different options to enter short on GOLD.
There is still a higher probability that we will see another push up to 1780 and then a rejection.
NFP is due tomorrow and that could be the beginning of the next move.
Before that any trades will carry higher risk and they should be entered with less volume.
We are monitoring the 1789 level for a possible reversal from there!

EURUSD CORRECTIONwe are now getting a correction to the EU bearish, here are possible points of possible reversal.

buy Audusd after it broken up trend linebuy Audusd after it broken up trend line and it's retracement above key level
AUDUSD
TYPE : BUY
TF : H2
ENTRY PRICE : 0.7290
STOP LOSS : 0.7235 (55PIPS)
TAKE PROFIT : TP1: 0.7310 TP2: 0.7350 TP3: 0.7400 TP4: 0.7455
