BUY GOLDGold is in a bullish trend after breaking market structure on the daily timeframe . Price just needs to retrace back to 1800 zone/ orderblock that formed after BMS, and then we'll load buys to 1850/1869 to fill up the imbalance.
Another interesting area to look for a buy is around 1814 area which has just activated with stops at 1804
Retracement

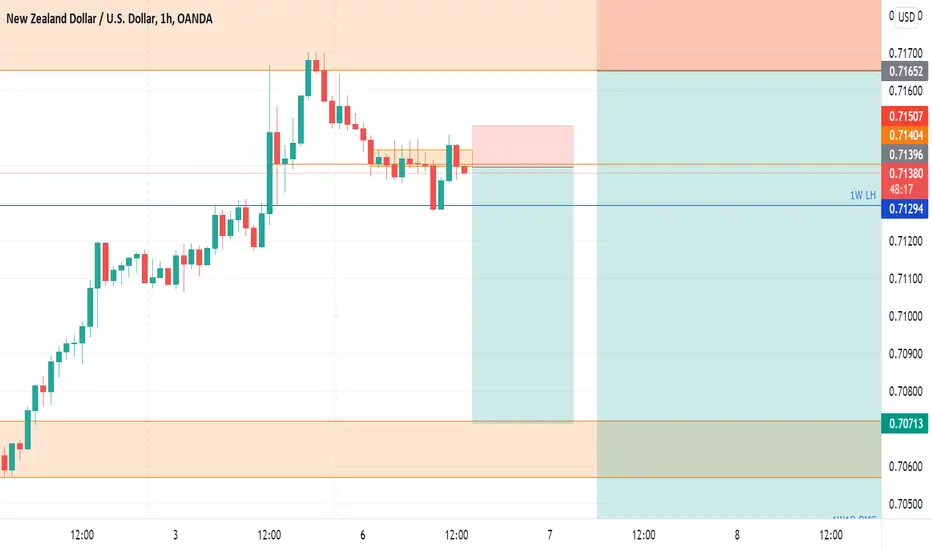
SELL NZDUSDIf you missed first entry at 0.7165, you can take a sell at cmp. I think it is on a retracement for us to add more buys as per the previous analysis.

EURUSD Bearish Retracement to 1.18300 before goint UPEURO OVERSOLD Is now Bearish, It will go DOWN
Short Sellers will take advantage of the buyers liquidity
And EURO Will fall at list to1.18300 maybe more before going up.
New Buyers will come lower to consolidate.
NFP Had a little impact because a lot of sellers are already positionned under 1.19
This is just an idea not a financial advice

Short Sell, Long BUYAfter BMS at 1.3753, price retested the nearest OB on daily and rallied up. We continue to see the rally and we have just filled an imbalance in 1D. We could see some sells from here.
Alternatively, we could continue to rally up to the weekly OB at 1.4065 where we will look for sells

Short Sell, Long BUYAfter BMS on daily tf at 151.00, the price retested the OB right after, and then rallied.
We're currently headed to the Daily zone/OB at 152.88 where our buy targets are, and then we'll look for short term sells to 149.88

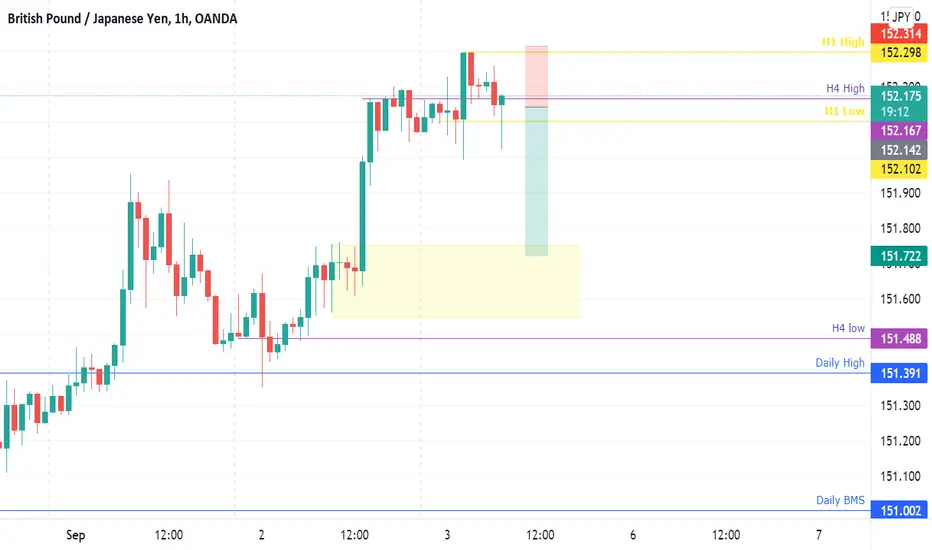
Short term SELLWhile we're still on a rally on 1D to the next supply level, I'm taking a short sell/retracement to the H4 OB and then I'll look for buys.
Retracement trades are risky if you don't know where to exit
SELL GBPUSDAfter a good rally, which we caught, of course, we're currently reacting to an imbalnce on the daily that has just been filled. It's highly likely to see some drop on this level since we've also broken market structure on the H1, 1st target indicated on the chart. All the best

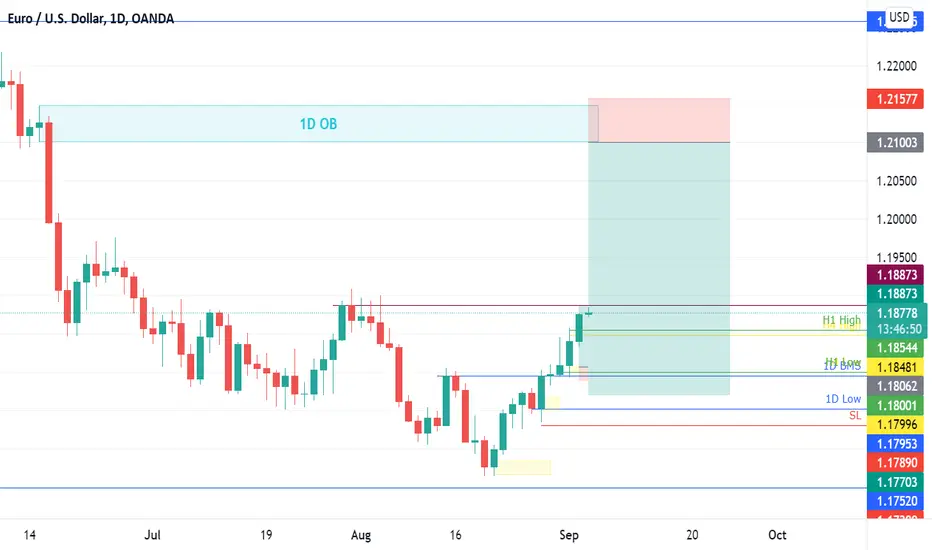
Short Sells, Long term BUYAfter BMS at 1.1800 we have been rallying. Price has just touched the previous LH at 1.1887 and we might see some reaction from there to the downside 1.1778 or the main OB at 1.1704
Alternatively, it could continue rallying to 1.2100 where we have a daily zone, we'll take sells back to 1.1778
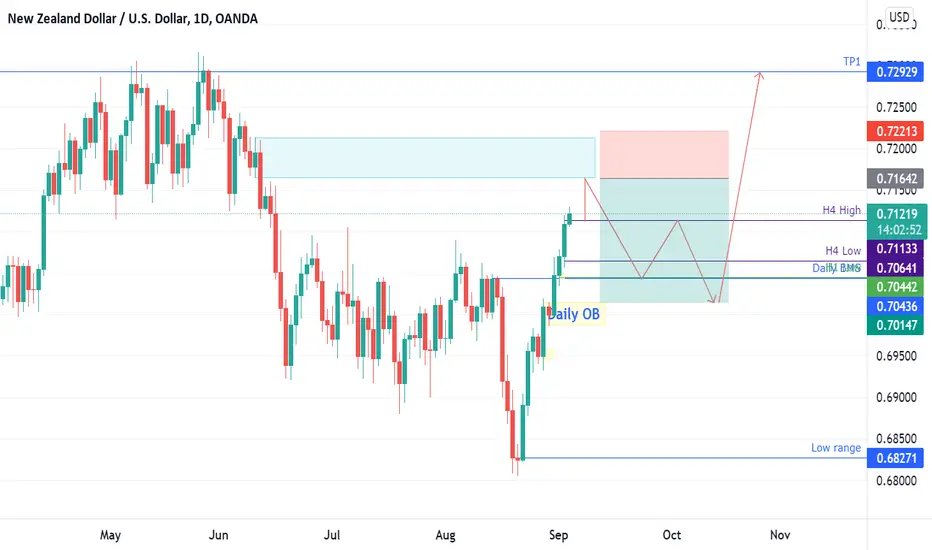
Short Sell, Long BUYSince it broke market structure on the daily at 0.7043, we've been rallying.
I think it'll continue up to the nearest daily OB at 0.7164 where we could look for sells back to daily OB that formed after BMS at 0.7015.
Note that this will be a short term sell, and long term buys
BTC potential DROP - Low Volume - Calm before stormWith thousands of BTC tokens being moved over to exchanges from storage and the lack of buying volume shown, overall volume is currently under it's 24 hour MA. We will likely see a drop back to 46,600 if we break 46,300 we will likely see it fall to 45k for a small bounce back up. I suspect 43k we will see volume come back to push it back to 46k. 43k is the last time there was significant volume to make big moves upwards. Stochastic RSI is banging the top on 1hr and is still settling downward on the daily, not to mention overbought on the weekly. MFI is not looking like we are due for any big price action movements upwards either.
whales are not going to just dump 1000 BTC all at once, they do it incrementally because they know that after every drop retail will push it back up. So they can create an invisible sell wall. The fight between whales is who will sell their lots at a lower price, constantly under cutting each other and forcing each to move their sell prices lower, which to retail traders looks like "resistance"
Just my two cents, I am not in BTC trade but obviously what BTC does most alts follow accordingly.
Trade safe.

GBPAUD AnalysisBearish on this pair till the end of the the year due to the morning star candlestick printed on the weekly. Go with the trend.

BTCUSD: awaiting monthly closeafter a green monthly close (perhaps 53k levels) a retrace to fill some OB inefficiencies and consolidate further. setup for that move here
in alts i am searching for a different variety pattern; will link in comment below with analysis.
Trading Disclaimer:
All trades and ideas posted from this account, including setups, are given for educational purposes only. 95% of trades never win, and instead realize losses. Trading involves risk, there are zero guarantees that you will win any given trade, including this one or others related to it or this account. If you follow any setups, you do so at your own risk, taking full responsibility of any actions and / or outcomes. Nothing posted is to be taken as financial advice. The information and opinions presented by this account should not be construed as investment or trading advice, and is not meant to be a solicitation or recommendation to take actionable trading on any asset, cryptocurrency, securities, or any other tradable digital asset.
All content presented is for entertainment and education.
No Financial Advice.
Past performances are not a guarantee of future outcomes and or results: trading involves strategizing probabilities, there are no expectations on any given trade.
Always do your own research and consult a team of professionals from finance and law before proceeding with any type of action in personal finance.
All information provided by this account is a general market commentary and does not constitute investment advice or financial advice. None of the information communicated in this accounts tradingview publishings are financial advice and/or incentives, solicitng, advertising, manipulation tactics, and any other malicious behaviour - no, solely for entertainment purposes ONLY.

Long 🟢 Bullish Wedge, BullflagAI thinks a wedge pattern broke out (green) on the chart.
The upside movement means a bullish setup.
Retracement in this setup prints a bullish flag (blue).
The price will emerge from the flag and reach the target box (orange).
A retest of the wedge support lines is possible.
Don't liquidate yourself!

SHORT position on NAS100My current view on the index. Trade with caution as this index can be very volatile. Currently BEARISH on NAS100.

ETH possible entry area for a LONG positionETH is finally retracing after a great performance in the last weeks.
The 20D EMA will probably provide again a nice support for a future growth.
In case of a break under that level we can assist at a proper trend reversal and go test some old resistances flipped to supports.
The areas in the chart are possibile levels for a LONG position.
What's your guess?
*Not a financial advice*

Wait for a buy setup at 1795 with XAUUSDH1 time frame.
Structure: Uptrend.
The price broke out of the descending triangle pattern and continued to rise.
The price broke the 1795 resistance zone, now can wait for the price to a retracement to this zone, retest, and appear the Price Action setup to buy with XAUUSD.
The profit target is the old resistance at 1834.
-----------------------------------------------------------------------------------------------
Wish you all have a good trading day!

EURJPY Retracement or Reversal?The main trend is Bearish, however on H1 TF bullls are in control. Is this move a retracement or reversal? We have to watch and see. At this moment, I'm not interested in the bull trend. I'll only look for my sell setups. Good luck.

SHORT position on USDZARThe pair is currently bullish on Daily timeframe. However we might be in midst of a retracement in order to continue with uptrend. I am SHORT on the pair as intraday trade. Let's see how this plays out.
This is not a signal, just my point of view.
Will update as time goes on.
God Bless!

CADJPY Sell IdeaCAD JPY CHART PATTERN FOR SHORT TERM BUY AND LONG TERM SELL, formed a Head and shoulder pattern on daily and moving towards to the retracement level for the monthly trend line

MY EURUSD VIEWI will be watching this setup to play out in the couple of weeks to come from now.
we might see 11750 before another fall.

Updated view on XRPThe pair seems to be going for a deeper retracement. Perhaps based off weekly timeframe which will be perfect as the is a strong level of resistance which will be turned support if tested and rejected.

1Inchusd Sell TradeHello traders!
1inchusd is in the correction form and it is now ready to break the supportive trend and will break the previous low.
Stoploss is -2% of the investment and target is 6% of the investment.
Don't Forget to hit the like button and follow to stay connected.
