NAS100 Retracement Monday? 05.07.2021The index was performing well again last Friday 02.07.2021, more than 200 dollars upward move and now settled after hitting the resistance 14740.
>> Well, the Fibo retracement to 61% of the move might be actually possible.
>> Indicative Calcs: 1 index trading with TP 14673 generates approx 35 Eur, while the SL can be above the 100% fibo level.
Retracement

BTCUSDT - Do you want me to for the dips?#BTCUSDT 31.05.2021 1W
Since April 14, when we closed the long position (63k USD), the BTCUSDT pair has suffered a -50% drop in 45 days. Although there are multiple reasons to technically understand the decline, it is also true that this is a young market and with certain participants that move huge volumes, called whales and krakens, which are unthinkable for a shrimp or plankton such as the ordinary citizen. When a wallet with a lot of bitcoins moves from cold addresses to an exchange, it is a sale alert that scares the market without even the sale itself having occurred. It is also healthy to remember that one of the essences of this market is high volatility and if you see difficulties as opportunities, it is something you can tolerate if you have always followed the advice not to invest beyond the money you can afford to lose.
China has never liked BTC and from time to time some related news appears that later remains as an anecdote. About Musk and his media show is just that, a show and has contributed to a greater interest of the #nocoiner public in the world of crypto assets so any mention is positive, they say that bad publicity does not exist.
Our forecast for the MA10 MA20 crossover was advanced a couple of weeks due to the price drop that has put MA10 on a tighter curve than expected. This supposes the exit of the bull market and the beginning of a crypto winter. Our RSI forecast has been correct as it is in the expected accumulation phase and a lateralization phase begins. The faces say it all.
Taking the cross as 1 and a retracement in #FIBO there is a high support at 0.786 that allows a time of accumulation and stabilization after the drop of -50%. At the end of this icy season, a second big fall comes that breaks the 0.618 and tests the 0.5, to then start a new spring. We do a close up on the forecast to clarify. Point E is an alternative in case of looking to test resistance to 1 in the 49k.
They always ask me at what price it is good to buy bitcoin, the answer is, learn to make your own decisions because every day is a good day to buy bitcoin (and ethereum).

EURAUD ABC RetracementSame rules as my previous post on AUDUSD, Just scaled down a tad. This is EURAUD on the hourly timeframe. We have had a sharp sell off indicating reversal as well as healthy RSI conditions. Good Luck!

AUDUSD ABC RetracementHey everyone, back again with another swing trade. This is AUDUSD on the weekly timeframe, as you can see the 5th and final impulse wave is complete, I'm a tad late but we are in the ABC Retracement wave. Good Luck!

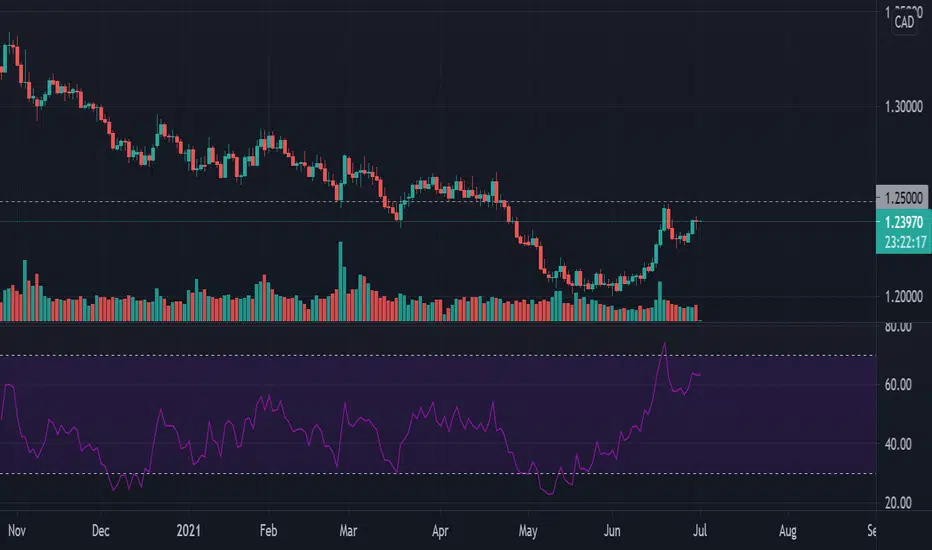
to the 1.25 area as next target..then 1.26-1.28Expecting rise to 1.26-1.28
weekly; After supply has been in power for so long, demand started showing power ever since the week of the 24th May'21 and had kept increasing after that showing more presence, especially after it broke upside the 1.21 area.
On the daily
- From the 15 June to the to the 16th June price moved up to the 1.25 area on increasing considering demand. Then from the 21/06 to the 23/06 made a retracement to 1.22 and showed signs of supply weakening with some absorption of it for again after moving it to the 1.25.
Which long-term makes me bearish but on the short term expecting a re-touch back to 1.25 and 1.26-1.28 zone as next target at the break upside 1.25 on a SOS
WISH is on the way to make a huge move. We never gonna miss !!WISH is clearly offering a golden opportunity to go long.
Stock beautifully completed a 5 declining waves and has started a new motive wave. So far it has completed it's wave 1 of new impulse and more than likely has completed wave 1 of 3 as well and currently is making its wave 2 of 3 which may ends at proposed buy zone shown on the chart corresponding to 0.5 to 0.618 Retracement levels. What all these means? We are ready to catch a golden move !
There are some moments in the market that there should be no more hesitation and thinking. I believe that wish is offering one of those moments. But please take it into consideration that we trade based on facts not hopes and wishes. If you opened the position stick to your stop loss objectively.
Wish you huge profits my friends!

BITCOIN DUE FOR CORRECTION?BTC is set for a due correction having been unable to break out above the 35900 levels.
I expect a retracement to 32,459 ranges for a healthy ride, and 31200 for a threatened ride...
This is coupled by a marked decline in tradeable volumes.
However, my submission on the overall is that we may not see a deeper bottom than we'd witnessed this week.
This is solely my bias..
Not a financial advice.

TSLA is reaching to strong resistance, Watch carefully !TSLA will face a really strong resistance soon. Is it able to defeat the resistance? Watch carefully.
Descending trend line, 50 % Retracement of last drop and Kumo flat of Ichimoku system have made a strong alliance to push the TSLA back down. Moreover stochastic indicator is in overbought zone in daily time frame.
It is worth to note that general trend of TSLA is down going.
Please note that we need a bearish sign in every proposed resistance to go short. We do not go short without a bearish movement.
My Recommendations:
1- For those who already have shares: Watch the reaction to proposed resistance carefully.
2. For those who want to go long : It is too risky now, Calculate your Reward/ Risk carefully and stick to your predefined stop loss objectively.
Good luck my friends.

TRCH - This is a test of the 50% Principle - Retracement neededThe price action on TRCH was expected. On the weekly chart, it was too disconnected from the HMA and RSI was on a down trend. When price gives you higher highs/lows, and the RSI gives you lower highs/lows, this is your Regular Bearish Divergence. This is purely the technical perspective on the way the chart is playing out.


US30 - 1H - DIVERGENCE - SHORTAnalysis:
US30 made rally upside yesterday, with a 2% positive change. In the current situation, that rally is exhausted
and soon will go into retracement as we can see consolidation and divergence taking place in the 1H timeframe.
In the current situation, if we receive any bearish confirmation we will scalp retracement SHORT.
Happy trading.!
Best Regards,
The MorningStar Forex

GBPUSD retracement opportunity? Good morning 22.06.2021 > No major news announcements today and we are waiting for a support break. Looks like an opportunity SHORT for GBPUSD.
> If the movement stop is at 100% fibo level, the retracement to 61% will be at level 1.3880.
> To lower the risk of loss one should wait until the support break happens, that level is 1.3900.

Good morning 21.06.2021. Time to see that GBPUSD retracement?Looks like an opportunity LONG for GBPUSD.
> After a long drop of over 300 pips since FOMC, it is quite probable that the pair will finally retrace to 61% of the move.
When we see the break of the important resistance level 1.3831, then we will expect it to rise until 1.3890.
> 14 period RSI support the upward move.

NQ Power Range Report with FIB Ext - 6/21/2021 SessionContract - CME_MINI:NQU2021
- PR High: 14047.25
- PR Low: 14013.25
Evening Stats
- Gap: = N/A
- Session Open ATR: 199.42
- Volume: 33k
- Open Int: 216k
- Trend Grade: Retracement
- From ATH: -1.5% (Rounded)
Key Levels (Rounded - Think of these as a range)
- Long: 14676
- Mid: 14104
- Short: 12530
Keep in mind this is not speculation or a prediction. Only a report of the Power Range with Fib extensions for target hunting. Do your DD! You determine your risk tolerance. You are fully capable of making your own decisions.

euro usd buy short term all major pairs are extremely oversold or overbought because of DXY bull run euro usd is extremely over sold and broke a very strong support area
next demand zone is 1.180000 which is daily support oe demand zone and market gonna retest the broken support turned resistance
look for buy opportunity on lower time frame and enter long with your own money management
keep in mind that this entry is only short term
always remember that only key to success in this financial world is patience and discipline

Bullish Bat 30-50% Upside Potential if it plays out.If we can hold the 886 and especially not make a lower low then i expect us to see significant retrace upwards as Crypto continues to remain sideways within it's massive range.

$DXY and the Power of 0.886Welcome to our first educational post (rather than analysis).
Today we are taking a look at the overlooked 0.886 retracement. This measurement has been popularized by Scott Carney's Harmonic framework.
This measurement is a key aspect in the Shark Harmonic Pattern which we see above.
Along with the "0.886" which signifies an undershoot. We have the 1.13 which signifies of "overshoot" which we will go over in another post.
Adding this measurement to your retracement tool is very useful in identifying supply and demand zones. As we know, with high-frequency trading, traditional support and resistance is likely to be over or undershot.
These fibs help solve that problem.
Thanks for reading and I hope you all enjoy.
Portfolio Kings Team

mastering elliot waves. wave measurements in real time.When you are just learning something I think it is best not to perform it on a live chart right away. You will most likely still be grasping concepts and run a high risk of failure and frustration.
That being said, here are some basic applications of using Elliot wave measurements on something that's happening now. The 4 hour time frame is wide enough where you are capturing a majority of the forest, but still seeing details.
What's the plot today?:
The plot here is that there was a bullish monowave, a retracement of that monowave resulting in nondirectional movement, the nondirectional movement then stayed above important retracement levels and has now ended by breaking above important extension levels. If that is the same story you came up with then we are both on the same page, and with a little luck, doing something right.
You could say "what are you doing calling an impulse on a 4 hour time frame a monowave?" You'd be right, but calling it a poliwave doesn't lighten the cognitive load considering where price is currently so I'm sticking with monowave for simplicity's sake.

EUR/USD RetracementA strong bear trend, RSI 5 and 30 minutes Time Frames shows many times oversold.
No rebound. It broke through the last strong support.
This maybe the next can consider.

EURUSD - 1H - SCALPING/DIVERGENCE/RETRACEMENT - LONG
Analysis:
As per our previous analysis of EURUSD above, it hit both TP.
Now looking at the market, it's very hard to predict direction.
But for scalpers, we will advise looking for consolidation and divergence then only take Retracement long.
If you like clean analysis like this please follow for more.
Happy trading.!
Best Regards,
The MorningStar Forex

XAUUSD - 1H - RETRACEMENT ENTRY - SHORTAnalysis:
Gold made a massive downside move as we expected earlier,
Now we'll monitor the situation for a perfect trading setup.
There are two possibilities as per below. Please look out for setup.
If you like clean analysis like this please follow for more.
Happy trading.!
Best Regards,
The MorningStar Forex

Hello to GBPUSD retracement!17.06.2021After the FOMC Statement yesterday at 21:00 (GMT+3) the dollar appreciated heavily causing the heavy fall of the pair by over 130 pips. This short-term shock might have just created an opportunity for a retracement this morning to at least 61% of the move.
>> Usually moves start at 9:00 -10:00 when there is such an opportunity.
>> For the time being there is no strong indication for GBP to depreciate much or the dollar to appreciate more. breaking the day's support at 1.3970. However, the potential profit will be at least 25 pips.
