NAS100 Shock Retreat 23.02.2024It has been a crazy day yesterday 22nd Feb. All indices including the NAS100 surged after strong earnings reports that boosted confidence and a risk-on mood for the high-tech stocks such as Nvidia.
Is this the end of the upward and rapid movement? We use the Fibo retracement levels to find the 61.8% that the market potentially will retrace to, as indicated by the arrow, that level is near 17800 USD.
__________________________
Information Regarding Important News and Figures can be found here in our Economic Calendar: mau.bdswiss.com/economic-calenda...
Risk Warning: Trading in CFDs is highly speculative and carries a high level of risk. It is possible to lose all of your invested capital. These products may not be suitable for everyone, and you should ensure that you fully understand the risks taking into consideration your investment objectives, level of experience, personal circumstances as well as personal resources. Speculate only with funds that you can afford to lose. Seek independent advice if necessary. Please refer to our Risk Disclosure.
BDSwiss is a trading name of BDS Markets and BDS Ltd.
BDS Markets is a company incorporated under the laws of the Republic of Mauritius and is authorized and regulated by the Financial Services Commission of Mauritius ( FSC ) under license number C116016172, address: 6th Floor, Tower 1, Nexteracom Building 72201 Ebene.
BDS Ltd is authorized and regulated by the Financial Services Authority Seychelles (FSA) under license number SD047, address: Suite 3, Global Village, Jivan’s Complex, Mont Fleuri, Mahe, Seychelles. Payment transactions are managed by BDS Markets (Registration number: 143350).
Retracement

BNB THE CRYPTO PRINCE : HOW FAR AWAY $8.00 FEELS. SHORT SIGNALBeen watching this coin deliver the bidniz year after year since the ~$8.00 mark..
I've had good times trading..
In Kuala Lampur..
Bought the second wife there, yeah..
ENTRY: ~$380.00
TP: ~$265.00
Too bad if you're a Yank..
Daddy said you can't trade short, uh-uhuh...
Tsk-tsk.. )
// Follow its progression:
dub.sh

📈💰 A Day Trading Short setup Opportunity on HK50 💱🔥 Let's Dive into the Key Points! 🔥
Are you ready for an exciting day trading opportunity, Retracement on HK50? 🚀💹 Pay close attention to the following key points:
⬇️ Sell Limit Levels:
🎯 16732
🎯 16758
🎯 16785
📈 Take Profits:
TP1: 16680
TP2: 16648
🔑 Key Level - Resistance:
🛡️ 16710
❌ Stop Loss:
🛑 16785
💡 Trading Insights:
Today, we focus on HK50 and potential sell limit levels. Keep an eye on 16732, 16758, and 16785 as they present entry opportunities to capitalize on potential downward movements.
To secure profits, consider setting take profit levels at 16680 and 16648. These targets can help you lock in gains as the trade progresses.
Watch out for the key level of resistance at 16710, as it may act as a significant barrier to further upward movement.
Remember to manage your risk effectively by setting a stop loss at 16785. This will help protect your trading capital and limit potential losses.
Embrace the excitement of day trading and always stay vigilant in analyzing the market. Good luck! 💪💹📈
#HK50 #DayTradingOpportunity #SellLimit #TakeProfit #StopLoss 🌍💱

Nvidia - It Is Finally TimeHello Traders, welcome to today's analysis of Nvidia.
--------
Explanation of my video analysis:
In 2019 Nvidia stock started creating a long term rising channel and retested the lower support trendline the last time in 2022 before we saw a massive +600% rally on this stock. Nvidia is now retesting the upper channel resistance which I mentioned in the analysis and there is a quite high chance that we will see at least a short term correction towards the downside from here.
--------
I will only take a trade if all the rules of my strategy are satisfied.
Let me know in the comment section below if you have any questions.
Keep your long term vision.

BETS- another crypto penny stock resting over the weekend at the 0.5 fib retracement of a 100% 1-2 day move while Bitcoin trends
higher in weekend price action. Can the price action reverse out of the pullback and
retracement with bullish continuation? Relative strength has retreated but held at the 50 level.
Consistent with consolidation, the volume fell off for the close of the trading week. I will take
a long trade in this suspecting it will do well as did HUT and other cryptocurrency penny stocks.
I will set a 5% stop loss and target 25% or the middle of the zone of the topping wicks
on the pivot high of the previous trading day. So, this is a R:r of 5 trade plan. Safe and
conservative especially since I will only use 0.01% of buying power for the trade.

ORDI SHORT SIGNAL : FIRST REALLY BIG TRADE OF '24 I posted on ORDI a little while back.
It was a short from ~$74.00 down to $60.00. I missed the target by $1.50 because the coin was listed too recently and I had to guess the historic lows (starting point).
This post is in response to the expected BTC dump, and will likely be more aggressive and thus more profitable if successful. Keep in mind that it's predicated on condition that BTC does drop as expected. (Pfft.. Of course it will..)
I've indicated 3 different TP's depending on your particular level of tolerance and
greed, so have fun.

GODREJCP ready for upside againbreakout at 1085 retest done at 61% retracement level can resume upside
cmp 1131
sl 1045
target 1271
add more above 1145

BITCOIN : SHORT ENTRY FOR THIRD RETRACEMENT BEARISH RUN : SELLAs indicated in the title, this is the third installment in my experimental, purely for shirts and giggles, BTC predictions..
// Trade signal details at the bottom.
Find the previous two here:
Entry given: $46075
Target: $39288
Result: $38590
Signal Accuracy:
Predicted exit price: $39288
Actual bottom price: $38590
Actual difference: $698
// Percentage Difference = Predicted Exit Price/Actual Difference ×100
Percentage Difference = 39288/698 × 100 ≈ 1.776%
SIGNAL ACCURACY: 98.224%
Here's the post:
/ / / / / / / / / / / / / / / / / / / /
So here's the trade details:
Entry: $41868
Exit: $34350

US30 Is Ready To Retrace after Yesterday Midas SignalEntered Shorts at 385XX Levels Yesterday.
Aim TP1 at the middle moving average line.

NAS100 Reversal Correction 31.01.2024NAS100 has experienced an unusual drop yesterday having a different path than the other U.S. Indices as specific stocks had plunged amid the quarterly earnings reports.
This rapid drop and reversal from the upside creates an opportunity for retracement to occur.
The arrow shows how the price could start a path upwards, with the price returning back to the MA.
__________________________
Information Regarding Important News and Figures can be found here in our Economic Calendar: mau.bdswiss.com/economic-calenda...
Risk Warning: Trading in CFDs is highly speculative and carries a high level of risk. It is possible to lose all of your invested capital. These products may not be suitable for everyone, and you should ensure that you fully understand the risks taking into consideration your investment objectives, level of experience, personal circumstances as well as personal resources. Speculate only with funds that you can afford to lose. Seek independent advice if necessary. Please refer to our Risk Disclosure.
BDSwiss is a trading name of BDS Markets and BDS Ltd.
BDS Markets is a company incorporated under the laws of the Republic of Mauritius and is authorized and regulated by the Financial Services Commission of Mauritius ( FSC ) under license number C116016172, address: 6th Floor, Tower 1, Nexteracom Building 72201 Ebene.
BDS Ltd is authorized and regulated by the Financial Services Authority Seychelles (FSA) under license number SD047, address: Suite 3, Global Village, Jivan’s Complex, Mont Fleuri, Mahe, Seychelles. Payment transactions are managed by BDS Markets (Registration number: 143350).

S&P500 Retracement 30.01.2024U.S. Indices experienced a rapid movement upwards late yesterday.
Retracement today is happening, the question is if it is going to return to the 61.8 Fibo level as depicted by the arrow.
__________________________
Information Regarding Important News and Figures can be found here in our Economic Calendar: mau.bdswiss.com/economic-calenda...
Risk Warning: Trading in CFDs is highly speculative and carries a high level of risk. It is possible to lose all of your invested capital. These products may not be suitable for everyone, and you should ensure that you fully understand the risks taking into consideration your investment objectives, level of experience, personal circumstances as well as personal resources. Speculate only with funds that you can afford to lose. Seek independent advice if necessary. Please refer to our Risk Disclosure.
BDSwiss is a trading name of BDS Markets and BDS Ltd.
BDS Markets is a company incorporated under the laws of the Republic of Mauritius and is authorized and regulated by the Financial Services Commission of Mauritius ( FSC ) under license number C116016172, address: 6th Floor, Tower 1, Nexteracom Building 72201 Ebene.
BDS Ltd is authorized and regulated by the Financial Services Authority Seychelles (FSA) under license number SD047, address: Suite 3, Global Village, Jivan’s Complex, Mont Fleuri, Mahe, Seychelles. Payment transactions are managed by BDS Markets (Registration number: 143350).

ZRX : SHORT SELL SIGNAL : QUICKIE? IT CAN BE OUR LITTLE SECRET..Sell ZRX from ~$0.4010 down to $0.3300.
Go easy on the entry, as it might still finish with a flair at the tip, but this ol'slag is always ready to go South..
Have toys, can play..

SUI : SHORT SIGNAL : SCALP WHAT'S LEFT OF THIS GUY If this feels a little like deja vu, I feel you..
Apparently SUI doesn't know when to quit..
It's hardly got any remaining teeth and here we go again.. )
Seriously though.. This coin looks extremely bullish in spite of the fact that it's likely coming down some first..
The good news is that getting in at the bottom of whatever's about to happen will put you in a spectacular position from which you can relax and watch the bullrun unfold..
I expect SUI will be one of the first coins out of the starting blocks, rushing to um..
Yep.. I was about to say "The moon"..
Don't you judge me.. ))
Short target: $1.20 (Because we're not greedy)
Here's the previous signal given for SUI:
www.tradingview.com : SELL SIGNAL : SCALP THAT INJUN

incoming relief rally for BTC and then...I'm thinking that BTC gets a relief rally from the 100 day ema (yellow line) to $4400. After that we grind to to about $3200 for a healthy retracement to a historically significant level. The $3200 level is also a current confluence of a 50% retracement from that $4900 area and the trend line from the bottom. From there, I'll be expecting to get back into that upper channel.
DISCLAIMER: I do NOT offer financial advice. I am not a financial advisor. This content is poor speculation at best but I do it to learn and interact with the community (you all rock). YOU are responsible for your own investment decisions. I am responsible for neat colors and lines.

$NVDA COMPLETE ELLIOT WAVE ANALYSISI have identified all the wave counts visible on the weekly chart, and while they make sense to me, I acknowledge the possibility of errors, given my relatively new exposure to Elliott Wave analysis. It's evident that we are currently within wave B in the overarching wave count. Anticipating an elongated wave B due to various sub waves, my expectation is for wave B to reach the designated green pivot area before completing wave C well below the 2022 low.

AVAX: Thoughts and Analysis, potential low discussion.
Today's focus: AVAX
Pattern – 50% Fibbo, HL low analysis.
Support – 29.22
Resistance – 33
Hi, and thanks for checking out today's update.
Today, we are taking a look at AVAX (Avalanche) on the daily chart. Looking at price with a Fibonacci retracement tool on the chart, we can see that price lines up at the 50% point. This point also lines up with a previous high. We discuss the significance of the 50% Fib point and when price lines up with previous highs in today's update.
We have also run over what we are looking for to start calling a confirmed low and continuation. Signs are building, but buyers still have some work to do.
Good trading.

48k, heh? : BTCUSDT : NASTY RETRACEMENT : SHORT SIGNALWhoever made the call about 48k before tanking was pretty accurate.
Not exactly certain where it'll come down to, but I'm confident it'll get at least below 40k.
Come'on little BitCoin!

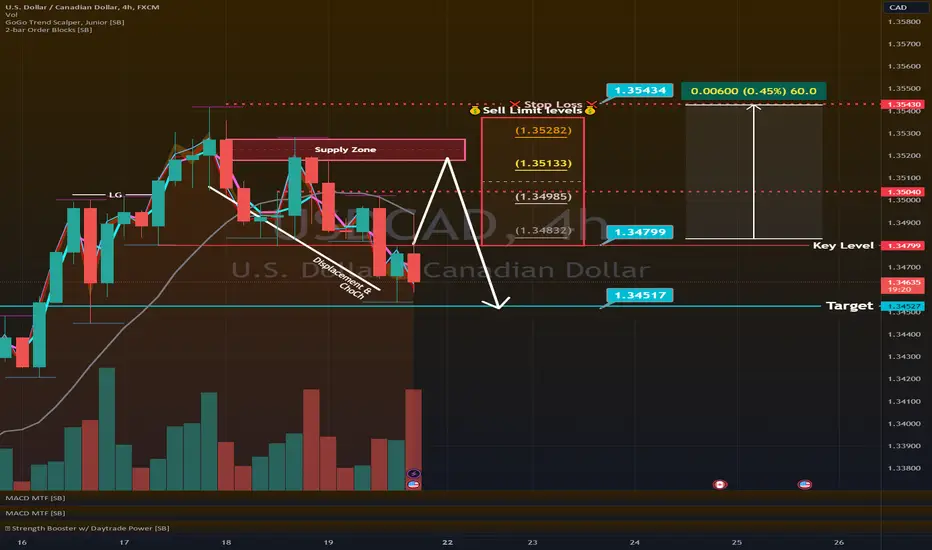
💹A trading opportunities - Short USDCAD retracementLook no further! Our analysis shows that USDCAD is currently in an uptrend in 4H or above timeframes. However, we’ve identified a potential opportunity for a short trade. Key Level 1.3480 has been broken, and we’re waiting for a retest on resistance levels (as marked as Sell limit levels on chart). If all goes well, we could see a touch on 1.3453 and gain some pips from this short trade. More take profit levels and the stop loss are marked on the chart too. 🤑🤑🤑
I hope this helps! Remember, trading is risky and always do your own research and analysis before making any trades. Good luck! 🤞
Crude Oil Reversal Opp 18.01.2024It looks like Crude oil experienced a sharp drop lately followed by a strong reversal.
This creates an opportunity for trading the retracement that will probably happen if the resistance proves to be strong enough.
__________________________
Information Regarding Important News and Figures can be found here in our Economic Calendar: mau.bdswiss.com/economic-calenda...
Risk Warning: Trading in CFDs is highly speculative and carries a high level of risk. It is possible to lose all of your invested capital. These products may not be suitable for everyone, and you should ensure that you fully understand the risks taking into consideration your investment objectives, level of experience, personal circumstances as well as personal resources. Speculate only with funds that you can afford to lose. Seek independent advice if necessary. Please refer to our Risk Disclosure.
BDSwiss is a trading name of BDS Markets and BDS Ltd.
BDS Markets is a company incorporated under the laws of the Republic of Mauritius and is authorized and regulated by the Financial Services Commission of Mauritius ( FSC ) under license number C116016172, address: 6th Floor, Tower 1, Nexteracom Building 72201 Ebene.
BDS Ltd is authorized and regulated by the Financial Services Authority Seychelles (FSA) under license number SD047, address: Suite 3, Global Village, Jivan’s Complex, Mont Fleuri, Mahe, Seychelles. Payment transactions are managed by BDS Markets (Registration number: 143350).

$COIN$ Slump till the latest $100supports are on the chart.
S1 is around $100-$102
S2 will be at the level of $88-$89
in the short term, you'd bet decrease the long if you hate to short your target
@Frankie
@Vickie

Price may retrace to $449.50Now that we have completed 3 waves up and a historic over 12% move up, I am looking for a retrace as recently buying failed to make new highs and the price sideways.
We have ES/MES futures roll over in 5 days so we should expect volatility. and a slow creep down to lower prices as a retrace. I still think the prices will make new highs into the last week of the New Year !
What do you think ??

price & Volume says SBI is retracing fastPrice now trapped under the RED TrapZone and UMVD also shows selling in the market. So TREND NOW is lower wait for green TrapZone and green UMVD to signal up moves
