USDJPY watching for long tradesLooking at jumping on a long trade if we keep rejecting that 114 area because we still are in bullish territory and we may see another upside rally, so huge potential for profit if can produce a nice entry... obviously move those stops to entry level as soon as 10 pips or so in profit.
Retracementlevels

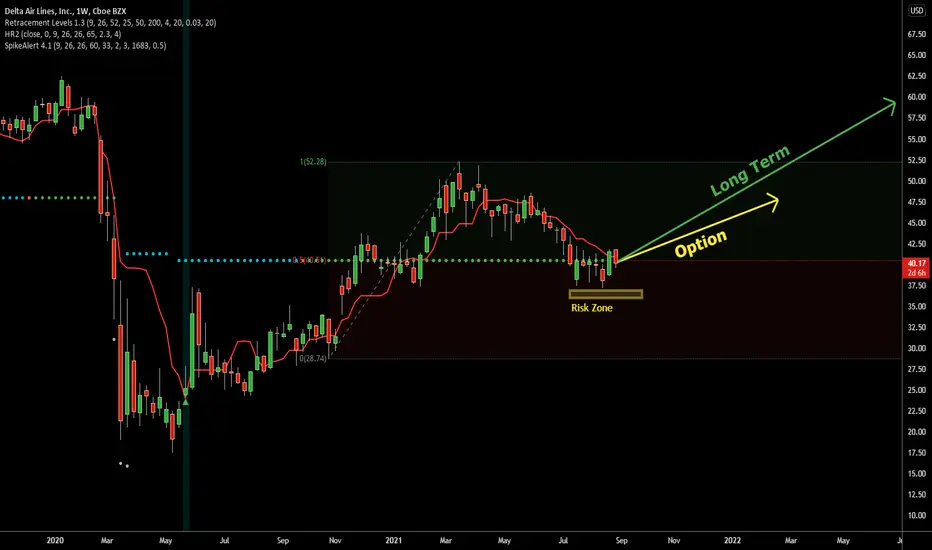
Looking for positive Delta on DALIn my livestream last Friday I talked about how I like the stock Delta NYSE:DAL . I like the company because any time I fly this company is going to be my choice. It's properly priced for its value compared to other airlines. Granted, there are unique risks that airlines face such as fuel costs and accidents but people will always need to travel from A to B.
I would not enter a trade without a technical setup and risk definition. The level DAL is holding represents both a long term Retracement from the 2020 crash and a short term Retracement from the Q4 2020 bull trend. The short term consolidation creates lows that must hold to remain a valid bullish trade.
I took both shares and options (Feb 2022 48 Calls) to express this trade.
POSSIBLE LONG Position on US30Currently I am seeing two possible scenarios. breakout of that smaller timeframe zone we heading to that first target(35290) comfortably. Retracement to the previous supply turned demand zone on the 1H timeframe we heading to the second target zone(35485). Ideally I would like for the bigger retracement just so that the market come and retests the previous broken zone, but as usual we react according to favorable price action only.
Good Luck.
God Bless!

My thoughts on EUR/USDIn my analysis of EUR/USD on the 4 hour chart, this currency pair is moving Bearishly, currently retracing to the next Higher Low to est. price $1.17847 at it's lowest point & 1.17937 at it's highest point, which should be between the 1.5 and 1.618 on the Fibonacci. The currency pair should reach the next Lower Low at price $1.16899. I used the Fibonacci and the Elliott wave in my analysis. OANDA:EURUSD

BTCUSD is near weekly resistance, breakout and 50K or dump ?As we can see the price now is near the last resistance left on the chart and can face some correction soon.
Notice: we were strongly bullish on bitcoin and the market for a while, but now it is time to look for a lower price to add more or to sell here and buy again at lower prices.
for sure the market is strongly bullish and it can easily continue too and long-term we are still bullish.
Targets and supports:
A. 37000$
B. 36000$
DISCLAIMER: ((trade based on your own decision ))
<>


What Happens in the Next Few Weeks?First off, check out my new VWAP script I wrote that allows you to use multiple VWAPS on multiple time frames at one time (used here with the black lines).
If we keep this momentum, we could see a slight dip to the 2.3 levels to re-test the VWAP as support. Using the Volume Profile, we can see that the Point of Control is around 3.2 which is the first major resistance we have to break through. 3.2 also happens to be the .618 Fib which plays nicely if you are a confluence trader.
Most likely, we will reject 3.2 and bounce in between the .618 and .5 levels for a bit and create another short term accumulation. Then we break 2021 highs and go straight to the moon.
Let me know your thoughts and any other types of analysis you guys are doing.

UPDATE Retracement Levels Script: Finding Support and ResistanceI have updated my Retracements Level script to alert traders to long term Support and Resistance levels based on 50% Fibonacci levels. I think that this is a simple and highly valuable tool that every trader should have in their toolbox to identify key levels that price may respect.
In this video I go over the many uses:
-Long term levels for Entering and Exiting positions
-Multiple Timeframe Analysis
-Catching Catalyst events like Earnings
-Projecting Support and Resistance far into the future

NQ Power Range Report with FIB Ext - 4/30/2021 SessionContract - CME_MINI:NQM2021
- PR High: 13952.00
- PR Low: 13925.50
Evening Stats
- Gap: = N/A
- Session Open ATR: 208.13
- Volume: 25k
- Open Int: 222k
- Trend Grade: Bullish
- From ATH: -1.5% (Rounded)
Key Levels (Rounded - Think of these as a range)
- Long: 14104
- Mid: 12530
- Short: 12598
Keep in mind this is not speculation or a prediction. Only a report of the Power Range with Fib extensions for target hunting. Do your DD! You determine your risk tolerance. You are fully capable of making your own decisions.

USDCHF Projections | Short on PullbackLooking to enter shorts on a pullback retesting a major broken ascending TL in confluence to the inner 0.618 fib retracement and previous area of support which is now key resistance. MA50 in respect to the structural breakout could indicate early signs of a momentum shift for next few trading days (despite the aggressive monthly close).
My sentiment on intra-day levels remains bearish. Hopefully the setup plays out and this isn't some sort of "fakeout".

$GRVY HITS KEY SUPPORT LEVELNASDAQ:GRVY Hits a key support level:
The support level is :
1) Related to a previous top
2) 0.786 Fibonnaci retracement
3) At the 89 period moving average
4) The trendline since October 2020
I am getting long at this level:
1) We have a stochastic hidden bullish divergence
2) The company is growing it's earnings per share
3) The general market is going up
4) It allows me to have a nice risk to reward ratio with a relatively tight stop-loss

interesting fibonacci levels for BTCIt seems to have stayed in the megaphone trading range that I set earlier.
The Fibonacci levels are interesting because it would suggest we'd hit roughly 40k then oscillate all the way up to 46k.
On the other hand, it is scary because the retracement level below where BTC is now is roughly 30k. This would go along with the theory that bitcoin will have a severe drop before it truly takes off to new highs.

SRPT holds Support a second timeAfter earnings NASDAQ:SRPT tanked HARD to what was a prior support at 126.53 where I had entered back in September. I watched this closely with a residual positions to see if it would hold it or break the level. I wanted to have some skin in the game for SRPT to retest the highs for the long term. So far today it looks to be holding that level as it has retraced a full 50% of the post-earning drop.
Marking this up for posterity as a collection of examples for the 50% retracement levels being a powerful signal of Support and Resistance.

The power of 50%As I keep mentioning the best Fibonacci level I've found is the simple 50% halfway point. BITFINEX:LTCUSD has demonstrated this beautifully as each impulse wave over the last many days has pulled back to hold its 50% level and continued upward.

BEAUTIFUL Support on CMII'm really proud of my trade and position on NYSE:CMI not just for the profit but the beauty of clear price structure which I wanted to share. This is clearly a BULLISH stock on a run but within it are some positive teachable moments. Multiple times it has held CLEAR price high/log inflections along with 50% retracement levels.
Trades like this are why I love trading... when things just come together in an almost artistic way!

SPY trade off the 50% retracement of the weekThis afternoon after 1pm in the "zombie hour" there was actually a great trade on AMEX:SPY . I missed it because I was at the gym when the signal came in but I wanted to make a video about it for my own posterity as to what makes a "GOOD TRADE!"
What made it a good trade is that the reversal signal occurred right at the 50% retracement of this week's big price action from the High of Monday's open to the Low of Tuesday's open. So far it seems as of today Wednesday we bounced off that level and established a smaller range which I'll be watching.
This is going to be compiled as an example of why I think looking for SIMPLE 50% retracement levels in price is one of the most powerful tools for finding Support/Resistance for profitable and high probability trade entries and exits.

XMRBTC lost the weekly support 🦐XMRBTC lost the weekly support after the price retest 0.382 fibonacci retracement.
IF the price will lose the current daily support and flip into resistance, According to Plancton's strategy, we can set a nice order
–––––
Follow the Shrimp 🦐
Keep in mind.
🟣 Purple structure -> Monthly structure.
🔴 Red structure -> Weekly structure.
🔵 Blue structure -> Daily structure.
🟡 Yellow structure -> 4h structure.
⚫️ Black structure -> <4h structure.
Here is the Plancton0618 technical analysis, please comment below if you have any question.
The ENTRY in the market will be taken only if the condition of the Plancton0618 strategy will trigger.

The obvious trade was NOT obvious on UVXYOn my last post about AMEX:UVXY I noted the distinct "trade of the week" theme. The idea that volatility would expand seemed to be obvious to everyone thus a trade on UVXY long seemed to be the play. Opportunity is rarely so obvious and that was why I suggested caution.
The Trump tweet of last week probably got a lot of folks in the trade excited to see profit and be validated but it was short lived. In fact, in only served to bring UVXY to a technical level; the 50% retracement of the range it has been in for the last few weeks.
Now things are not going well for the trade. I hate to see traders lose money but I hope they learn...

FETBTC - C&H Weekly + Forming C&H 4H - 40% TargetI'm bullish for reasons:
1. Weekly Cup & Handle
2. Weekly HK Doji signs of reversal
3. Price breaks the 0.5 RED resistance and hopefully will hold as support
4. Bullish Divergence already played out (inside vertical lines)
5. S&R Flip (resistance becomes support to hold the Handle in the Cup
Buy Area @ 0.382, 0.5, 0.618 RED Fib
Stop below 0.618 BLUE Fib
Targets @ 0.236, 0.382, 0.5, 0.618 RED FibEx


Levels I am looking at for possible move to the upside! GBPCADHere!
800 EMA below price
Good structure for Fibs
Support and resistance
I am waiting for a likely push down in the morning and then another good push to the upside! There is many ways for this to go sideways at the moment! I am also looking at divergence on this pair to see if I can capture a scalp!
I am also waiting upon what could be a bad day for £ as its already falling at -0.30%
Typical Pound!

The "OOPS Pattern"The “OOPS pattern” was developed by trader and author Larry Williams. It was named, according to Williams, for the all too common experience among traders when a broker would call his clients to report that a position was stopped out and say, “Oops, we lost.” This was due to the market gapping from one trading day to the next due to an overreaction from some sort of news or earnings announcement.
When there is this type of overreaction, there is a reasonable probability of a move back to satisfy the OOPS. The system is programmed to create more profits than losses. When the market opens lower than the previous day’s low, a trader can place a buy-stop order at the previous day’s low price. When the market opens higher than the previous day’s high, a sell-stop order can be placed at the previous day’s high.
Most traders recognize that gaps from one day’s close to the next day’s open occur for any number of reasons: news, rumor, earnings, etc. However, the move often exaggerates the impact of news. You see this all the time with earnings surprises. A big gap in the price (upward for positive surprises, downward for negative) is next offset with a move back to the previous trading level. This reversal is described as “ satisfying the OOPS pattern ”. Approximately 93% of the time, price will reverse to close the gap and satisfy the OOPS pattern.
For example, the chart for NASDAQ:AMZN demonstrates how earnings surprises can create an OOPS pattern, followed by retracement.
The circled sections reflect price behavior after earnings surprises. In end January, a positive report led to a large price gap moving about 180 points higher. The price also moved from trading at the lower Bollinger Band to moving above the upper Bollinger Band. It continued walking along the Bollinger Band resistance until moving lower and retracing back to satisfy the gap in price, the OOPS pattern.
The second example was just as dramatic, but less obvious. Upon a negative earnings report being published, price fell about 130 points. But it recovered quickly, recovering all of the lost ground in about two weeks.
The OOPS pattern is one form of retracement timing, allowing a swing trader to exploit market behavior. This also points to the maximum timing for leverage through opening of options trades. At such moments, single long calls or puts are likely to perform better than elsewhere on the chart. Short options may also be used as long as the price move is dramatic enough, and confirmed by other signals, to raise confidence as high as possible. To hedge risks, traders may also exploit the OOPS pattern with vertical spreads, synthetic stock positions, or collars.

GBP/CAD at 50% retracement level.GBP/CAD at retracement level.
Following a large drawdown of 160 pips, the GBP/CAD is at the 0.5 Fibonacci retracement level. Previous false breakouts have occurred on the 4th June and 8th June - price action tends to repeat itself so this breakout below the trend channel is likely to be false too. The hourly stochastic is giving an oversold signal, along with the %K line crossing above the %D line, leaving a high probability buy trade. Place a buy stop at 1.708 to confirm the trend, scaling in a position may also be a good choice.
WATCHOUT: both the United Kingdom's and Canada's CPI inflation reports are released this week (Wednesday). Predictions show that disinflation may occur in the UK (0.5% down from 0.8%), potentially leading to more contractionary monetary policy by the BofE. Meanwhile, although rated low-level Canada is predicted to recover from its deflationary period potentially pushing the GBP/CAD down.
