Market Direction using SPY historical trend patternsFrom a technical perspective, there hasn't been a definitive signal indicating a trend reversal for the SPY 500. Back in May to October 2023, the SPY exhibited a clear "M" pattern or double top, experiencing a drop of approximately 5%, retracing back, and then dropping around 10%, forming the M pattern.
If we compare this M pattern with the current price action, we observe a striking resemblance in the market behavior, as the price retraces from a similar percentage drop of around 5%. The question arises: Is the market genuinely recovering, or are we merely witnessing the formation of another M-shaped pattern!
Reversal

How Far Can USDJPY Go⁉️Hello TradingView Family / Fellow Traders. This is Richard, also known as theSignalyst.
📈 After breaking above the $127 resistance, USDJPY has been going up in a parabolic manner.
How high can USDJPY climb?
The marked blue circle represents a significant resistance and overbought zone as it marks the intersection of:
1- $160 round number and weekly high/
2- Upper blue trendline.
🏹 Thus, the highlighted blue circle denotes a robust area to anticipate a potential reversal.
And keep in mind: the bigger the impulse, the bigger the correction.
Therefore, when USDJPY begins to trade lower, be prepared!
📚 Always follow your trading plan regarding entry, risk management, and trade management.
Good luck!
All Strategies Are Good; If Managed Properly!
~Richard Nasr

GBP/USD Follow upA quick Follow-up on the GBP/USD Long Trade.
We have reversed the position at 1.2448 a test of the structure 2.
Technically, the trend is still down and a failure to trade above the structure 2 makes the GBP/USD still bearish.
The last Bullish wave 4 to 5 has given us a short setup using the Fibonacci. This is a high-probability setup for a strong reversal (short) or a downtrend continuation setup.
Initial Target 1.2347, If the price breaks below 1.2330, the downtrend will continue.
Stop Loss: 1.2473

BTC - Pre-Halving Scenarios 📈📉Hello TradingView Family / Fellow Traders,
Let's keep it simple!
BTC has been trading within a large range bounded by $60,000 support and $70,000 resistance.
Currently, BTC is hovering around the lower bound of the range at $60,000.
Scenarios:
1️⃣ Bullish
As long as the $60,000 support holds, we expect the bulls to take over and push the price towards the upper bound of the orange channel. (to be confirmed on lower timeframes)
2️⃣ Bearish
If the $60,000 support is broken downward, we expect a bearish movement towards the $50,000 demand zone.
📚 Always follow your trading plan regarding entry, risk management, and trade management.
Good luck!
All Strategies Are Good; If Managed Properly!
~Richard Nasr

DXY - Are You Ready?Hello TradingView Family / Fellow Traders. This is Richard, also known as theSignalyst.
📈 DXY has been overall bullish , trading within the rising channel in red.
Currently, DXY is approaching the upper bound of the channel acting as a non-horizontal resistance.
Moreover, it is retesting a strong resistance zone marked in green.
🏹 Thus, the highlighted red circle is a strong area to look for sell setups as it is the intersection of the upper red trendline and green resistance.
📚 As per my trading style:
As #DXY approaches the red circle zone, I will be looking for bearish reversal setups (like a double top pattern, trendline break , and so on...)
📚 Always follow your trading plan regarding entry, risk management, and trade management.
Good luck!
All Strategies Are Good; If Managed Properly!
~Rich

NZDJPY - Wait For The Bears!Hello TradingView Family / Fellow Traders. This is Richard, also known as theSignalyst.
📈 NZDJPY has been overall bearish, trading within the falling channel in red.
Currently, NZDJPY is approaching the upper bound of the channel acting as a non-horizontal resistance.
Moreover, it is retesting a demand zone marked in green.
🏹 Thus, the highlighted red circle is a strong area to look for sell setups as it is the intersection of the upper red trendline and green demand zone.
📚 As per my trading style:
As #NZDJPY approaches the red circle zone, I will be looking for bearish reversal setups (like a double top pattern, trendline break , and so on...)
📚 Always follow your trading plan regarding entry, risk management, and trade management.
Good luck!
All Strategies Are Good; If Managed Properly!
~Rich

BTC - Roadmap to 80k 🗺Hello TradingView Family / Fellow Traders,
For those who know me, it's clear I always like studying previous price action.
"Know yourself, know your enemy. Many battles, many victories."
~ Sun Tzu
I find the Bitcoin Daily Chart interesting.
If we compare this impulse movement to the previous two, we can see that after 58 days, the correction starts, and it actually did as per my last BTC cycles analysis.
What's next?
As long as the $60,000 support holds, we are now expecting the start of the next impulse movement.
According to the previous bullish impulse, we expect this upcoming impulse to reach the $80,000 mark.
What do you think?
📚 Always follow your trading plan regarding entry, risk management, and trade management.
Good luck!
All Strategies Are Good; If Managed Properly!
~Richard Nasr

Divergence into a Reversal?? - AUHere I have AUD/USD on the 1Hr Chart!
Our two current Lows @ ( .9498 ) on Wed. April 10th and ( .9456 ) on Fri. April 12th show an interesting underlying story when it comes to our indicators!
1) Looking to the RSI and comparing the Lows to Price on the chart, we can see that the RSI is showing a STRONG Divergence meaning Price could potentially be looking to move up now!
2) Our Momentum & Volatility indicators are showing Consolidation or Sideways movement meaning there is really no more trend left to be found.
Now this Divergence leads me to believe that if Price works back up to the CONFIRMATION of PATTERN @ .6545, we could see the VALIDATION of this PATTERN and look for trading opportunities!
CONFIRMATION of PATTERN @ .6545
INVALIDATION of PATTERN @ .6456

Bitcoin - Old Fibonacci level suggest $59k is in viewLet's talk about the elephant in the crypto village square: Bitcoin. Now that we're looking at a correction, it makes sense to talk about where that may end and - for those of you that successfully took some profits - when and where you may want to re-deploy those funds.
I am of the view that Fibonaci levels - particularly old ones - are extremely helpful for predicting turning points when it comes to BTC. Small quick pullbacks may not involve recognising significant Fibs and can occur randomly or involve pivot levels (not shown). (I rarely trade those because I have a F/T job and do not have time to trade daily and also I find that trading smaller insignificant levels can be really frustrating and result in missing large runs...) However, when pullbacks stretch into weeks (current situation), then significant Fibs start coming into play.
I'll explain below where the blue and white fibs depicted in this image come from, but the blue Fib depicted here at ~US$59,600 is the 48 Fib of the original run and was initially ignored as the price stormed through it, but is now working like a magnet for BTC price and my view is that the correction will not end until this Fib is properly recognised. A proper recognition of this Fib may involve a spike down over a few hours (possibly a day) but then a weekly (or daily) close on or very close to the Fib line.
These old Fibs have been influential in shaping the price history of BTC to date, as can be seen from the linked images below. The thick dotted blue lines are the extension Fibs from the first long run of BTC between 2009 and Nov 2013 (first link below). The thin dotted white lines are the 'extension' fibs drawn from the 2014 crash in price.
The blue fibs have been massively influential and have accurately predicted most peaks and troughs (second link below). I think it's at least LIKELY that Bitcoin will not find a way forward before it has planted itself squarely on this 48 Fib over the coming week(s). Happy trading!

TIA - Shift In Momentum In Action 📉📈Hello TradingView Family / Fellow Traders. This is Richard, also known as theSignalyst.
📉 TIA has been overall bearish , trading within the falling wedge pattern in red.
However, it is currently approaching a strong support zone and round number $10.0.
As long as the support holds, we will be looking for buy setups.
🏹 For the bulls to take over, a break above the last major high at $13 is needed.
In this case, a movement till the $20 round number would be expected.
📚 Always follow your trading plan regarding entry, risk management, and trade management.
Good luck!
All Strategies Are Good; If Managed Properly!
~Rich

EURNZD - Follow The Flow 🌊Hello TradingView Family / Fellow Traders. This is Richard, also known as theSignalyst.
📈 EURNZD has been overall bearish, trading within the falling channel in red.
Currently, EURNZD is approaching the upper bound of the channel acting as a non-horizontal resistance.
Moreover, it is retesting the upper bound of the short-term channel in blue.
🏹 Thus, the highlighted red circle is a strong area to look for sell setups as it is the intersection of the red and blue trendlines.
📚 As per my trading style:
As #EURNZD approaches the red circle zone, I will be looking for bearish reversal setups (like a double top pattern, trendline break , and so on...)
📚 Always follow your trading plan regarding entry, risk management, and trade management.
Good luck!
All Strategies Are Good; If Managed Properly!
~Rich

AUDJPY - Are You Ready⁉️Hello TradingView Family / Fellow Traders. This is Richard, also known as theSignalyst.
📈 AUDJPY has been overall bullish, trading within the rising wedge pattern in blue.
Currently, AUDJPY is in a correction phase, approaching the lower bound of the wedge.
Moreover , it is retesting a strong demand in green.
🏹 Thus, the highlighted blue circle is a strong area to look for buy setups as it is the intersection of the green demand and lower blue trendline.
📚 As per my trading style:
As #AUDJPY approaches the blue circle zone, I will be looking for bullish reversal setups (like a double bottom pattern, trendline break , and so on...)
📚 Always follow your trading plan regarding entry, risk management, and trade management.
Good luck!
All Strategies Are Good; If Managed Properly!
~Rich

NZDUSD - Wait For It ⏱Hello TradingView Family / Fellow Traders. This is Richard, also known as theSignalyst.
📈 NZDUSD has been overall bearish , trading within the falling wedge pattern in blue.
Currently, NZDUSD is in a correction phase, approaching the lower bound of the wedge.
Moreover, it is retesting a strong demand in green.
🏹 Thus, the highlighted blue circle is a strong area to look for buy setups as it is the intersection of the green demand and lower blue trendline.
📚 As per my trading style:
As #NZDUSD approaches the blue circle zone, I will be looking for bullish reversal setups (like a double bottom pattern, trendline break , and so on...)
📚 Always follow your trading plan regarding entry, risk management, and trade management.
Good luck!
All Strategies Are Good; If Managed Properly!
~Rich

NZDCHF - Already Over-Bought ↘️Hello TradingView Family / Fellow Traders. This is Richard, also known as theSignalyst.
📈 NZDCHF has been overall bullish , trading within the rising channel in blue.
However, it is currently approaching the upper bound of the channel again acting as a non-horizontal resistance.
Moreover, it is retesting a strong resistance zone at 0.55 - 0.552 marked in green.
🏹 Thus, the highlighted blue circle is a strong area to look for sell setups as it is the intersection of the green resistance and upper blue trendline.
📚 As per my trading style:
As #NZDCHF approaches the blue circle zone, I will be looking for bearish reversal setups (like a double top pattern, trendline break , and so on...)
📚 Always follow your trading plan regarding entry, risk management, and trade management.
Good luck!
All Strategies Are Good; If Managed Properly!
~Rich

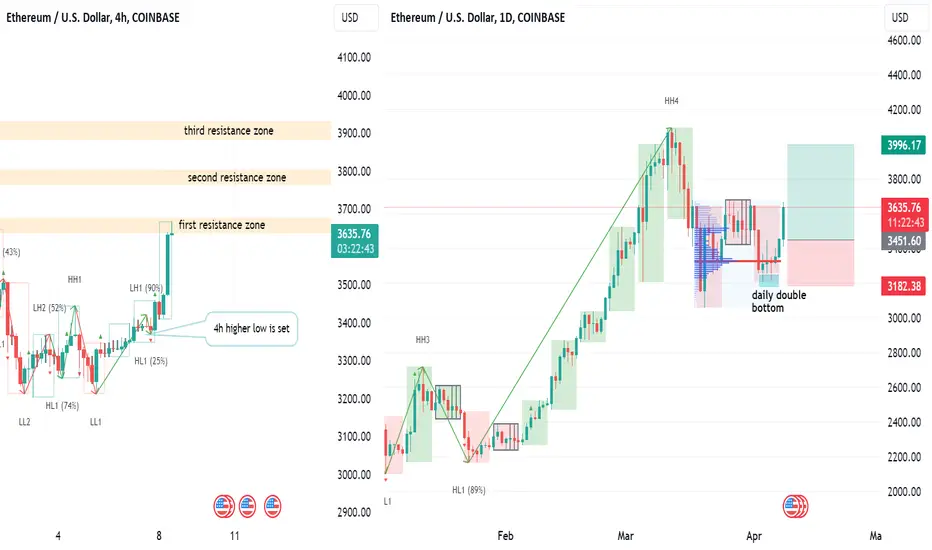
ETH is shaping weekly higher lowEthereum is trying to set weekly higher low (we're still in a weekly uptrend, setting weekly higher low is strong signal of trend continuation).
It failed one time (last week of March) but now it has better chance of accomplishing it. While it opens opportunity for a LONG play we should recognize that there was quite aggressive selling in the middle of March. Bears might be still waiting at certain levels (marked on the chart). So, entering trade at this moment doesn't provide good P/L ratio. It would be better to wait for some sort of retest (e.g. lower value area, near current week low) to enter. Consider partial profit taking at resistance zones.
Example of the trade is shown on the chart.
Disclaimer
I don't give trading or investing advice, just sharing my thoughts.
BTC - Follow The Flow 🌊Hello TradingView Family / Fellow Traders. This is Richard, also known as theSignalyst.
📈 BTC has been overall bullish , trading within the rising channel in orange.
Currently, BTC is in a correction phase, approaching the lower bound of the channel.
Moreover, the highlighted red zone is a strong demand.
🏹 Thus, the highlighted blue circle is a strong area to look for buy setups as it is the intersection of the red demand zone and lower orange trendline.
📚 As per my trading style:
As #BTC approaches the blue circle zone, I will be looking for bullish reversal setups (like a double bottom pattern, trendline break , and so on...)
📚 Always follow your trading plan regarding entry, risk management, and trade management.
Good luck!
All Strategies Are Good; If Managed Properly!
~Rich

USDCAD - Already Over-Bought! Again...Hello TradingView Family / Fellow Traders. This is Richard, also known as theSignalyst.
📈 USDCAD has been overall bullish , trading within the rising flat channel in blue.
However , USDCAD is approaching the upper bound of the channel again acting as a non-horizontal resistance.
Moreover, it is retesting a strong resistance zone at 1.362 - 1.365 marked in green.
🏹 Thus, the highlighted blue circle is a strong area to look for sell setups as it is the intersection of the green resistance and upper blue trendline.
📚 As per my trading style:
As #USDCAD is around the blue circle zone, I will be looking for bearish reversal setups (like a double top pattern, trendline break , and so on...)
📚 Always follow your trading plan regarding entry, risk management, and trade management.
Good luck!
All Strategies Are Good; If Managed Properly!
~Rich

MPC - Bulls Already In Control 📈Hello TradingView Family / Fellow Traders. This is Richard, also known as theSignalyst.
📈 According to our latest analysis, M PC rejected the $0.3 round number and subsequently broke above the last major high in red. Therefore, the bulls have already taken over.
📉 MPC is currently in a correction phase, retesting the red structure.
🎯 For the bulls to regain control and initiate the next upward impulse movement, leading to a continuation towards the $0.525 resistance, a break above the last minor high in orange at $0.42 is required.
📚 Always follow your trading plan regarding entry, risk management, and trade management.
Good luck!
All Strategies Are Good; If Managed Properly!
~Rich

CADCHF - Keep It Simple🍰Hello TradingView Family / Fellow Traders. This is Richard, also known as theSignalyst.
📉 From a long-term perspective , CADCHF has been overall bearish, trading within the falling channel in red.
📈 From a medium-term perspective, CADCHF is in a correction phase trading within the rising wedge pattern in blue.
🏹 The highlighted red circle is a strong area to look for sell setups as it is the intersection of the upper red and blue trendlines.
📚 As per my trading style:
As #CADCHF is around the blue circle zone, I will be looking for bearish reversal setups (like a double top pattern, trendline break , and so on...)
📚 Always follow your trading plan regarding entry, risk management, and trade management.
Good luck!
All Strategies Are Good; If Managed Properly!
~Rich

ETH - Wait For The Bears, then The Bulls📉📈Hello TradingView Family / Fellow Traders. This is Richard, also known as theSignalyst.
📈 ETH has been hovering with a range between $3000 and $3500.
📉 After breaking below the last major low at $3500, ETH has been bearish from a short-term perspective trading within the falling red channel.
Moreover, the $3000 - $3100 is a strong support zone.
🏹 Thus, the highlighted red circle is a strong area to look for buy setups as it is the intersection of the green support and lower red trendline.
📚 As per my trading style:
As #ETH approaches the red circle zone, I will be looking for bullish reversal setups (like a double bottom pattern, trendline break , and so on...)
📚 Always follow your trading plan regarding entry, risk management, and trade management.
Good luck!
All Strategies Are Good; If Managed Properly!
~Rich

#techmahindra trendline breakFirst things keep yo mind tech sector is pretty weak. Structure of stock is pretty good after reversing from supp line broked falling trend line. If sustain than it can give good return but keep first thing in yo mind above mentioned. Sector is weak it can impact stock too in simple it risky setup.it for education purpose only. am will not responsible for your any lose.

Inverse Head Shoulders | Long Bias1h TF
Seem Inverse Head Shoulders being happened, just wait for confirmation after break the neckline at 2.77
Wait...

Bulls vs BearsRetracement from day high, reversal on fib, target day high.
We can see frequent buy sell on the same level at 165, amazing war between bulls and bears, let's see where it goes
Follow the Ethics : Do your own research!!
