EURJPY - Still Over-Bought!Hello TradingView Family / Fellow Traders. This is Richard, also known as theSignalyst.
📈EURJPY has been overall bullish trading within the rising channel marked in blue. However, it is currently retesting the upper bound of the channel.
Moreover, the green zone is a major weekly supply.
🏹 Thus, the highlighted red circle is a strong area to look for sell setups as it is the intersection of the upper blue trendline and weekly supply.
📚 As per my trading style:
As #EURJPY approaches the red circle zone, I will be looking for bearish reversal setups (like a double top pattern, trendline break , and so on...)
📚 Always follow your trading plan regarding entry, risk management, and trade management.
Good luck!
All Strategies Are Good; If Managed Properly!
~Richard Nasr
Disclosure: I am part of Trade Nation's Influencer program and receive a monthly fee for using their TradingView charts in my analysis.
Reversal

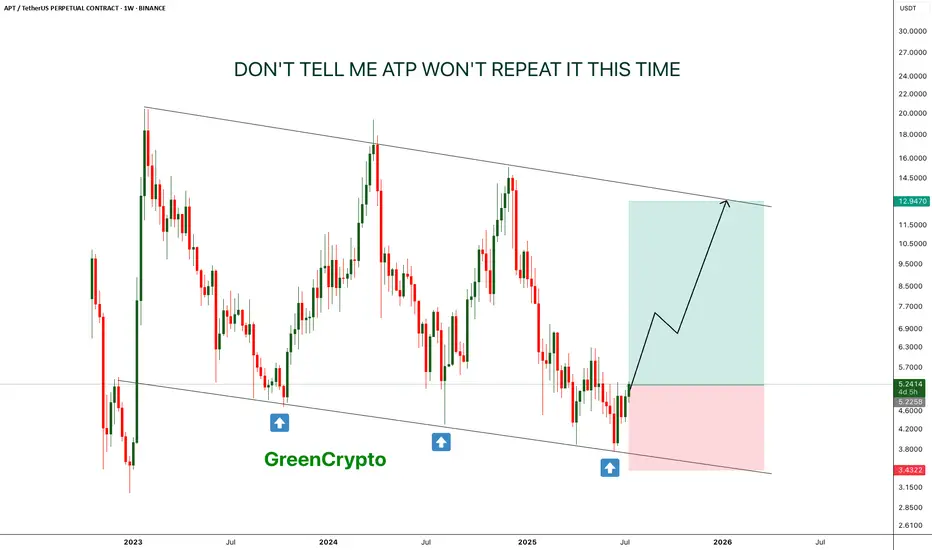
APT - Don't tell me this pattern won't repeat- This time is the charm, APT is is reversing from lower low on weekly chart.
- just like last two time, it is expect to forma new HL.
- there is a high chance that previous two patterns will repeat again
Entry Price: 5.22
Stop Loss: 3.4
TP1: 6.6632
TP2: 8.5059
TP3: 12.6945
Max Leverage: 5x
Don't forget to keep stoploss
Cheers
GreenCrypto
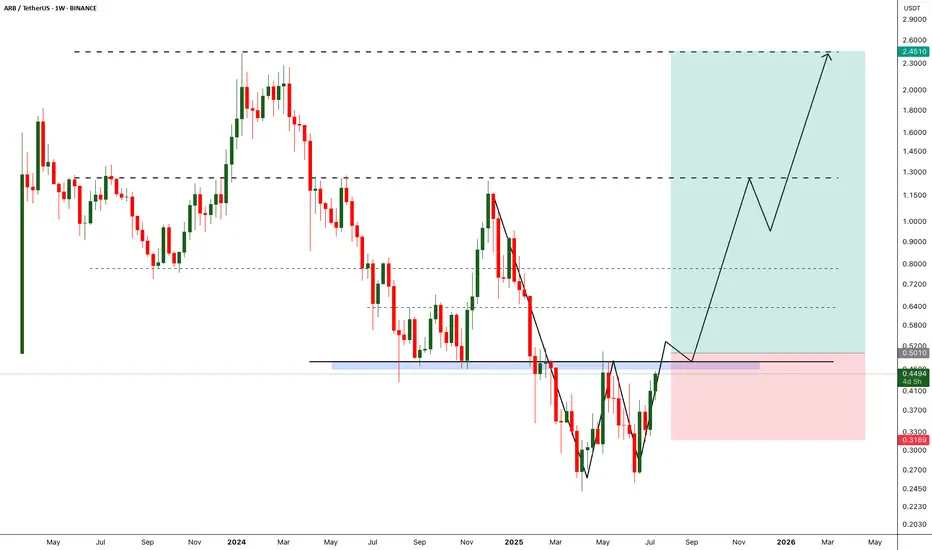
ARB - Breakout will break the market- Arbitrum is one of the fundamentally strong token on ETH L2.
- After back to back crashes finally we are seeing some reversal from the bottom
- A breakout from the local resistance would push the arb price further, we need to wait till the breakout to enter the trade.
Entry Price: 0.5010 (after breakout)
StopLoss: 0.3169
TP1: 0.6300
TP2: 0.7698
TP3: 1.2297
TP4: 1.7566
TP5: 2.3943
Max Leverage: 5x
Don't forget to keep stoploss
Cheers
GreenCrypto
Gold is Setting up for another moveLooking for price to make some impulsive moves before we get active. Looking like they are trying to establish a low for the week before they go full on bullish. waiting for them to find that bottom.

WALUSDT - Change in the trend and let's capture itWAL is currently showing a change in the trend, after a continous downtrend finally we are seeing change in the trend.
Price has held the support strongly and now we are seeing the reversal.
We have decent trade opportunity here.
Entry Price: 0.4319
StopLoss: 0.3500
TP1: 0.4828
TP2: 0.5292
TP3: 0.6374
TP4: 0.7817
Cheers
GreenCrypto

EUR/CAD: Quant-Verified ReversalThe fundamental catalyst has been triggered. The anticipated strong Canadian CPI data was released as expected, confirming the primary driver for this trade thesis. Now, the focus shifts to the technical structure, where price is showing clear exhaustion at a generational resistance wall. 🧱
Our core thesis is that the confirmed fundamental strength of the CAD will now fuel the technically-indicated bearish reversal from this critical price ceiling.
The Data-Driven Case 📊
This trade is supported by a confluence of technical, fundamental, and quantitative data points.
Primary Technical Structure: The pair is being aggressively rejected from a multi-year resistance zone (1.6000 - 1.6100). This price action is supported by a clear bearish divergence on the 4H chart's Relative Strength Index (RSI), a classic signal that indicates buying momentum is fading despite higher prices.
Internal Momentum Models: Our internal trend and momentum models have flagged a definitive bearish shift. Specifically, the MACD indicator has crossed below its signal line into negative territory, confirming that short-term momentum is now bearish. This is layered with a crossover in our moving average module, where the short-term SMA has fallen below the long-term SMA, indicating the prevailing trend structure is now downward.
Quantitative Probability & Volatility Analysis: To quantify the potential outcome of this setup, we ran a Monte Carlo simulation projecting several thousand potential price paths. The simulation returned a 79.13% probability of the trade reaching our Take Profit target before hitting the Stop Loss. Furthermore, our GARCH volatility model forecasts that the expected price fluctuations are well-contained within our defined risk parameters, reinforcing the asymmetric risk-reward profile of this trade.
The Execution Plan ✅
Based on the synthesis of all data, here is the actionable trade plan:
📉 Trade: Sell (Short) EUR/CAD
👉 Entry: 1.6030
⛔️ Stop Loss: 1.6125
🎯 Take Profit: 1.5850
The data has spoken, and the setup is active. Trade with discipline.

AUDJPY Ready To "Drop A Shoulder"? Multi-Timeframe May Help!OANDA:AUDJPY is beginning to form a very convincingly strong Reversal Pattern, the Head & Shoulders!
Starting with the Daily Chart we can see that Price is Forming a Doji Candle just after trying to Breakout of a Major Resistance Zone created from the Highs of March 18th and if Price is unable to close above this level, this strengthens the Bearish and Reversal Bias.
Now the 4 Hr Chart shows both the "First Shoulder" or Previous Higher High that was surpassed by the "Head" which is the New Higher High, has formed quite quickly with a slightly Ascending "Neckline" or Support Line where Bulls were able to make their Last Stand.
With a Reversal Pattern, you want to see a Change in Trend, in this case, would be a Lower High then that of the Higher High or "Head" @ 96.204.
*If Bulls are able to Push Price above the "Left Shoulder" or Previous Higher High @ 95.952, this will Invalidate the Head & Shoulders Set-up!
**If Bulls are unable to Break Above 95.952 and Price is pushed back down to the Confirmation or "Neckline" for a 3rd time, this Confirms the Head & Shoulders Set-up!!
Based on the Distance between the Head and Neckline, we can project a potential drop down to the next Support Level as a Price Target @ 95.00 once:
1) Pattern is Confirmed
2) Breakout is Validated

NZDJPY - bulls are exhausted! Hello TradingView Family / Fellow Traders. This is Richard, also known as theSignalyst.
📈NZDJPY has been overall bullish trading within the rising flat channel marked in blue and it is currently retesting the upper bound of it.
Moreover, the green zone is a strong structure.
🏹 Thus, the highlighted red circle is a strong area to look for sell setups as it is the intersection of the upper blue trendline and green structure.
📚 As per my trading style:
As #NZDJPY is hovering around the red circle zone, I will be looking for bearish reversal setups (like a double top pattern, trendline break , and so on...)
📚 Always follow your trading plan regarding entry, risk management, and trade management.
Good luck!
All Strategies Are Good; If Managed Properly!
~Rich
Disclosure: I am part of Trade Nation's Influencer program and receive a monthly fee for using their TradingView charts in my analysis.

BTC monthly yelling at us for something interesting ?We read daily news about ETF, accumulation by institutes and scarcity in the exchanges, but I recognize something different in the chart based on multiple indicators. Historically, BTC boomed after touching 50 EMA and whenever it is extended it traces back to 50 EMA on monthly chart. As per current data, BTC is extended far from it. Also RSI and MACD indicating that it is losing momentum with -ve divergence. Volume as well descreasing since last leg, though price moved up. So, I expect price to retrace to 50 EMA which coincides with previous high at 60K. Let us see how it unfolds.

Bandhan Bank - first major trend reversal! Upside to ₹215–230Thesis:
Bandhan Bank has broken out above the ₹185 zone after constructing a multi-month rounded base between ₹130 and ₹185. This marks the first major structural reversal after a multi-year downtrend. The breakout is backed by above-average volume and positive momentum.
Technical Structure:
Breakout Level: ₹180
Current Price: ₹189.64
Volume Surge: 11.4M (above 20-day average)
RSI (14): 67.5 — trending strong, near breakout zone
Targets:
₹215 ( 13.8% upside ) — measured move of near-term range
₹259 ( 25% upside ) — major horizontal resistance from 2022
Disclaimer:
Not a recommendation. For educational use only. Position already held from earlier. This post reflects personal strategy execution in a structured portfolio.

Will Gold Break out for the New Month this week?I was anticipating these possible sweeps. with it being the end of the month I'm thinking I might need to do more watching for now than positioning. waiting for the market to show its hand on what it wants to do next.

Reverse Head & Shoulders Setup | Gold Spot | 15min | by Mohsen M
🔸 **Chart:** Gold Spot / USD (XAU/USD)
🔸 **Timeframe:** 15min
🔸 **Method:** Smart Money Concepts (SMC) + Pattern Recognition
🔸 **Focus:** Reverse H&S, Order Blocks, TLQ, BOS
---
## 🔍 Market Context:
- **Market Structure:** Bearish on higher TF
- **Short-Term Trend:** MSU (Market Structure Up)
- **Efficiency:** ✅ Confirmed — clean price delivery
- **Key Pattern:** Bullish **Inverse Head & Shoulders**
---
## 🧠 Technical Breakdown:
1. **Left Shoulder – Head – Right Shoulder** perfectly forming within a high-value demand zone
2. Price reacted strongly from **Order Block (OB)** + TLQ marked at the bottom wick (Head zone)
3. BOS confirms bullish attempt to shift structure
4. Anticipating neckline break at ~3345 level for further upside
5. Potential resistance and liquidity resting above 3400 (HH region)
---
## 📌 Trading Plan (Pre-London Open / Monday 1:30 AM UTC+3:30):
- **Entry Idea:**
Watch for bullish confirmation after price stabilizes above Right Shoulder zone (~3300–3320)
Or re-entry on a retest of neckline after breakout
- **Stop Loss:**
Below "Head" and OB zone (~3260)
- **Take Profits:**
- TP1: Neckline break zone (~3345)
- TP2: 3400 – Liquidity pool
- TP3: Final HH sweep (~3420+)
---
## ⚠️ Alternate Bearish Case:
> If price breaks below the "Head" zone and OB fails to hold,
> → Expect bearish continuation to the next liquidity zone near **VTA @ 3200**
---
## ✅ Summary:
This is a clean **bullish reversal setup** using SMC logic and a classic H&S pattern:
**OB + TLQ + BOS + Efficient Market + Clear Pattern ➝ High-Probability Setup**
Structure: 🟥 Bearish (macro)
Trend: 🔼 MSU (micro)
Efficiency: ✅ Efficient
Pattern: 🟩 Inverse Head & Shoulders
---
📊 Prepared by: **Mohsen Mozafari Nejad**

US30 looking for the short on Bearish PAI believe we can expect a pull back down to JuBias: Short-term Bearish (Contingent Setup)
Context: Price is currently trading just below a high-probability supply zone between 44,048 – 44,277. This area aligns with prior highs and liquidity, making it a prime zone to look for a short-term rejection if strong bearish price action (PA) appears on the 4H or Daily timeframes.
We are currently seeing strong bullish momentum on the Weekly, Daily, and H4 candles. Any short positions from this zone must be reactive — not anticipatory. A clear bearish signal (e.g., engulfing, structure break, supply confirmation) is required to consider entry.
Key Zone:
Seek bearish PA between 44,048 – 44,277
Contingency: If price breaks and closes above 44,250 (2024 highs), expect continuation toward 45,000
Short Targets if Rejection Occurs:
Target 1: 43,350
Target 2: 42,500
Extended Target: 41,734 (June Low)
Post-Rejection Bullish Scenario:
If we do get a rejection and targets are met, we will then look for bullish PA in the demand zones (42,500 or 41,700) to consider long setups back toward the 2024 highs and potentially beyond.
Breakout Scenario:
If price breaks and closes above the 44,277 zone early this week, we anticipate the next leg to 45,000 before any meaningful reversal.
At this stage, it’s a waiting game — let price action lead. We don’t predict, we react.ne lows before an

EURGBP - Bullish No More!Hello TradingView Family / Fellow Traders. This is Richard, also known as theSignalyst.
📈 EURGBP has been overall bullish trading within the rising channel marked in blue. And it is currently retesting the upper bound of the channel.
Moreover, the orange zone is a strong weekly resistance.
🏹 Thus, the highlighted red circle is a strong area to look for sell setups as it is the intersection of the upper blue trendline and resistance.
📚 As per my trading style:
As #EURGBP is around the red circle zone, I will be looking for bearish reversal setups (like a double top pattern, trendline break , and so on...)
📚 Always follow your trading plan regarding entry, risk management, and trade management.
Good luck!
All Strategies Are Good; If Managed Properly!
~Rich
Disclosure: I am part of Trade Nation's Influencer program and receive a monthly fee for using their TradingView charts in my analysis.

Have we made a Low for the Week yet on Gold???Im looking for price to sweep Monday's low before deciding what it wants to do. I want to see everything line up inside of the killzone to take advantage. Just have to be patient. We still have a lil time so sitting on my hands until it all looks clear to proceed with the move.

Holiday yesterday so no play! can we get it today?As we get ready to close out the week we are looking for the reversal to play out. We have been in a casual consolidation all week. Just looking for price to step outside of value one more time so that we can get a entry for it to continue pushing bullish.

The Nature of Zones — Reversals, Continuations, and the FlowWe’ve all heard trading terms like Major Trend and Major Counter-Trend levels. These are zones where price either breaks through and continues (Trend Levels) or sharply reverses (Counter-Trend Levels). In the crypto world, these levels are often separated by enormous gaps, due to the nature of the space — as I’ve mentioned in a previous idea: Crypto Charts Whisper—Are You Listening?
Let’s get one thing clear from the start. These levels are not just thin lines that traders casually draw across a chart. They are zones. So, as a skilled trader, anytime someone mentions support or resistance, keep in mind: interact with these as zones, not levels.
Why? The answer lies in the nature of the candlestick itself. Most support and resistance areas — 99% of the time — are defined by candlesticks such as inverted hammers, shooting stars, etc. For instance, in an uptrend near its peak, you’ll often spot an inverted hammer with a rejection wick that’s at least 25–50% of the candle’s body. The longer the wick, the stronger the rejection. In that sense, the high and the close of that candle form the zone. And what better tool to use for this than the rectangle?
Now, to slowly return to our main point — many of you might’ve noticed that zones often change their nature, especially resistance zones. If you’re experienced, you already know: price tends to go higher by nature. So when a counter-trend zone gets broken and price pushes above it, it shifts — it becomes a trend zone. Later, if price retests it from above, it often turns into support, and with another reversal, it can shift again — becoming a counter-trend zone once more.
But my point goes deeper than what you’ll hear in lessons or YouTube videos. Like I said in another post — A Follow-up to “Adjustments for Better Readings & VSA vs BTC” — if it’s already out there, it’s probably old news.
A skilled trader keeps an open mind — merging everything into one system. And it's part of this oneness mindset that elite traders follow, which I want to share now.
So I ask you:
What if the idea of trend and counter-trend zones didn’t just apply to major levels?
What if this concept applied everywhere on the chart?
For me, this isn’t just a question anymore — it’s a fact. A fact that made me a better trader. I won’t lie — before I got good at this, I failed over and over. But I never quit. That’s not the point though. The point is to expand your vision and train yourself to react just like the elite do.
Take double or triple tops/bottoms — standard or rounded. These formations also act exactly like trend and counter-trend zones. And they stay relevant well into the future. Every level is tested at least twice, from both directions. Maybe not immediately, but eventually — across multiple time frames.
And just like that, a level becomes a major zone for future use — especially if you trade across multiple time frames. So be careful: if you’re only looking at the 1-hour chart, you might miss something important that’s playing out on the 3-minute. And that can trigger psychological discomfort... leading to FOMO — and all the mistakes that come with it.
Also remember — double and triple tops/bottoms are zones, not exact lines. Many traders lose trades by a single tick, just because they forget that rule.
Let’s go a bit deeper now.
Think about all the small highs and lows that appear between those tops and bottoms on a 3-minute chart.
How can they help you trade better? The answer goes back to my previous idea: Location, Location, Location — Consistency and Alignment.
I get it — staying observant 24/7 is hard. That’s why institutions and big players work in teams, in shifts. They’re never alone. You shouldn’t be either.
There’s a lot more that could be said about these levels and zones — how they reveal future trend behavior, a flow! even without indicators or VSA. It has to do with how specific highs and lows behave at certain points in time... but let’s leave that for now.
For the outro, remember this:
The real edge isn’t in indicators.
It’s in your ability to catch the flow of price,
And to read strength or weakness through the simple structures within the zones Big Players create — whether visible or hidden.
A chart isn’t a single truth.
It’s a battlefield of conflicting zones and mixed signals.
If this mindset resonates with you and you want to go deeper — whether it’s building confidence or spotting hidden signals early — I work with a small circle of traders, sharing TA privately every day. Feel free to reach out.
Until next time, be well and trade wisely.
GBPUSD - One More Leg for Bears to Take Over!Hello TradingView Family / Fellow Traders. This is Richard, also known as theSignalyst.
📈GBPUSD has been overall bullish trading within the rising broadening wedge pattern marked in red.
However, it is currently approaching the upper bound of the wedge acting as an over-bought zone.
And the $1.365 - $1.375 is a strong resistance zone.
🏹 Thus, the highlighted red circle is a strong area to look for sell setups as it is the intersection of resistance and upper red trendline acting as a non-horizontal resistance.
📚 As per my trading style:
As #GBPUSD approaches the red circle zone, I will be looking for bearish reversal setups (like a double top pattern, trendline break , and so on...)
📚 Always follow your trading plan regarding entry, risk management, and trade management.
Good luck!
All Strategies Are Good; If Managed Properly!
~Rich
Disclosure: I am part of Trade Nation's Influencer program and receive a monthly fee for using their TradingView charts in my analysis.

CHFJPY - Bullish... but not for long!Hello TradingView Family / Fellow Traders. This is Richard, also known as theSignalyst.
📈CHFJPY has been overall bullish trading within the rising channel marked in blue. However, it is currently retesting the upper bound of the channel.
Moreover, the red zone is a strong structure and resistance.
🏹 Thus, the highlighted red circle is a strong area to look for sell setups as it is the intersection of the upper blue trendline and resistance.
📚 As per my trading style:
As #CHFJPY is around the red circle zone, I will be looking for bearish reversal setups (like a double top pattern, trendline break , and so on...)
📚 Always follow your trading plan regarding entry, risk management, and trade management.
Good luck!
All Strategies Are Good; If Managed Properly!
~Rich
Disclosure: I am part of Trade Nation's Influencer program and receive a monthly fee for using their TradingView charts in my analysis.

Nasdaq Potential Daily ReversalIPDA Speaking + Contract closure we can see speed take place to reach BSL outside IPDA range but why whould the just past 20 days HRLR instead of moving higher with speed
Because of Intermarket striction
maybe to build more stops there but it would be greater in terms of liquidity efficiency to place a fake D high in here and reverse, take the liquidity lower on D HRLR and then continue higher to reach 22,672.00.
The key here is: do we breach above the D SIBI or do we react from it.
one of two will unlock the next 20 to 40 trading days of delivery.

"Crypto Charts Whisper—Are You Listening?"As I’ve mentioned before, the market is manipulated. In a previously published idea, “VSA vs BTC: Into a Bearish Scenario or Not?”, this manipulation becomes obvious. The big players—whales, institutions, banks—are deliberately engineering traps to absorb liquidity from uninformed retail traders, boosting their profits and power.
Some informed retail traders like you and me understand that behind these entities are teams of insiders and highly trained traders operating around the clock—24/7, 365 days a year. That’s what it takes to survive in such a demanding environment.
This is especially true in the crypto market, which—despite its explosive growth—is still a baby in terms of total market cap. That’s why price fluctuations are so extreme, whether it’s Bitcoin, Ethereum, or altcoins.
Many of you who have been in the space since the early days already know: Bitcoin is the king. As the first coin built on cryptography, Bitcoin leads the way—and where it goes, altcoins follow. These movements often align with changes in Bitcoin Dominance.
So, yes, Bitcoin is the king—but its movements aren’t random. Bitcoin follows rules, and these rules are shaped by data—especially macroeconomic data. One major example is the Consumer Price Index (CPI), released monthly by the U.S. Department of Labor and Statistics.
And here's the key: the big players often have early access to this kind of information. They prepare accordingly—days before the official release—and when the data hits, they move the markets up or down. Even whales don’t act on gut feelings. They follow a framework.
We, as retail traders, must adopt a similar approach. We may not have insider access, but we do have knowledge—and with an open mind, we can act in advance.
As I’ve emphasized before: learning to read Market Structure lets you decode not just market psychology, but also the intentions of the big players. Their large positions leave footprints, just like a ship cuts a path through water. That trail is visible—for those who know where to look.
If you study volume correctly, you’ll start to notice certain zones that keep coming back. That’s all I’ll say—for now.
Unfortunately, many traders rely blindly on strategies like swing trading, expecting price to react at predefined swing highs or lows. But this rarely happens on schedule—especially in crypto. Yes, swing highs and lows exist—that’s the nature of all markets—but in between those levels, the big players create hidden structures that act as signals.
These aren’t just random formations—they’re part of how the big players "communicate" with one another. First, to maintain balance within their own circles. Second, to create FOMO and trap emotional retail participants.
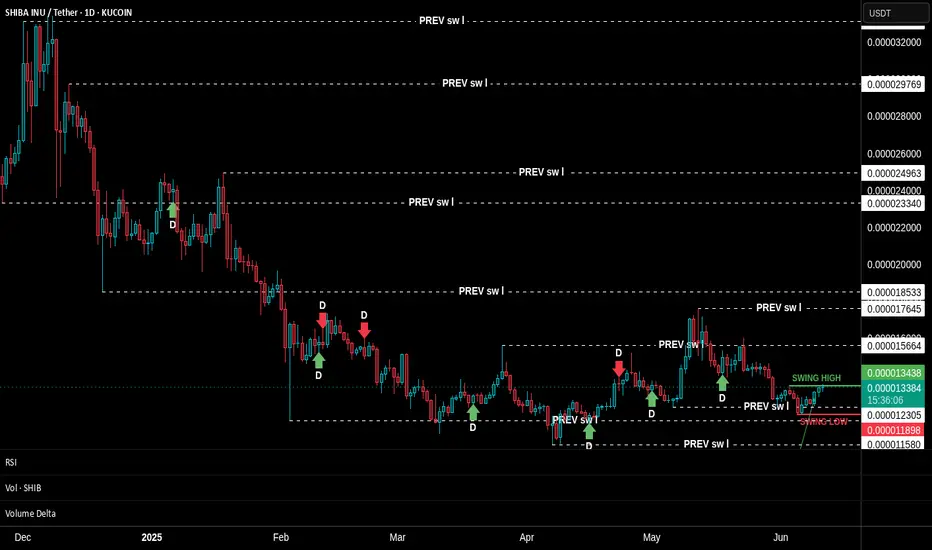
Look at the SHIBA INU chart I’ve shared. This technique is unfolding in real time. Do you notice how the structure is compressing? How price and new swing levels are squeezing in? Look closer at the footprints I’ve highlighted—some of those levels are being respected and reused in the future.
We’re taught from childhood that "we can’t know the future." But is that really true? Repetition of such beliefs is common—worldwide. But again, is it true? I think not.
Think about this: if you drive a car full-speed toward a wall and don’t brake, what happens? You crash. Isn’t that a form of future reading? It’s based on logic, observation, and probability. The same tools we use in market analysis.
So, I hope my words challenge your thinking.
📅 As of this writing (June 11, 2025), Bitcoin is trading at $109,588.
Today’s candle still has about 17 hours left to form, and price action on the daily timeframe is sitting within a previously established supply zone. Bulls and bears are clashing here. But zoom in: what's happening on the lower timeframes? Which signals have been tested, and which haven't?
Are we about to see a breakthrough above the all-time high?
Could this be the launch of the next leg of the bull run?
A Follow up to: “Adjustments for Better Readings & VSA vs BTC"When a trend approaches its end, we typically observe the formation of a buying or selling climax. That was certainly the case during Wyckoff’s era. Everything he described—market manipulation, signals, footprints—remains relevant today. But you know what that also means: if it's out there, it’s old news.
Yes, this is still happening, but we need to acknowledge that this information is no longer exclusive. And when a method becomes well-known—especially among retail traders—it can be used against them. Wyckoff himself hinted at this: the manipulators can and do use these same technical patterns to deceive. His real message?
“Keep an open mind.”
📉 In our current BTC chart, we’re seeing a textbook example of potential manipulation. A selling climax is visible—normally a sign of trend exhaustion and a bullish reversal. But is that really the case here? Did the downtrend truly end?
On the 1-Hour timeframe, both the RSI and volume indicators suggest otherwise: a bearish continuation seems more likely.
🧱 We're also witnessing a real-time formation of a Double Top pattern, taking shape since June 6. Measured by body candle spreads (excluding wicks), we observe four touches within a key price rectangle. These align with a known candlestick pattern: the Tweezer Top, commonly associated with bearish reversals.
What’s more, all of this is happening within a supply zone—actually three marked zones on the chart. The most recent zone shows signs of offloading pressure, amplified by both the Double Top and bearish candlestick formations.
And I haven’t even touched on the rejection wicks or how bearish volume spikes are gaining strength. That’s where the principle of Effort vs. Result comes in—remember, nothing in the market is free.
📊 In line with our past two posts, note how price action (PA) shows equal highs while RSI diverges, reinforcing earlier signals. The signs are stacking up.
So, the critical question now is:
Are we heading below the $100.718 level for a confirmed Head & Shoulders pattern?
Or is this just a retest before another move?
If this way of reading the market resonates with you and you want to go deeper—whether it’s building confidence or spotting signals before they play out—I work with a small circle of traders sharing TA privately on a daily basis. Feel free to reach out.
Till next time be well and trade wisely!

Adjustments for Better ReadingsMany traders rely on technical indicators to identify opportunities for profit—that's the whole point of this game. Whether it’s scalping, day trading, swing trading, or shorting the market, most trading decisions are based on indicator readings—be it a single indicator or a combination of several.
But here’s the truth: not all traders truly understand what an indicator is. They don’t grasp its nature—let alone the fact that this nature can be adjusted.
Those who don’t understand how or why an indicator works often find themselves in stressful and uncomfortable situations. It’s no coincidence that we often hear the common phrase: “Only 1% of all traders succeed, while 80% blow their accounts, and the remaining 19% barely break even.”
Why? Because the elite traders understand something most don’t:
Whether an indicator is leading or lagging, it can be customized to behave differently across different timeframes.
These adjustments can be found in the settings section of every indicator.
Let’s take the Relative Strength Index (RSI), which I’ve mentioned in previous ideas. Some of you may have noticed that my RSI plot looks different from yours. That’s because I don’t use the default 14-period RSI, which averages out the last 14 candles.
RSI is naturally lagging by default—but that doesn’t mean it can’t be trusted. In fact, with the right adjustments, that lagging nature can become leading. Learn how to do this. Push yourself. Educate your mind. Master this, and you might just find yourself among the top 1%.
Markets react to signals—signals that are often hidden in plain sight, created by the big players who always leave behind footprints. This is the trader’s true skill: seeing the whole picture.
A good friend once told me: Be a detective.
Now let’s go to the chart.
We clearly see a bearish strength unfolding.
Not only is the 9-period RSI plot trending below the yellow 28-period Weighted Moving Average (WMA), but we also observe a healthy continuation of the downtrend, confirmed by the WMA itself.
Using a 9-period RSI gives faster signals, while the 28 WMA offers smoother confirmations. This combo is applied on the daily timeframe—but every timeframe has its own ideal settings.
Now, when the RSI plot trends above the WMA, this can act as a potential reversal signal or even a confirmation of a trend change, depending on the broader market structure and volume context. It's not just about the crossover—it’s about what follows next. That’s where the detective work begins.
What do we see today?
Looking solely at the daily timeframe, the downtrend seems far from over. But to analyze it professionally, we must wait for the candle of Friday, June 6th, 2025 to close.
Switching to the lower timeframes, we see something interesting—a sort of bullish dominance unfolding during this incomplete trading day. But the real question is: Is it actual dominance?
Let’s break it down:
We have a clearly formed Head & Shoulders pattern.
The bearish Marubozu candle from June 5th made a new lower low (LL).
But—it did not close below the key swing low at 100.718.
Therefore, the Head & Shoulders pattern is not confirmed—it hasn’t broken and closed below that swing level.
So what’s happening in the lower timeframes?
In the 4-hour timeframe, we’re seeing a real-time crossover above the WMA (though the session isn’t closed yet).
In the 1-hour timeframe, the crossover has already occurred.
Now, such a crossover—where the RSI plot moves above the WMA—can often act as an early signal for a reversal, or at the very least, indicate a strong pullback. But don’t take it at face value—context is king. This is why we pair it with other signals like divergence, price action, and volume behavior for confirmation.
Across the 4H, 3H, and 1H timeframes, we’re observing this bullish pullback, yet it’s accompanied by an RSI Hidden Bearish Divergence (see: Macro Noise vs Micro Truth: The Art of Hidden Divergences).
Is this pullback a true reversal?
According to Volume Spread Analysis (VSA) (read: VSA vs BTC: Into a Bearish Scenario or Not?), a new narrative is emerging—but not without contradiction.
Price is climbing, yes.
But bullish volume spikes are declining, supporting our RSI hidden divergence. This volume-price disagreement is a clue.
What will reveal the truth?
Today's closing candle.
If price action (PA) creates a higher high (HH) but RSI creates a lower high (LH) → Bearish Divergence
If RSI makes a HH but PA creates a LH → Hidden Bearish Divergence
And for those of you who truly understand market structure:
The 100.718 level was a buy opportunity to secure profits.
If you caught that—congratulations. You’ve done your homework.
Now, you can sit back, relaxed, and wait for the next signal.
The market is a breathing organism. If you’re in sync with it—you’ll feel it.
And for those who believe there’s more to learn—but are struggling to find answers—there’s no shame in asking questions.
Till next time, take care—and trade wisely.
P.S. RSI plot, WMA, candlestick patterns, and Volume Spread Analysis (VSA)—when combined and used properly—can become a powerful toolset. For those willing to go deeper, they’re more than enough.
