CVNA Long after completed Fib. RetracementCVNA on a 30 minute chart trended up from November post earnings for 6-7 weeks until
December 20th and then started falling from a head and shoulders pattern at the pivot.
The Fib retracement tool is used to draw the retracement of the prior up trend. The Trend
Based Fib Time is used on that prior up trend to show fib levels across time instead of price.
Price is currently at the 0.5 Fib retracement for price and also at 0.5 for the latter tool.
The other indicators show rising RSI, a flip between positive and negative directional indices
and volatility beyond the running mean. I will take a long trade here targeting 52.3 which is
just under a 0.5 fib retracement of the recent trend down. The stop loss will be set
at 42.8 at the level of the reversal narrow-ranged candles. A option trade will be entertained
for the February monthly expiration.
Reversal

NZDCAD - Keep It Simple 👌Hello TradingView Family / Fellow Traders,
On Daily: Left Chart
NZDCAD broke below a previous major low so it is now acting as a local resistance zone, thus we will be looking for trend-following sell setups on lower timeframes.
On H1: Right Chart
📈 For the bears to take over, we need a momentum candle close below the last major low in gray.
📉 Meanwhile, until the bears take over, NZDCAD can still trade higher for an over-extended correction movement.
📚 Always follow your trading plan regarding entry, risk management, and trade management.
Good luck!
All Strategies Are Good; If Managed Properly!
~Richard Nasr

Standard deviation projection based off manipulation legThis clear setup shows where price is projected to go based off of the manipulation leg. Price disrespects and pushes through the reversal zone. Price comes back and retests the zone and continues up to the projected -4 area.

GBPUSD - Top-Down Analysis 📹 From Daily To H1Hello TradingView Family / Fellow Traders. This is Richard, also known as theSignalyst.
📈 Here is a detailed update top-down analysis for #GBPUSD.
Which scenario do you think is more likely to happen? and Why?
📚 Always follow your trading plan regarding entry, risk management, and trade management.
Good Luck!.
All Strategies Are Good; If Managed Properly!
~Rich

Double Bottom - UCADHere I have USD/CAD on the 1 HR Chart!
Price has outlined a very clear Double Bottom pattern with the two Lows!
RSI is giving us a Bullish Divergence which tells me price really wants to work higher from this point!
Price has now broken the Confirmation of Pattern!
With this PA of now Higher Highs, we look for the next Low to be Higher than the Low of the Double Bottom being our INVALIDATION!
Fundamentally this week:
USD - Richmond Index (Tue) Flash PMI (Wed) Advance GDP, Unemployment, Durable Goods (Thur) Core CPE (Fri)
CAD - NHPI (Tue) BOC Monetary Policy, Rate Statement & Press Conference (Wed)
*If price does come down to test this break, I suspect the Support Zone @ Confirmation will be enough to catapult price up into the overhead Resistance Zone and Above!

AUDCHF - Wait For The Bears 🐻Hello TradingView Family / Fellow Traders,
On Daily: Left Chart
AUDCHF is retesting a strong resistance zone so we will be looking for sell setups on lower timeframes.
On H1: Right Chart
📈 For the bears to take over, we need a momentum candle close below the last major lower in gray.
📉 Meanwhile , AUDCHF would be bullish, and can still trade higher inside the resistance or even break it higher.
📚 Always follow your trading plan regarding entry, risk management, and trade management.
Good luck!
All Strategies Are Good; If Managed Properly!
~Richard Nasr

Is Boeing a buy before earnings? LONGThis is a daily Boeing chart with the idea on the chart in the text. There may be a good entry
before earnings using a stop loss under the POC line and an ultimate target of the projected
trendline resistance at $280-$300 if all goes well fundamentally with an FAA investigation
and its sequelae. A megaphone pattern demonstrates increasing volatility in price action which
is something some traders take to the bank. My analysis is that this may be a safe swing trade
until the report of the 24Q2 earnings in about 100 days.

Down during some years and then megarocket or rock bottomWith the help of the Elliot wave theory and use of fibbonacci levels there is a potentiall downside for some years. It will potentially play out in a doubble zigzag hitting the same pricelevel. If this plays out there is a chance for the price finding support att the 0.7 fib and creating a double bottom, leading to a big reversal and increase of value for BTC/USD.

Crude Oil Reversal Opp 18.01.2024It looks like Crude oil experienced a sharp drop lately followed by a strong reversal.
This creates an opportunity for trading the retracement that will probably happen if the resistance proves to be strong enough.
__________________________
Information Regarding Important News and Figures can be found here in our Economic Calendar: mau.bdswiss.com/economic-calenda...
Risk Warning: Trading in CFDs is highly speculative and carries a high level of risk. It is possible to lose all of your invested capital. These products may not be suitable for everyone, and you should ensure that you fully understand the risks taking into consideration your investment objectives, level of experience, personal circumstances as well as personal resources. Speculate only with funds that you can afford to lose. Seek independent advice if necessary. Please refer to our Risk Disclosure.
BDSwiss is a trading name of BDS Markets and BDS Ltd.
BDS Markets is a company incorporated under the laws of the Republic of Mauritius and is authorized and regulated by the Financial Services Commission of Mauritius ( FSC ) under license number C116016172, address: 6th Floor, Tower 1, Nexteracom Building 72201 Ebene.
BDS Ltd is authorized and regulated by the Financial Services Authority Seychelles (FSA) under license number SD047, address: Suite 3, Global Village, Jivan’s Complex, Mont Fleuri, Mahe, Seychelles. Payment transactions are managed by BDS Markets (Registration number: 143350).

NKE - Just Do It ✔️Hello TradingView Family / Fellow Traders,
On Weekly: Left Chart
NKE has been hovering inside a range in the shape of a symmetrical triangle.
Moreover, it is currently sitting around a strong round number 100.0
🏹 Hence , as long as the 100.0 support holds, we will be looking for buy setups on lower timeframes.
On Daily: Right Chart
📈 For the bulls to take over, we need a momentum candle close above the last major high in green at 107.0
📉 Meanwhile , NKE would be bearish, and if the 100.0 support is broken downward, we can expect a bearish continuation towards the lower weekly trendline where we will be looking for new buy setups.
📚 Always follow your trading plan regarding entry, risk management, and trade management.
Good luck!
All Strategies Are Good; If Managed Properly!
~Richard Nasr

EURUSD - Reversal EURUSD has made its LL with morning star candle stick pattern. Exposed Divergence shows the reversal to bullish trend. Buy Entry on the previous LH will make sure that bearish trend breaks and then it will be a bullish run.

BTC - Top-Down Analysis 📹 from Weekly to H4Hello TradingView Family / Fellow Traders. This is Richard, also known as theSignalyst.
📈 Here is a detailed update top-down analysis for #BTC.
Which scenario do you think is more likely to happen? and Why?
📚Always follow your trading plan regarding entry, risk management, and trade management.
Good Luck!.
All Strategies Are Good; If Managed Properly!
~Rich

EURAUD - Top-Down Analysis 📹 From Daily To M30Hello TradingView Family / Fellow Traders. This is Richard, also known as theSignalyst.
📈 Here is a detailed update top-down analysis for #EURAUD .
Which scenario do you think is more likely to happen? and Why?
📚 Always follow your trading plan regarding entry, risk management, and trade management.
Good Luck!.
All Strategies Are Good; If Managed Properly!
~Rich

Double Bottom | Nearly 60% profitableOn week chart
ENS has been creating Double Bottom and moving up to break #Neckline
Wait for a breakout and retest to confirm for this pattern
The target around 17.5
Time will tell

Potential Head and Shoulders - GUHere I have GBPUSD on the 4Hr Chart!
Price had been ultimately traveling sideways but after the Lower High created on Jan. 5th, price has been unable to break it and is in a steep decline after the positive news for USD!
Giving us what looks to be a potential Head and Shoulders pattern!!
With the very wide "Right Shoulder" theoretically being created, we are now waiting for the Confirmation of Pattern with Price touching the "Neckline" or Support Zone I have marked.

The Reversal is NEAR 🏹Hello TradingView Family / Fellow Traders. This is Richard, also known as theSignalyst.
📈 NEAR has exhibited an overall bullish trend , trading above the red trendlines zone.
At present, NEAR is undergoing a correction phase and it is currently approaching the red trendline acting as a non-horizontal support.
Moreover, it is retesting a strong demand zone marked in green.
🏹 Thus, the highlighted blue circle is a strong area to look for buy setups as it is the intersection of the green demand and lower red trendline acting as a non-horizontal support.
📚 As per my trading style:
As #NEAR approaches the lower blue circle zone, I will be looking for bullish reversal setups (like a double bottom pattern, trendline break , and so on...)
📚 Always follow your trading plan regarding entry, risk management, and trade management.
Good luck!
All Strategies Are Good; If Managed Properly!
~Rich

Head & Shoulders - EUHere I have EUR/USD on the 4hr Chart!!
Much like its counter-part GBP/USD, Price on EUR/USD has been forming the same looking Reversal pattern called a Head and Shoulders!!
Now our Last Lower High is the finally move price can make before inevitably having to start creating Lower Lows!
Confirmation of the Pattern will come when price Breaks and Closes below our "Neckline" @ 1.08918

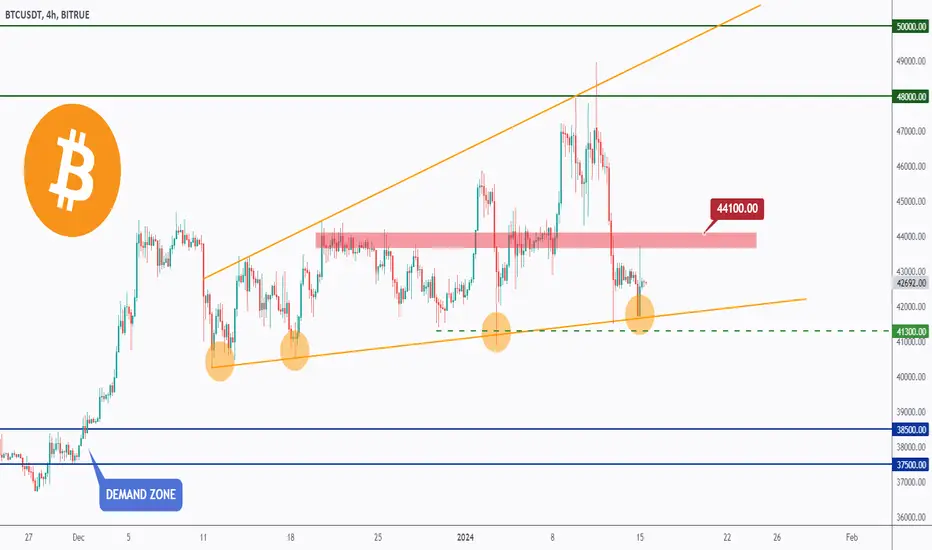
BTC - Short-Term Decision Zone 📈📉Hello TradingView Family / Fellow Traders,
After breaking below the 45,000 local support, BTC traded lower, and it is currently sitting around the lower bound of the orange flat wedge pattern.
Now, what's next?
As long as 41,300 holds, we will be looking for trend-following buy setups.
📈 For the bulls to take over, we need a momentum candle close above the 44,100 local resistance. In this case, a movement towards the 48,000 - 50,000 resistance zone would be expected.
📉 Alternatively, if 41,300 is broken downward , we expect further bearish movement towards the 38,500 demand zone.
Which scenario do you think is more likely to happen first, and why?
📚 Always follow your trading plan regarding entry, risk management, and trade management.
Good luck!
All Strategies Are Good; If Managed Properly!
~Richard Nasr
GBPCHF - Wait For The Trigger 🎯Hello TradingView Family / Fellow Traders,
📈 GBPCHF is overall bullish from a short-term perspective trading inside the rising wedge in red.
However , it is currently sitting around a strong supply zone, thus we will be looking for sell setups.
📉 For the bears to take over and activate our sell setup, we need a momentum candle close below the last major low highlighted in gray.
Meanwhile, until the sell is activated, GBPCHF would remain bullish and can still break the supply zone upward.
📚 Always follow your trading plan regarding entry, risk management, and trade management.
Good luck!
All Strategies Are Good; If Managed Properly!
~Richard Nasr

Reviewing GU from a Swing perspectiveWe are now 2 weeks in on the new year and as the major players come back in to the market it looks like they spent the first 2 weeks of the year accumulating orders to go bearish. As we come into the new week we are looking for more signs that price wants to go bearish now.

Nice Price ActionGU was a bit rotational this week but we still managed to obtain so solid moves. Not bad for a Friday today. Will continue to monitor price for quality set ups next week. Being that we are coming into Mid Jan it looks like the market is ready to shift back to normal.

BTC - Next Stop 50k 📍 Unless!Hello TradingView Family / Fellow Traders,
In my latest analysis, BTC successfully surpassed the 45,000 resistance and traded higher.
However, yesterday, BTC faced rejection at the 48,000 level and the upper boundary of the orange wedge pattern.
Now, what's next?
📈 BTC is anticipated to remain bullish , and we anticipate a potential movement towards the weekly resistance zone between 48,000 and 50,000, as long as the 44,500 support level is maintained.
📉 In the event of a downward break below the lower red trendline and the 44,500 support level, we expect a continuation of bearish movement until reaching the lower boundary of the orange wedge pattern, approximately around 42,500.
Which scenario do you believe is more likely to occur first, and why?
📚 Always follow your trading plan regarding entry, risk management, and trade management.
Good luck!
All Strategies Are Good; If Managed Properly!
~Richard Nasr

EURJPY - Potential Bearish Control 🐻Hello TradingView Family / Fellow Traders,
📈 EURJPY been overall bullish , trading inside the blue channel and it is currently approaching the upper blue trendline.
Moreover, the zone 159-160 is a robust resistance zone.
🎯 Therefore, the highlighted red circle represents a significant area to consider for potential sell setups , as it marks the intersection of the red resistance and upper blue trendline.
📚 As per my trading style:
As EURJPY approaches the blue circle zone, I will be actively searching for bearish reversal setups to capture the next bearish impulse movement.
📚 Always follow your trading plan regarding entry, risk management, and trade management.
Good luck!
All Strategies Are Good; If Managed Properly!
~Richard Nasr
