Follow the Flow: Trading with Liquidity ZonesLiquidity is where the market breathes. The Liquidity Zones indicator by BigBeluga helps traders visualize where large players may be hiding orders—revealing the zones where price is most likely to react, reverse, or accelerate.
Let’s break down how this tool works, how we use it at Xuantify, and how you can integrate it into your own strategy.
🔍 What Is the Liquidity Zones Indicator?
This open-source tool identifies pivot highs and lows filtered by volume strength and plots them as liquidity zones —highlighting areas where buy/sell orders are likely to accumulate.
Key Features:
Volume-filtered pivot detection (Low, Mid, High)
Dynamic or static liquidity zone boxes
Color intensity based on volume strength
Liquidity grab detection with visual cues
These zones act as magnets for price , helping traders anticipate where reactions, reversals, or stop hunts may occur.
🧠 How We Use It at Xuantify
We use Liquidity Zones as a contextual map for structure and execution.
1. Entry & Exit Planning
We align entries near untested liquidity zones and use them as targets for exits—especially when confirmed by structure or momentum.
2. Liquidity Grab Detection
When price pierces a zone and reverses, it often signals a liquidity sweep . We use this as a trigger for reversal setups.
3. Volume Context
Zones with higher volume intensity are prioritized. These are more likely to attract institutional activity and generate stronger reactions.
🧭 Dynamic vs. Static Zones
The indicator offers both dynamic and static zone modes:
Dynamic : Box height adjusts based on normalized volume, showing how much liquidity is likely present.
Static : Consistent box size for cleaner visuals and easier backtesting.
Why this matters:
Dynamic zones reflect real-time volume strength
Static zones offer simplicity and clarity
Both modes help visualize where price is likely to “grab” liquidity
⚙️ Settings That Matter
To get the most out of this tool, we recommend:
Volume Strength = Mid or High for cleaner zones
Enable Dynamic Mode when trading volatile assets
Use Color Intensity to quickly spot high-liquidity areas
🔗 Best Combinations with This Indicator
We pair Liquidity Zones with:
Market Structure Tools – BOS/CHOCH for context
Momentum Indicators – Like RSI or MACD for confirmation
Fair Value Gaps (FVGs) – For precision entries near liquidity
This layered approach helps us trade into liquidity , not against it.
⚠️ What to Watch Out For
Liquidity zones are not signals —they’re context . In fast-moving or low-volume markets, price may ignore zones or overshoot them. Always combine with structure and confirmation.
🔁 Repainting Behavior
The Liquidity Zones indicator is designed to be non-repainting . However, due to waiting for pivot confirmation, the zones are plotted in hindsight. This makes it suitable for real-time execution .
⏳ Lagging or Leading?
This tool is partially lagging —it waits for pivot confirmation and volume validation before plotting a zone. However, once plotted, these zones often act as leading levels , helping traders anticipate where price may react next.
🚀 Final Thoughts
The Liquidity Zones indicator by BigBeluga is a powerful visual tool for traders who want to understand where the market is likely to move—not just where it’s been. Whether you’re trading reversals, breakouts, or mean reversion, this tool helps you stay aligned with the market’s hidden intent.
Add it to your chart, test it, and see how it sharpens your edge.
Reversal

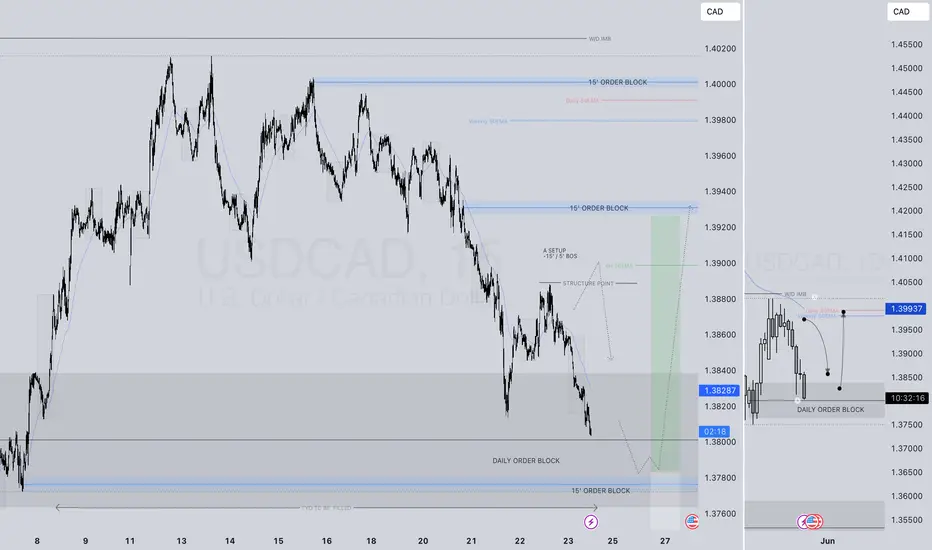
PERHAPS... USDCAD LONG FORECAST Q2 W21 D23 Y25PERHAPS... A REVERSAL BACK TO THE HTF 50EMA's
USDCAD LONG FORECAST Q2 W21 D23 Y25
Professional Risk Managers👋
Welcome back to another FRGNT chart update📈
Diving into some Forex setups using predominantly higher time frame order blocks alongside confirmation breaks of structure.
Let’s see what price action is telling us today!
💡Here are some trade confluences📝
✅Daily Order Block
✅Tokyo ranges to be filled
✅15' order block identified
✅Weekly 50 EMA
✅Daily 50 EMA
🔑 Remember, to participate in trading comes always with a degree of risk, therefore as professional risk managers it remains vital that we stick to our risk management plan as well as our trading strategies.
📈The rest, we leave to the balance of probabilities.
💡Fail to plan. Plan to fail.
🏆It has always been that simple.
❤️Good luck with your trading journey, I shall see you at the very top.
🎯Trade consistent, FRGNT X
EURUSD - The Bears Are Getting Started!Hello TradingView Family / Fellow Traders. This is Richard, also known as theSignalyst.
📈EURUSD has been bullish trading within the rising blue channel.
However, it is currently retesting the upper bound of both red and blue channels.
🏹 The highlighted red circle is a strong area to look for sell setups as it is the intersection of the upper trendlines and orange resistance zone.
📚 As per my trading style:
As #EURUSD is around the red circle zone, I will be looking for bearish reversal setups (like a double top pattern, trendline break , and so on...)
📚 Always follow your trading plan regarding entry, risk management, and trade management.
Good luck!
All Strategies Are Good; If Managed Properly!
~Rich
Disclosure: I am part of Trade Nation's Influencer program and receive a monthly fee for using their TradingView charts in my analysis.

Amara Raja Energy & Mobility Limited Trend Reversal On ChartAmara Raja Energy & Mobility Limited, a flagship company of the group, is India’s largest manufacturer of automotive and industrial batteries. The company also produces Li-ion cells and battery packs for electric vehicles and the telecom industry.
At current price it looks very attractive for short term gains .
Short term target may show Up move to 1100 levels and initial support at 996
long term target intact 1700-1860 levels.

Xrp - Prepare for at least a +50% move!Xrp - CRYPTO:XRPUSD - will head much higher:
(click chart above to see the in depth analysis👆🏻)
Xrp has perfectly been respecting market structure lately and despite the significant volatility, the overall crypto market remains bullish. Especially Xrp is about to perform a bullish break and retest, which - if confirmed by bullish confirmation - could lead to a rally of about +50%.
Levels to watch: $3.0
Keep your long term vision!
Philip (BasicTrading)

GBPJPY - Bullish No More!Hello TradingView Family / Fellow Traders. This is Richard, also known as theSignalyst.
📈As per our last GBPJPY analysis (attached on the chart), it rejected the lower bound of the rising blue channel.
What's next?
GBPJPY is currently approaching the upper bound of its falling trend marked in red.
Moreover, the green zone is a strong structure and resistance.
🏹 Thus, the highlighted red circle is a strong area to look for sell setups as it is the intersection of structure and upper red trendline acting as a non-horizontal resistance.
📚 As per my trading style:
As #GBPJPY approaches the red circle zone, I will be looking for bearish reversal setups (like a double top pattern, trendline break , and so on...)
📚 Always follow your trading plan regarding entry, risk management, and trade management.
Good luck!
All Strategies Are Good; If Managed Properly!
~Rich
Disclosure: I am part of Trade Nation's Influencer program and receive a monthly fee for using their TradingView charts in my analysis.

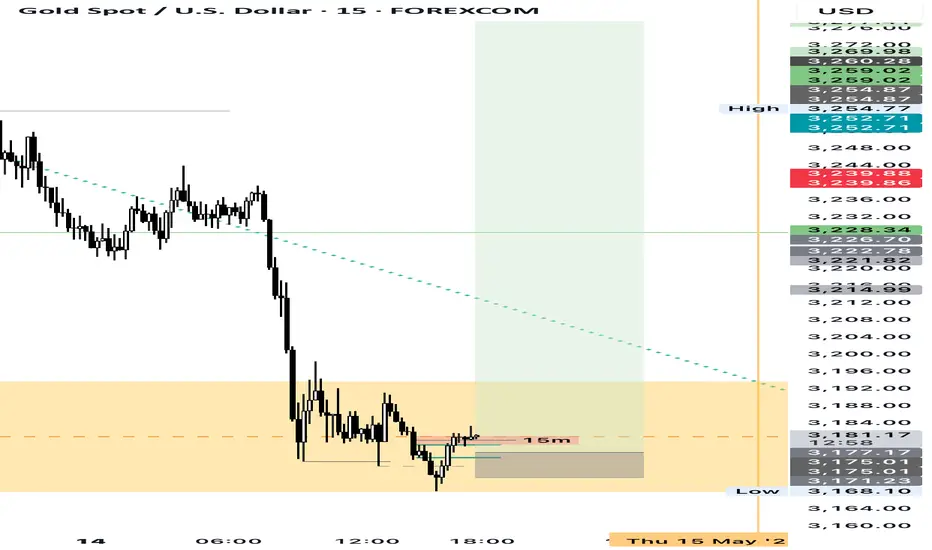
XAUUSD REVERSALI’m anticipating a long term reversal on Gold that will last for quite some time.
This kind of trade can yield a lot of returns if we enter at the right TIME.
It should buy for about 5 months if I’m not mistaken.
DF://
Too Many Bullish Clues — Greed Activated📍Current Price: 143.437
TimeFrame 30Min
Bullish Reasons:
+ Strong Support
+ Psychological Level
+ Tweezer Bottom
+ Bullish RSI Divergence
+ Channel Bottom
= Potential Bullish Reversal
Support & Resistance Levels:
• 142.000 – Strong Support + Psychological Level
• 140.000 – Strong Support + Psychological Level
• 148.000 – Psychological Level + Price Target
• 150.000 – Psychological Level
"Trade smart – always follow your risk management.
Protect your account first, profits will follow.
Happy trading!"

Solana - This just faked out literally everybody!Solana - CRYPTO:SOLUSD - just faked out literally everybody:
(click chart above to see the in depth analysis👆🏻)
Over the course of the past 25 days, Solana dropped a significant -30% and wiped out a ton of bulls before creating a complete reversal. Especially with the current horizontal support level, bulls are taking over again, offering us another major crypto trading opportunity.
Levels to watch: $120, $250
Keep your long term vision!
Philip (BasicTrading)

GBPUSD - Bearish Pressure Soon!Hello TradingView Family / Fellow Traders. This is Richard, also known as theSignalyst.
📈As per our last GBPUSD analysis, it rejected the $1.27 - $1.28 support zone and has been trading higher.
This week, GBPUSD is approaching the upper bound of its rising wedge pattern marked in red.
Moreover, the blue zone around $1.34 is a strong resistance and previous weekly high.
🏹 Thus, the highlighted red circle is a strong area to look for sell setups as it is the intersection of the upper red trendline and resistance.
📚 As per my trading style:
As #GBPUSD retests the red circle zone, I will be looking for bearish reversal setups (like a double top pattern, trendline break , and so on...)
📚 Always follow your trading plan regarding entry, risk management, and trade management.
Good luck!
All Strategies Are Good; If Managed Properly!
~Rich
Disclosure: I am part of Trade Nation's Influencer program and receive a monthly fee for using their TradingView charts in my analysis.

EURNZD - The Bull of the Week!Hello TradingView Family / Fellow Traders. This is Richard, also known as theSignalyst.
📈EURNZD has been overall bearish trading within the falling channel marked in red.
However, it is retesting the lower bound of the channel acting as an over-sold area.
Moreover, the blue zone is a strong demand!
🏹 Thus, the highlighted blue circle is a strong area to look for buy setups as it is the intersection of demand and lower red trendline acting as a non-horizontal support.
📚 As per my trading style:
As #EURNZD approaches the blue circle zone, I will be looking for bullish reversal setups (like a double bottom pattern, trendline break , and so on...)
📚 Always follow your trading plan regarding entry, risk management, and trade management.
Good luck!
All Strategies Are Good; If Managed Properly!
~Rich
Disclosure: I am part of Trade Nation's Influencer program and receive a monthly fee for using their TradingView charts in my analysis.

EURAUD - Long-Term Correction in the Making!Hello TradingView Family / Fellow Traders. This is Richard, also known as theSignalyst.
📈EURAUD has been bullish trading within the rising channel in blue.
Currently, EURAUD is retesting the upper bound of the channel.
Moreover, the $1.84 - $1.87 is a strong weekly resistance zone.
🏹 Thus, the highlighted red circle is a strong area to look for sell setups as it is the intersection of the upper blue trendline and green resistance zone.
📚 As per my trading style:
As #EURAUD is hovering around the red circle zone, I will be looking for bearish reversal setups (like a double top pattern, trendline break , and so on...)
📚 Always follow your trading plan regarding entry, risk management, and trade management.
Good luck!
All Strategies Are Good; If Managed Properly!
~Rich
Disclosure: I am part of Trade Nation's Influencer program and receive a monthly fee for using their TradingView charts in my analysis.

EURNZD - Strong Intersection!Hello TradingView Family / Fellow Traders. This is Richard, also known as theSignalyst.
📈EURNZD has been in a correction phase trading within the falling red channel and it is currently retesting the lower bound of the bullish channel marked in blue.
Moreover, the green zone is a strong structure and support zone.
🏹 Thus, the highlighted blue circle is a strong area to look for buy setups as it is the intersection of structure and lower blue and red trendlines acting as non-horizontal support.
📚 As per my trading style:
As #EURNZD approaches the blue circle, I will be looking for bullish reversal setups (like a double bottom pattern, trendline break , and so on...)
📚 Always follow your trading plan regarding entry, risk management, and trade management.
Good luck!
All Strategies Are Good; If Managed Properly!
~Rich
Disclosure: I am part of Trade Nation's Influencer program and receive a monthly fee for using their TradingView charts in my analysis.

GOLDM ANALYSISTechnical view on Goldm(mcx).
Disclaimer: This does not construe to be an investment advice. Investments/trading are subject to market risks.
All information is a point of view, and is for educational and informational use only.
The author accepts no liability for
any interpretation of articles or comments on this platform being
used for actual investments.

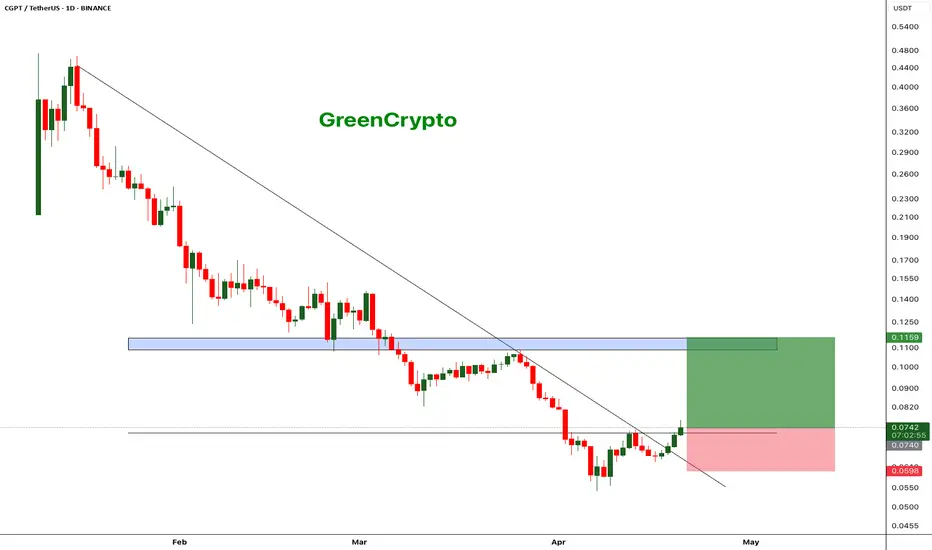
CGPT - Decent Swing Trade Opportunity $BINANCELCGPTUSDT (1D CHART) Technical Analysis Update
CGPT is currently trading at $0.0740 and successfully broke out from the local resistance and heading towards the next resistance. This gives a good opportunity for a quick swing trade with tight stoploss.
Entry level: $ 0.0740
Stop Loss Level: $ 0.0599
TakeProfit 1: $ 0.0818
TakeProfit 2: $ 0.0952
TakeProfit 3: $ 0.1114
Max Leverage: 2x
Position Size: 1% of capital
Remember to set your stop loss.
Follow our TradingView account for more technical analysis updates. | Like, share, and comment your thoughts.
Cheers
GreenCrypto
Mastering chart patterns - How to use them in trading!Chart patterns are visual formations created by the price movements of a financial asset—like a stock, currency, or cryptocurrency, on a price chart. Traders use these patterns in technical analysis to predict future market direction based on historical behavior. The main chart patterns are the reversal and continuation patterns.
-------------------------------
What will we discuss?
- Bullish reversal patterns
- Bearish reversal patterns
- Bullish continuation patterns
- Bearish continuation patterns
-------------------------------
Bullish reversal patterns:
Double bottom
A double bottom in trading is a bullish reversal pattern that signals the potential end of a downtrend and the beginning of an uptrend. It forms when the price of an asset falls to a low, bounces back up, then drops again to roughly the same low before rising once more. This creates a "W" shape on the chart.
How to trade it:
Before entering a trade, wait for the price to break back above the neckline with strong volume, as this indicates a potential bullish reversal. Once the breakout is confirmed, look for an entry on the pullback to the neckline.
Inverted head and shoulders
An inverted head and shoulders is a bullish reversal pattern that typically forms after a downtrend and signals a possible shift to an uptrend.
It consists of three parts:
* The left shoulder, where the price makes a low and then bounces.
* The head, which is a deeper low followed by another bounce.
* The right shoulder, a higher low similar in level to the left shoulder.
How to trade it:
Before entering a trade, wait for the price to break above the neckline with strong volume, as this confirms the pattern and signals a potential upward move. After the breakout, it's important to wait for a retest of the neckline to look for an entry. Traders typically place a stop-loss just below the right shoulder to manage risk.
Falling wedge
A falling wedge is a bullish chart pattern that often signals a potential reversal or continuation of an uptrend, depending on where it forms in a price trend.
It appears when the price is moving lower but within a narrowing range, creating two downward-sloping, converging trendlines. Both the highs and lows are falling, but the lower highs are coming down faster than the lower lows, which shows that selling pressure is losing strength over time.
How to trade it:
Wait for the falling wedge to break above the downward trendline and for the price to reclaim the most recent lower high. A breakout alone isn’t always reliable, sometimes the price moves briefly above the trendline without making a higher high, resulting in a fake-out. To confirm the move, wait for a clear higher high and then look to enter on the retracement that follows.
-------------------------------
Bearish reversal patterns
Double top
A double top is a bearish reversal pattern that signals a potential shift from an uptrend to a downtrend.
It forms when the price reaches a high, pulls back, then rallies again to the same or similar high but fails to break above it. This creates an "M" shape on the chart. The neckline is the support level at the low point between the two peaks. When the price breaks below this neckline with strong volume, it confirms the pattern and suggests that selling pressure is taking over.
How to trade it:
Before entering a trade, wait for the price to break below the neckline with strong volume, as this indicates a potential bearish reversal. Once the breakout is confirmed, look for an entry on the pullback to the neckline.
Head and shoulders
A head and shoulders is a bearish reversal pattern that typically forms after an uptrend and signals a potential shift to a downtrend.
It consists of three peaks:
* The left shoulder, where the price rises and then falls.
* The head, which is a higher peak followed by another decline.
* The right shoulder, a lower high that is roughly equal in height to the left shoulder.
How to trade it:
Before entering a trade, wait for the price to break below the neckline with strong volume, as this confirms the pattern and signals a potential downside move, After the breakout, it’s important to wait for a retest of the neckline to look for an entry. Traders typically place a stop-loss just above the right shoulder to manage risk
Rising wedge
A rising wedge is a bearish chart pattern that often signals a potential reversal or continuation of an downtrend, depending on where it forms in a price trend.
It appears when the price is moving higher but within a narrowing range, creating two upward-sloping, converging trendlines. Both the highs and lows are rising, but the highs are increasing at a faster rate than the lows. This suggests that buying pressure is weakening over time, and the market may be preparing for a downturn.
How to trade it:
Wait for the rising wedge to break below the upsloping trendline and for the price to reclaim the most recent high low. A breakout alone isn’t always reliable, sometimes the price moves briefly below the trendline without making a lower low, resulting in a fake-out. To confirm the move, wait for a clear lower low and then look to enter on the retracement that follows.
-------------------------------
Bullish continuation patterns
Bullflag
A bull flag is a continuation pattern that signals the potential for a price to continue moving upward after a brief consolidation or pullback.
It forms when the price experiences a strong upward move (the flagpole), followed by a period of consolidation or a slight downward movement (the flag). The flag typically slopes downward or moves sideways, and the consolidation phase usually occurs within two parallel trendlines, creating a rectangle or slight downward channel.
How to trade it?
Before entering a position, wait for the price to break above the downsloping trendline and establish a higher high. If the price doesn’t make a higher high, it could be a fake-out. Once a higher high is confirmed, look for an entry on the retracement. The target is typically the length of the flagpole projected upward from the breakout point.
Bullish pennant
A bullish pennant is a continuation pattern that indicates the potential for a price to continue its upward trend after a brief consolidation. It forms when a strong upward move (the flagpole) is followed by a period of consolidation, where the price moves within converging trendlines, creating a small symmetrical triangle or pennant shape. The consolidation typically shows lower highs and higher lows, and the pattern suggests that the market is taking a "breather" before continuing its upward momentum.
How to trade it?
Before entering a position, wait for the price to break above the downsloping trendline and establish a higher high. If the price doesn’t make a higher high, it could be a fake-out. Once a higher high is confirmed, look for an entry on the retracement. The target is typically the length of the flagpole projected upward form the breakout point.
Ascending triangle
An ascending triangle is a bullish continuation pattern that typically forms during an uptrend, signaling that the price is likely to continue moving higher.
It is characterized by a horizontal resistance line at the top, formed by a series of peaks at roughly the same price level, and an ascending support line at the bottom, formed by higher lows. This creates a triangle shape, where the price is gradually compressing between the horizontal resistance and the rising support.
How to trade it?
Before entering a position, wait for the price to break above the horizontal resistance level with strong volume. Once the breakout occurs, look for an entry on the retracement back to this area.
-------------------------------
Bearish continuation patterns
Bearflag
A bear flag is a bearish continuation pattern that suggests the price is likely to continue moving downward after a brief consolidation or upward pullback.
It forms when there is a strong downward move (the flagpole), followed by a period of consolidation or slight upward movement (the flag). The flag typically slopes upward or moves sideways, and the consolidation occurs within two parallel trendlines, creating a rectangular or upward-sloping channel. This pattern shows that, despite the short-term pullback, the overall downtrend remains intact.
How to trade it?
Before entering a position, wait for the price to break below the upsloping trendline and establish a lower low. If the price doesn’t make a lower low, it could be a fake-out. Once a lower low is confirmed, look for an entry on the retracement. The target is typically the length of the flagpole projected downward for the breakout point.
Bearish pennant
A bearish pennant is a bearish continuation pattern that signals a potential continuation of a downtrend after a brief consolidation.
It forms when there is a strong downward move (the flagpole), followed by a period of consolidation where the price moves within converging trendlines, creating a small symmetrical triangle or pennant shape. The consolidation typically shows lower highs and higher lows, indicating that the price is taking a pause before continuing its downward movement.
How to trade it?
Before entering a position, wait for the price to break below the upsloping trendline and establish a lower low. If the price doesn’t make a lower low, it could be a fake-out. Once a lower low is confirmed, look for an entry on the retracement. The target is typically the length of the flagpole projected downward for the breakout point.
Descending triangle
A descending triangle is a bearish continuation pattern that typically forms during a downtrend, indicating that the price is likely to continue moving lower after a period of consolidation.
The pattern is characterized by a horizontal support line at the bottom, formed by a series of lows at approximately the same price level, and a descending resistance line at the top, formed by a series of lower highs. The price contracts between these two trendlines, creating a triangle shape with a downward-sloping upper boundary and a flat lower boundary.
How to trade it?
Before entering a position, wait for the price to break below the horizontal support level with strong volume. Once the breakout occurs, look for an entry on the retracement back to this area.
-------------------------------
Thanks for your support.
- Make sure to follow me so you don't miss out on the next analysis!
- Drop a like and leave a comment!

Fall Down to $70 ApproachingWith the RSI above average since mid-April 2025, the trend has been steadily rising up to $82 per share even breaking the highs from late February and March.
Price projected onto both (A and B) Inside pitchforks is well above the median line. In the pitchfork A the price is even directly touching the upper parallel line.
Reversal near the highest achieved price this year on 21st February is probable
Based on these indications, we can expect a fall to around $70 somewhere in the middle of May.
Key details:
RSI over "overbought" level
Price in both Inside pitchforks near the upper parallel line
Longer uptrend = breakdown necessary

XUAUSD SETUP: Long position I'm looking forward for the market to grab Liquidity below the Low Of The Week .After the market grabs the liquidity below , I'm anticipating a long position to break the high of the previous week.

ONE/USDT - Harmoney - 4th Uptrend is just startingBINANCE:ONEUSDT (1W CHART) Technical Analysis Update
ONE is currently trading at $0.01121 and showing overall bullish sentiment
if we look at the past chart, we see ranging market for ONE from past 2 years, the price has hit the accumulation zone and reversing from the zone.
In the past 3 times we saw significant increase in price after hitting the support zone, and we expecting similar move this time.
Entry level: $ 0.01121
Stop Loss Level: $ 0.00765
TakeProfit 1: $ 0.01368
TakeProfit 2: $ 0.01855
TakeProfit 3: $ 0.02727
TakeProfit 4: $ 0.03795
TakeProfit 5: $ 0.05691
Max Leverage: 2x
Position Size: 1% of capital
Remember to set your stop loss.
Follow our TradingView account for more technical analysis updates. | Like, share, and comment your thoughts.
Cheers
GreenCrypto

LanzaTech (LNZA). Extremely oversold! Rally incoming?NASDAQ: LanzaTech (LNZA) , based in Illinois, USA, has recently has seen a price low of $0.1401 . This waste management company in recent times, has been featured as a top pick for buys by various news outlets. Although in an extremely bearish slump, I have a bullish prediction.
In the technicals on the 1 Day Chart , the RSI appears to be indicating oversold , with a slight potential of more of a dip to come. The Stochastic seems to also be indicating oversold market conditions. A long time frame bullish RSI divergence also appears to be forming starting at the middle of Feb 2023.
LanzaTech recently declined a "lowball" offer for $0.02 a share, which could signal insider bullish sentiment. LanzaTech FY25 Q1 earnings are forecasted to be significantly higher than FY24 Q4 at this time (RH). Their website, marketing and twitter appear to show no real signs of slowing business operations in my opinion.
Analysis also appears shows that there is very little open interest on put options at this time. Conversely there seems to be a large number of call options from $1-$7 expiring in the near future signaling institutions and high profile traders may be entering the market quietly.
Given the above signals and analysis I personally am setting a speculative stretch price target of $7 with various other orders taking profit along the way at key strike price cluster levels. With LanzaTech at a discounted price, a buy now could yield significant results.
Anything can happen in the markets. What do you think? Will LanzaTech recover? Or will value become completely wiped out?
Disclaimer: Not Financial Advice

USDT.D Bearish Reversal Incoming Into a New Bullish Phase in BTCUSDT.D Update:
Its been a while since my last USDT.D update on here since i accurately forecasted and called the top in September last year from its last distribution range. Since then, Ive been expecting USDT.D and USDC.D to continue higher into deeper premiums and into monthly and 3M supply areas, taking further BSL in the process and coming into the HTF downtrend channel high, whilst the rest of the market continued bearish after the first moves from last year.
Both have done just that, pushing higher to extreme supply and heavy premium pricing. USDT.D has topped out with high volume as it come into refined extreme daily supply from the UT event in the prior distribution range, whilst taking the LQ at the 5.93% level i discussed in the market update videos. This is effectively following last points of supply from one distribution range to the next, following HTF bearish orderflow and HTF bearish structure in stablecoin dominance pairs. From the recent UTAD event we have seen bearish breakdowns on the daily timeframe on both USDT.D and and USDC.D, marking a turn in the market where things should start to get more interesting! Im looking for this again but on the weekly timeframe and monitoring for a HTF weekly close below the weekly HL, therefore putting in a LL on the weekly to give further HTF confirmations of the reversal from this area.
Whats interesting at this point is the last couple days of data on both USDT.D and USDC.D and the range conditions we are now creating.
For me, it looks pretty similar to the last top, where we created a distribution range in HTF supply after taking extreme key levels and LQ, putting the market in extreme fear, before slowly flipping bearish in the range before a full blown reversal and breakdown to the 3.73% level.
Im expecting a bounce of some degree over the next week or so in USDT.D back into the 5.57% region where the range high sits alongside some daily and refined 12H supply zones from the UTAD event. Im looking for a push into supply forming a LPSY last point of supply in phase D, before continuing HTF bearish to target SSL on the lows of this upward trend channel with my main targets between 3.73% and 3.12%. This aligns with what im seeing in BTC as posted today on TradingView and the market, expecting a pullback to demand respectively before continued upside.
I don't for see this taking the highs again above 6.24%. There is a lot of resistance and supply in this range now we have broke down and its likely we are seeing the formation of the reversal taking shape in due course.
As ive stated i the most recent BTC analysis, this is a risk on situation in my opinion and i will be allocating capital to spot bags as USDT.D hits its supply levels in the range highs and as BTC comes into the daily demand levels im monitoring between $84,000 - $76,500, buying the dip whilst expecting further upside and a HL to form in BTC and new LHs in stablecoin dominance pairs.
To finish, look at this chart on the daily, 2D, 3D, 4D, 5D, 1W, 2W, 3W charts and really look at the HTF closes on these candles at these highs. Theres been no HTF bullish closes above HTF supply or significant highs. Price has failed to put in new higher highs and is merely sweeping highs now with high volume rejections, volume dropping off, all whilst looking like a top imo with HTF weekly rejections all the way up to the monthly candle.
1D:
3D:https://www.tradingview.com/x/XtxjrvGR/
1W:
1M:

BTC on the verge of another accumulation range breakoutMorning all! So its time for a proper set of markups having spent the last few months breaking down the charts in video format for you all.
The last BTC update I gave was on 24/03, in the 4 year cycle analysis breakdown. In that video i was expecting lower pricing into SSL and the range lows once more, forming a bottoming structure before seeing a HTF bullish reversal come through, aligning with the 4 year cycle where we have time to continue higher based on past cycle data and where we are in the current cycle.
A month later and we have seen that come through wonderfully after the sweep of the range lows and its time to reanalyse now the direction is changing....
BTC has formed another accumulation range down in these discounted levels over the last couple months and there was nothing really interesting taking shape until the last couple of days thats give us some real confirmation of a trend change in this accumulation range that we can now work with. Unlike the August 2024 bottom, there isnt a massive influx of volume on the sweep event. I was able to call the bottom after such a sweep and high volume event back then just days after but in this most recent range we havent seen volume like back in August 2024, so ive had to be more cautious of further downside until we get some market shift confirmations to confirm intent and be on the safer side here whilst still holding my HTF bias of new ATHs before cycle end.
As shown on the charts, ive marked up the range and stages. We have carried out the sellers climax event, forming the range low, into the automatic rally (AR) forming the range high, moving into the secondary test (ST) with a failure swing back to the lows which forms the secondary test in phase B. From there we continued to range before putting in another range low deviation in the Spring event, with tests of the range low before seeing this explosive move come through from the spring event back to the range highs.
Volume also supports price action with a high influx of volume on the sellers climax low, stopping the prior trend, decreasing volume in the range into supply with a further increase in buyer volume as we deviate the lows in the spring event.
We have also broke structure bullish in the range and formed a HH, with a HL yet to be formed....
**So whats next? **
It seems a lot more clear now after the last couple days, and also confirms intent behind the range and i think its safe to say we have formed a bottom here and my focus is now on the upside on BTC from here. After this range high deviation into supply, in this new HH, i wouldn't be surprised to see BTC pull back to the midpoint of the range between $84,000 - $76,500, back into demand and form a last point of support/demand in the accumulation range forming a HL, before another leg higher as shown.
With how price has set up, with the demand left behind in the range and the bullish intent, my focus is on BTC forming a HL from demand before a continuation higher in line with my HTF bias that we will see new ATHs again before the cycle end. This is also supported in what im seeing on USDT.D and USDC.D where they are distributing in their ranges in supply with breakdowns in both and moving to a bearish trend.
Therefore, when price corrects into these levels i will be looking to allocate risk into the market during the discount of the HL and I will be looking for my buys on DOGE and any other opportunities, where im expecting higher lows in the market before continuations higher across the board. This doesnt mean everything though as many alts are yet to catch up and flip bullish, so my focus will be on the higher quality, stronger coins such as DOGE, but i expect the rest of the market to catch up eventually as BTC runs higher from these lows.
1D:
3D:
1W:
1M:

ADA 1-Year EMA Reclaim and Reversal (1D)After a double bottom at ~$0.50, BINANCE:ADAUSDT reclaimed the 1-year EMA (red) with a ~+9% large bodied daily candle, potentially shifting back to a bullish bias.
Key Levels to Watch
• $0.50-$0.58: Current support, a break below it would invalidate any bullish setup.
• $0.73-$0.77: Current resistance, 0.236 fib extension, HVN, and key S/R in place since February 2022. This is the most crucial level that the bulls need to reclaim.
• $1.10-$1.30: Main supply zone, with significant weekly and daily sell order blocks, plus 0.618 fib extension.
A daily close above above $0.77 would offer a good chance at retesting 2024's highs.
