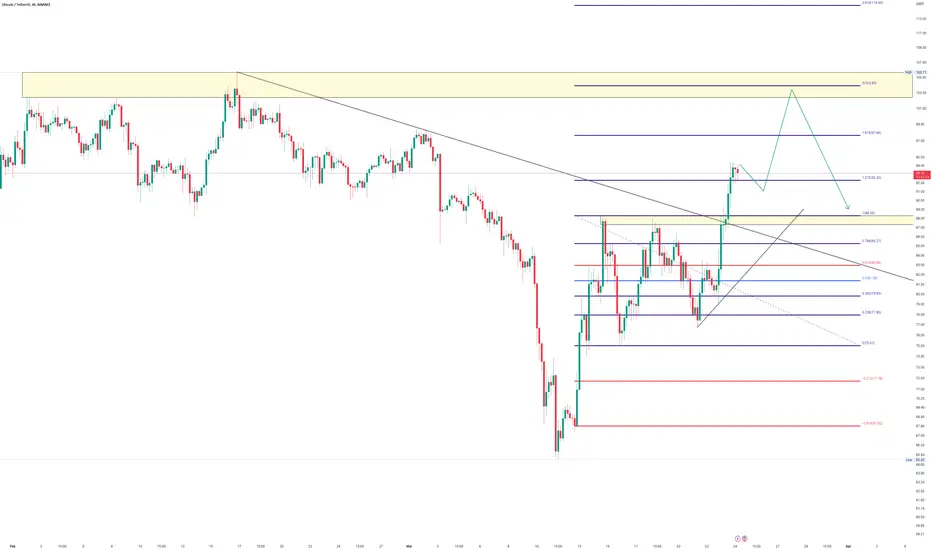
Target around 105 before dropBINANCE:LTCUSDT is going up to 105
Good point to join around 88
Wait and see
Reversal
TSLA close analysis, 3/23/2023 -- Will it be an island?!I've been tracking a TSLA long term short from a prior idea and was greedy expecting price to trace back to 150 levels. With the bearish nature of the past couple day's moves, a gap down creating an island is just what the doctor ordered for TSLA to continue its downward path.
TLDR Open gap down I’m super bearish. Continue to range in this 190+ zone I will continue to hedge long.

Btcusd : Bitcoin sharp price actionBINANCE:BTCUSDT
Hi trader's , Bitcoin after yesterday fed news of interest rate
Price went down with immense pressure and hit 50 ema of 4hr
50 ema support's the buyer's and price went up sharply again
price trading around daily resistance , if candle of daily closes below 28350 than u can see a downtrend for next few day's
vice versa if candle closes above than u can see upward movement to 30k mark , where major resistance can push market down again
❤️ Please, support my work with follow ,share and like, thank you! ❤️

ASIA: GBPCAD - BOBBI/REVERSAL - MOMENTUMBreak out break back in with momentum shift. Failure to make new high and broken trend line. Lets see if it plays out

GBPCAD - Video Top-Down Analysis!Hello TradingView Family / Fellow Traders. This is Richard, also known as theSignalyst.
Here is a detailed update top-down analysis for GBPCAD .
Which scenario do you think is more likely to happen? and Why?
Always follow your trading plan regarding entry, risk management, and trade management.
Good Luck!.
All Strategies Are Good; If Managed Properly!
~Rich

buy thangamayl @ 1040.10 currently trading around good demand levels can add more till 1020-1000 Target 1095/1145/1180/1220

NY: USDCHF - REVERSAL - DEPLETIONAll criteria for our playbook reversal setup met and entry using depletion of buyers

GBPUSD - LH/LL & Reversal - ShortGBPUSD - LH/LL & Reversal - Short
I've entered a short position on GBP\USD after completing multi-timeframe analysis.
The confluences are:
1. Price has broken below the 50 EMA on multiple timeframes.
2. We are now forming lower highs and lower lows on multiple timeframes
3. Overall on the higher timeframes (D/4H), we are starting to look bearish

ASIA: XAUUSD REVERSAL - MOMENTUMAsia has given us a reversal setup right out the play book! All criteria met = higher probabilities :)
Going for at least 2R

BTC Detailed Top-Down Analysis - Day 142Hello TradingView Family / Fellow Traders. This is Richard Nasr, also known as theSignalyst.
I truly appreciate your continuous support everyone!
Let me know if you like the series, and if you would like me to change or add anything.
Always follow your trading plan regarding entry, risk management, and trade management.
Good Luck!.
All Strategies Are Good; If Managed Properly!
~Rich

#Bund market is completing a falling wedge #reversal patternJust wanted to highlight the falling wedge pattern on the bund (#reversal) that we noted on Friday will complete on a close above 137.25, however given the move this morning we will just go with it. It offers an approximate 147 upside measured target.
Near term #resistance is 140.63/85 - the 23.6% retracement of the move down from December 2021, the June 2022 low and the January 2023 high.
#markets #trading #investing #technicalanalysis
Disclaimer:
The information posted on Trading View is for informative purposes and is not intended to constitute advice in any form, including but not limited to investment, accounting, tax, legal or regulatory advice. The information therefore has no regard to the specific investment objectives, financial situation or particular needs of any specific recipient. Opinions expressed are our current opinions as of the date appearing on Trading View only. All illustrations, forecasts or hypothetical data are for illustrative purposes only. The Society of Technical Analysts Ltd does not make representation that the information provided is appropriate for use in all jurisdictions or by all Investors or other potential Investors. Parties are therefore responsible for compliance with applicable local laws and regulations. The Society of Technical Analysts will not be held liable for any loss or damage resulting directly or indirectly from the use of any information on this site.

ASIA: EURCAD - REVERSAL - MOMENTUMEurCad has completed our reversal setup criteria and we should be able to capitalize on at least double the risk. Its in a fib ext zone and has also completed our beloved ABCD pattern so.. Lets see

Analysis of HK50 Index on the Four-Hour Time FrameThe HK50 Index has recently given a breakout above the trend line on the four-hour time frame, indicating a potential upward trend. The index has broken several previous highs and is now taking support to continue its ascent.
Traders looking to enter the market can consider a long position, taking advantage of the current support level for a potential uptrend. However, it is important to closely monitor the market and exit the position if the index shows signs of a reversal.
Keywords: HK50 Index, breakout, trend line, support, long position, uptrend, reversal.
Thanks & regards,
Alpha Trading Station
Disclaimer: This view is for educational purpose only & any stock mentioned here should not be taken as a trading/investing advice. We may or may not have position in the stocks mentioned here. Please consult your financial advisor before investing. Because Price is the "King of Market

DXY May Be Reversing Back Higher AgainPrimary Chart: DXY Daily Chart with Upward Trendline, Downward Trendline and Fibonacci Levels
Dollar strength starting in early 2021 lasted until the fall of 2022. It was nothing short of impressive. But DXY (the dollar measured against a basket of five other major currencies) started topping in September 2022 and then began making lower lows and lower highs, the very definition of a downtrend.
Technical evidence shows that DXY may be reversing higher. Interestingly, it is reversing higher right at key support shown by the dark purple line at 101.29. No one knows whether DXY will return to all-time highs or whether it will fail at one of the many technical obstacles presented on the Primary Chart above. But one can extrapolate from the technicals that a significant reversal has taken place in the dollar. This may lead to multi-week or multi-month strength, or it may lead to a choppy price action that retraces some portion of the downtrend since September 2022 (see Fibonacci levels above) or creates an sideways choppy range for some time.
The main technical points concerning this reversal follow:
DXY was in primary-degree uptrend since May 2021, and this ended at a high of $114.77 in September 2022. Note the yellow uptrend line that dates back to the May 2021 lows.
After reaching its high in September 2022, DXY began forming lower highs and lower lows. This started with a trading range that lasted for some time indicated by the teal rectangle covering price action from September to November 2022. This area forms an area of major resistance that could likely be reached as part of a backtest of this range or a move to new multi-year highs.
The 8-hour DXY chart shows the Bollinger Bands' jaws opening (2 standard deviations) indicating an expansion of volatility consistent with the start of a new trend. Price is now walking the bands, a sign of strength and momentum sufficient to continue the start of a new trend. This technical feature should soon translate to the Bollinger Bands on a daily chart, which still show compression. Price first pierced the lower Bollinger Band, which is a fakeout that is not uncommon just before a breakout after a volatility squeeze (shown by compression in the bands). See Supplementary Chart A below.
Supplementary Chart A
The first (most conservative) target is a backtest of the yellow uptrend line from May 2021. That lies around $103.60 to $104.50 in the next few days.
If the yellow uptrend line is reclaimed, that will be a further bullish development that will likely lead to a significant retracement of the decline from September 2022. In this case, the second conservative target is $106.15, which coincides with the 38.2% Fibonacci retracement of this multi-month decline.
The third target is the 50% retracement at $107.80, and it is reasonable to expect if the yellow uptrend line is reclaimed.
The final target is the 61.8% Fibonacci retracement at $109.44, and this is also valid target if the yellow uptrend line is reclaimed. This level coincides with major resistance (formerly support) at the base of the trading range that developed as DXY was topping in September - early November 2022.
One could make a bold prediction (bearish on risk assets) that the dollar is heading back to new all-time highs. Or one could say that risk assets will continue to rise to new all-time highs so this move in the dollar will be short-lived. These are both rooted in a biased idea of how DXY and SPX / NDX correlate and should move in the intermediate term. Rather than making bold predictions from a clear reversal in DXY, it helps to remain open to the price action and how it unfolds. We can recognize the reversal for what it is and what it implies without the need to become mired in tenuous predictions about whether DXY is returning to new all time highs. If price recovers the .618 retracement, the odds rise dramatically for new all-time highs. But until then, we can expect dollar strength based on the reversal patterns discussed. And the Fibonacci retracements are not unreasonable targets to expect in the coming weeks and months.
Lastly, consider that the dollar remains in an uptrend that has existed even longer than the one since May 2021. This is the 15-year uptrend represented in the Supplementary Charts B.1 and B.2 below. The yellow line on the Primary Chart only represents a rate of trend that has existed for a little more than 1.5 years, but this trend has occurred within an even larger degree uptrend in place since about 2008.
Supplementary Chart B.1
Supplementary Chart B.2
Thank you for reading and considering these charts!
________________________________________
Author's Comment: Thank you for reviewing this post and considering its charts and analysis. The author welcomes comments, discussion and debate (respectfully presented) in the comment section. Shared charts are especially helpful to support any opposing or alternative view. This article is intended to present an unbiased, technical view of the security or tradable risk asset discussed.
Please note further that this technical-analysis viewpoint is short-term in nature. This is not a trade recommendation but a technical-analysis overview and commentary with levels to watch for the near term. This technical-analysis viewpoint could change at a moment's notice should price move beyond a level of invalidation. Further, proper risk-management techniques are vital to trading success. And countertrend or mean-reversion trading, e.g., trading a rally in a bear market, is lower probability and is tricky and challenging even for the most experienced traders.
DISCLAIMER: This post contains commentary published solely for educational and informational purposes. This post's content (and any content available through links in this post) and its views do not constitute financial advice or an investment or trading recommendation, and they do not account for readers' personal financial circumstances, or their investing or trading objectives, time frame, and risk tolerance. Readers should perform their own due diligence, and consult a qualified financial adviser or other investment / financial professional before entering any trade, investment or other transaction.

Pay attention to the downtrend on the #BundA significant loss of downside momentum depicted by the #divergence of the weekly and month #RSI AND a potential falling wedge suggests that market should be closely monitored for signs of #reversal.
#fixedincome #technicalanalysis #trading #investing
Disclaimer:
The information posted on Trading View is for informative purposes and is not intended to constitute advice in any form, including but not limited to investment, accounting, tax, legal or regulatory advice. The information therefore has no regard to the specific investment objectives, financial situation or particular needs of any specific recipient. Opinions expressed are our current opinions as of the date appearing on Trading View only. All illustrations, forecasts or hypothetical data are for illustrative purposes only. The Society of Technical Analysts Ltd does not make representation that the information provided is appropriate for use in all jurisdictions or by all Investors or other potential Investors. Parties are therefore responsible for compliance with applicable local laws and regulations. The Society of Technical Analysts will not be held liable for any loss or damage resulting directly or indirectly from the use of any information on this site.

ROKU ROKU - Where Are You? 🔍 Analysis #32/50Hello TradingView Family / Fellow Traders. This is Richard, also known as theSignalyst.
on WEEKLY: Left Chart
ROKU is stuck inside a range around support and round number 50.0 so we will be looking for buy setups on lower timeframes.
on DAILY: Right Chart
🏹 For the bulls to take over, we need a momentum candle close above the last major high in gray around 75.0
Meanwhile, until the buy is activated, ROKU can still trade lower till the 50 support again.
📚 Always follow your trading plan regarding entry, risk management, and trade management.
Good luck!
All Strategies Are Good; If Managed Properly!
~Rich
