DXY 96.07 - 0.74% SHORT IDEA * PRICE ACTION & REVERSAL PTTNS HEY EVERYONE
HOPE EVERYONE IS DOING GOOD HAVING A GOOD ONE
SOME OPPORTUNITIES THIS WEEK.
LOOKING AT THE DOLLAR INDEX
* The index has been trading in a bullish trend that lost momentum as we enter a reversal pattern that is now range-bound within the support & resistance .
* Looking for a double bottom formation within this range unless we see a breakout or changes in momentum.
* looking for reversals in the form of a double bottom, should we see continuation with the bulls, the plan changes.
ON THE HOULRY CHART - We are within a descending structure that could support that double bottom.
- looking for shorts on the dollar index , a break above changes the whole plan.
lets see how it goes
IF THIS IDEA ASSISTS IN ANY OR IF YOU LIKE THIS ONE
SMASH THAT LIKE BUTTON & LEAVE A COMMENT.
ALWAYS APPRECIATED
____________________________________________________________________________________________________________________
* Kindly follow your entry rules on entries & stops. |* Some of The idea's may be predictive yet are not financial advice or signals. | *Trading plans can change at anytime reactive to the market. | * Many stars must align with the plan before executing the trade, kindly follow your rules & RISK MANAGEMENT.
_____________________________________________________________________________________________________________________
| * ENTRY & SL -KINDLY FOLLOW YOUR RULES | * RISK-MANAGEMENT | *PERIOD - SWING TRADE
Reversalpattern

USDZAR 14.96170 + 0.24 % LONG IDEA * REVERSAL PATTERNS,BREAKOUT HEY EVERYONE
HOPE EVERYONE IS DOING GOOD HAVING A GOOD ONE.
NEW WEEK, NEW OPPORTUNITIES.
LOOKING AT THE DOLLAR / ZAR
* The PAIR has been trading in a descending channel just tested the BASE of this structure ENTERING a range as we see momentum to the down side slow down somewhat.
- Short term the pair is currently rejecting at this structure possibly signaling a change in momentum on the 4h chart this,the delay at this level might just be the signal that we might be changing direction towards the bulls..
- Looking for long entries on the THE DOLLAR ZAR this week should all the rules of the formation be met.
LOOKING FOR A BREAKOUT ON LOWER TIME-FRAMES AND POSSIBLY SIGNS OF BULLISH MOMENTUM
lets see how it goes
IF THIS IDEA ASSISTS IN ANY OR IF YOU LIKE THIS ONE
SMASH THAT LIKE BUTTON & LEAVE A COMMENT.
ALWAYS APPRECIATED
____________________________________________________________________________________________________________________
* Kindly follow your entry rules on entries & stops. |* Some of The idea's may be predictive yet are not financial advice or signals. | *Trading plans can change at anytime reactive to the market. | * Many stars must align with the plan before executing the trade, kindly follow your rules & RISK MANAGEMENT.
_____________________________________________________________________________________________________________________
| * ENTRY & SL -KINDLY FOLLOW YOUR RULES | * RISK-MANAGEMENT | *PERIOD - SWING TRADE

GBPUSD 1.31632 - 0.1 % LONG IDEA * PRICE ACTION & STRUCTURE HELLO EVERYONE
HOPE EVERYONE IS DOING GOOD HAVING A GOOD ONE.
NEW WEEK, NEW OPPORTUNITIES.
AS FED CHAIR POWELL GIVES HIS SPEECH SEEING SOME STREGHTH INJECTED INTO THE DOLLAR, HERE'S A LOOK AT THE POUND / DOLLAR
* The PAIR has been on a build up or rather formation of a beautiful text book H&S formation, A break of structure possibly signals continuation to the up-side.
- Short term the pair is in a down trend on the 4h chart this should it respect structure looking for continuation towards the upside.
- Looking for long entries on the THE PAIR this week should all the rules of the formation be met as I sit on my hands on this one and await that break-out SEE CHART BELOW.
lets see how it goes
IF THIS IDEA ASSISTS IN ANY OR IF YOU LIKE THIS ONE
SMASH THAT LIKE BUTTON & LEAVE A COMMENT.
ALWAYS APPRECIATED
____________________________________________________________________________________________________________________
* Kindly follow your entry rules on entries & stops. |* Some of The idea's may be predictive yet are not financial advice or signals. | *Trading plans can change at anytime reactive to the market. | * Many stars must align with the plan before executing the trade, kindly follow your rules & RISK MANAGEMENT.
_____________________________________________________________________________________________________________________
| * ENTRY & SL -KINDLY FOLLOW YOUR RULES | * RISK-MANAGEMENT | *PERIOD - SWING TRADE

USD / JPY 119.389 +0.19 % SHORT IDEA * TREND POSSIBLE REVERSALHELLO EVERYONE
HOPE EVERYONE IS DOING GOOD HAVING A GOOD ONE.
NEW WEEK, NEW OPPORTUNITIES.
LOOKING AT THE DOLLAR / YEN
* The PAIR has been trading in a Ascending channel , just tested the roof of this structure after that extending this move with a strong bullish rally towards the upside.
- Short term the pair is in a up trend on lower time-frames as we see break aboves even on the 4h chart this.
- Looking for short entries on the THE PAIR this week should all the rules of the formation be met, reversal patterns at that looking for any reversal patterns.
BREAK ABOVE AND BULLISH MOMENTUM INVALIDATES THE SET UP.
SCALLING LOWER HERE'S WHAT WE HAVE
lets see how it goes
IF THIS IDEA ASSISTS IN ANY OR IF YOU LIKE THIS ONE
SMASH THAT LIKE BUTTON & LEAVE A COMMENT.
ALWAYS APPRECIATED
____________________________________________________________________________________________________________________
* Kindly follow your entry rules on entries & stops. |* Some of The idea's may be predictive yet are not financial advice or signals. | *Trading plans can change at anytime reactive to the market. | * Many stars must align with the plan before executing the trade, kindly follow your rules & RISK MANAGEMENT.
_____________________________________________________________________________________________________________________
| * ENTRY & SL -KINDLY FOLLOW YOUR RULES | * RISK-MANAGEMENT | *PERIOD - SWING TRADE

AUD / USD 0.73992 -0.2 % SHORT IDEA * REVERSAL PATTERNSHELLO EVERYONE
HOPE EVERYONE IS DOING GOOD HAVING A GOOD ONE.
NEW WEEK, NEW OPPORTUNITIES.
LOOKING AT THE AUD / DOLLAR
* The PAIR has been trading in a Ascending channel , just tested the roof of this structure NOW seems the bears will be in control with the formation of the double top anticipating a reversal.
- Short term the pair is in a up trend on lower time-frames as we see break above's even on the 4h chart this.
- Looking for short entries on the THE PAIR this week should all the rules of the formation be met.
BREAK ABOVE AND BULLISH MOMENTUM INVALIDATES THE SET UP.
scaling down
lets see how it goes
IF THIS IDEA ASSISTS IN ANY OR IF YOU LIKE THIS ONE
SMASH THAT LIKE BUTTON & LEAVE A COMMENT.
ALWAYS APPRECIATED
____________________________________________________________________________________________________________________
* Kindly follow your entry rules on entries & stops. |* Some of The idea's may be predictive yet are not financial advice or signals. | *Trading plans can change at anytime reactive to the market. | * Many stars must align with the plan before executing the trade, kindly follow your rules & RISK MANAGEMENT.
_____________________________________________________________________________________________________________________
| * ENTRY & SL -KINDLY FOLLOW YOUR RULES | * RISK-MANAGEMENT | *PERIOD - SWING TRADE

GBPUSD | Live position review | Follow-up detailsGBPUSD positions appear to be doing well at the moment as we currently experience over 70pips moving in our direction. But it's not yet a tangible reason to be excited as the current structure needs confirmation in the form of a retest/rejection of neckline @ 1.32 to the upside to seal the uptrend continuation. See my previous video on this for further details (see link below)
Risk Disclaimer:
Margin trading in the foreign exchange market (including commodity trading, CFDs, stocks etc.) has a high risk and is not suitable for all investors. The content of this speculation (including all data) is organized and published by me for the sole purpose of education and assistance in making independent investment decisions. All information herein is for your reference only and I take no responsibility.
You are hereby advised to carefully consider your investment experience, financial situation, investment objective, risk tolerance level, and consult your independent financial adviser as to the suitability of your situation prior to making any investment.
I do not guarantee its accuracy and is not liable for any loss or damage which may result directly or indirectly from such content or the receipt of any instruction or notification therewith.
Past performance is not necessarily indicative of future results.

GBPCAD | Live position reviewEven though this was not part of my plan for the week; the identification of a reversal structure within a strong demand zone on a weekly time frame incited a call for attention.
Risk Disclaimer:
Margin trading in the foreign exchange market (including commodity trading, CFDs, stocks etc.) has a high risk and is not suitable for all investors. The content of this speculation (including all data) is organized and published by me for the sole purpose of education and assistance in making independent investment decisions. All information herein is for your reference only and I take no responsibility.
You are hereby advised to carefully consider your investment experience, financial situation, investment objective, risk tolerance level, and consult your independent financial adviser as to the suitability of your situation prior to making any investment.
I do not guarantee its accuracy and is not liable for any loss or damage which may result directly or indirectly from such content or the receipt of any instruction or notification therewith.
Past performance is not necessarily indicative of future results.

XAUUSD | Live position reviewThis is a follow-up detail of the video I published on this pair during the weekend (see link below for reference purposes).
Risk Disclaimer:
Margin trading in the foreign exchange market (including commodity trading, CFDs, stocks etc.) has a high risk and is not suitable for all investors. The content of this speculation (including all data) is organized and published by me for the sole purpose of education and assistance in making independent investment decisions. All information herein is for your reference only and I take no responsibility.
You are hereby advised to carefully consider your investment experience, financial situation, investment objective, risk tolerance level, and consult your independent financial adviser as to the suitability of your situation prior to making any investment.
I do not guarantee its accuracy and is not liable for any loss or damage which may result directly or indirectly from such content or the receipt of any instruction or notification therewith.
Past performance is not necessarily indicative of future results.

GBPUSD | Perspective for the new weekA reversal pattern was identified on the 4H time frame as the pound appears to have bounced up to erase previous losses in recent time.
Tendency: Uptrend (Bullish)
Structure: Supply & Demand | Trendline | Reversal pattern (Inverse Head and Shoulder)
NB: This speculation might be considered to make individual decisions on the lower timeframe.
Watch this space for updates as price action is been monitored.
Risk Disclaimer:
Margin trading in the foreign exchange market (including commodity trading, CFDs, stocks etc.) has a high risk and is not suitable for all investors. The content of this speculation (including all data) is organized and published by me for the sole purpose of education and assistance in making independent investment decisions. All information herein is for your reference only and I take no responsibility.
You are hereby advised to carefully consider your investment experience, financial situation, investment objective, risk tolerance level, and consult your independent financial adviser as to the suitability of your situation prior to making any investment.
I do not guarantee its accuracy and is not liable for any loss or damage which may result directly or indirectly from such content or the receipt of any instruction or notification therewith.
Past performance is not necessarily indicative of future results.

EURUSD | Perspective for the new weekThis is my first video tutorial and I am not sure I am good at this but let me know if the video tutorial is preferable. Thank you
Tendency: Uptrend (Bullish)/ Downtrend (Bearish)
Structure: Supply & Demand | Trendline
NB: This speculation might be considered to make individual decisions on the lower timeframe.
Watch this space for updates as price action is been monitored.
Risk Disclaimer:
Margin trading in the foreign exchange market (including commodity trading, CFDs, stocks etc.) has a high risk and is not suitable for all investors. The content of this speculation (including all data) is organized and published by me for the sole purpose of education and assistance in making independent investment decisions. All information herein is for your reference only and I take no responsibility.
You are hereby advised to carefully consider your investment experience, financial situation, investment objective, risk tolerance level, and consult your independent financial adviser as to the suitability of your situation prior to making any investment.
I do not guarantee its accuracy and is not liable for any loss or damage which may result directly or indirectly from such content or the receipt of any instruction or notification therewith.
Past performance is not necessarily indicative of future results.

SPX: Doing many technical movements!Hello traders and investors! Let’s see how the SPX is doing today!
First, in the 1h chart, it did exactly what we said yesterday (link to my last analysis below this post), and retested the 21 ema before bouncing back up again. This movement was very technical and expected, and now it is just resuming the bull trend one more time.
Since the momentum is bullish in the short-term, as we see clear higher highs/lows, pullbacks to the 21 ema are opportunities to buy. Either way, the next targets are the resistances seen on the chart: The 4,416, the previous top, and the 4,472, the breakaway gap.
In the daily chart the situation is still dangerous, but the index is trying to break this purple line, and by doing this, it’ll do something new, indicating a possible mid-term reversal sign.
The volume is good (not great, but good), and it looks promising. So far, we don’t see any bearish structure around that could indicate a top level, but let’s keep our eyes open.
I’ll keep you guys update, as usual, so remember to follow me to keep in touch with my analyses!

EURGBP Potential Bearish Reversal, SHORT!The pair has been in an uptrend for a while but as we can see we have recently broke structure to the downside showing that bears are stepping in. In this week i will be looking for a short-term selling opportunity around 0.83838

EURJPY | Perspective for the new weekSince my last publication on this pair (see link below for reference purposes), prices have continued to spiral downwards thereby emphasizing a downtrend momentum as the JY129 area remains the significant level keeping price under. Despite hawkish ECB, the meeting might fail to offer the Euro a lift anytime soon as I suspect that the bears are about to project into the lows in the region of 124.00 area in the coming week(s).
Tendency: Downtrend (Bearish)
Structure: Supply & Demand | Trendline | Reversal pattern (Double Bottom & Breakdown)
Observation: i. Jumping in on our 4H timeframe; it is obvious that price action has continued to find lower lows since the 10th of February 2022.
ii. A visual representation of a trend after connecting a series of prices with a line drawn above pivot highs shows the prevailing direction and speed of price in the last month.
iii. The successful breakdown of the JY129 areas which has held price "supported" since the last quarter of last year emphasizes the seller's power at this juncture in the market.
iv. During the course of last week's trading session, we witness the Euro grow 3.70% against the JPY only to find a significant resistance at the key level (JY129) on Thursday and Friday with a reversal set-up emerging within an area that is peculiar with selling potentials.
v. Now, the appearance of a Double Top structure within the identified Supply zone which also shares a confluence with the bearish trend describes a potential trend continuation if we finally see a breakdown of the Neckline around JY127.5 in the new week.
vi. In as much as anywhere below key level appears to be a comfortable area to sell considering current structure, it is advisable that we hold and wait for a breakdown of neckline to join the potential decline... Trade consciously!😊
Trading plan: SELL confirmation with a minimum potential profit of 350 pips.
Risk/Reward : 1:5
Potential Duration: 4 to 8days
NB: This speculation might be considered to make individual decisions on the lower timeframe.
Watch this space for updates as price action is been monitored... I shall be sharing a video of how I am going to take advantage of this trade if the price goes as planned on my new jou tube channel.
Risk Disclaimer:
Margin trading in the foreign exchange market (including commodity trading, CFDs, stocks etc.) has a high risk and is not suitable for all investors. The content of this speculation (including all data) is organized and published by me for the sole purpose of education and assistance in making independent investment decisions. All information herein is for your reference only and I take no responsibility.
You are hereby advised to carefully consider your investment experience, financial situation, investment objective, risk tolerance level, and consult your independent financial adviser as to the suitability of your situation prior to making any investment.
I do not guarantee its accuracy and is not liable for any loss or damage which may result directly or indirectly from such content or the receipt of any instruction or notification therewith.
Past performance is not necessarily indicative of future results.

US100 13321.4 + +0.44 % LONG IDEA * REVERSAL PATTERNS HEY EVERYONE
HOPE EVERYONE IS DOING GOOD HAVING A GOOD ONE,
A LOOK AT NASDAQ INDEX THIS WEEK SWING
* The index was trading in a DESCENDING channel but seems the channel that saw a break above of structure but failed to continue this momentum towards the upside.
- We finally at that zone which will highly become the reversal point.
- key to the set up will definitely be patience, we already seeing the formation of double bottoms even on higher time-frames which makes this one a high probability trade.
- Looking for long entries on the INDEX this week should all the rules of the formation be met.
- YESTERDAY'S SET UP PLAYED OUT BEAUTIFULLY....
lets see how it goes
IF THIS IDEA ASSISTS IN ANY OR IF YOU LIKE THIS ONE
SMASH THAT LIKE BUTTON & LEAVE A COMMENT.
ALWAYS APPRECIATED
____________________________________________________________________________________________________________________
* Kindly follow your entry rules on entries & stops. |* Some of The idea's may be predictive yet are not financial advice or signals. | *Trading plans can change at anytime reactive to the market. | * Many stars must align with the plan before executing the trade, kindly follow your rules & RISK MANAGEMENT.
_____________________________________________________________________________________________________________________
| * ENTRY & SL -KINDLY FOLLOW YOUR RULES | * RISK-MANAGEMENT | *PERIOD - SWING TRAD

XAUUD: Gold Sees Over $125 In Bearish CorrectionBased on my continued and careful analysis of Gold, I believe that Bears are due to strike for a drop towards the levels of $1845
.
Don't drown. Join the wave.

EUR / USD 1.08814 - 0.44 % LONG IDEA *STRUCTURE & PRICE ACTION HEY EVERYONE
HOPE EVERYONE IS DOING GOOD HAVING A GOOD ONE,
A LOOK AT THE EURO / DOLLAR PAIR.
* The pair has just been falling like plummeted head first for a minute now, finally seeing some momentum shift.
- Finally a reversal pattern may be on the cards on the EUR/USD looking for some bullish momentum to come into play.
- Looking for long entries on the PAIR short term this week should all the rules of the formation be met.
lets see how it goes
IF THIS IDEA ASSISTS IN ANY OR IF YOU LIKE THIS ONE
SMASH THAT LIKE BUTTON & LEAVE A COMMENT.
ALWAYS APPRECIATED
____________________________________________________________________________________________________________________
* Kindly follow your entry rules on entries & stops. |* Some of The idea's may be predictive yet are not financial advice or signals. | *Trading plans can change at anytime reactive to the market. | * Many stars must align with the plan before executing the trade, kindly follow your rules & RISK MANAGEMENT.
_____________________________________________________________________________________________________________________
| * ENTRY & SL -KINDLY FOLLOW YOUR RULES | * RISK-MANAGEMENT | *PERIOD - SWING TRADE

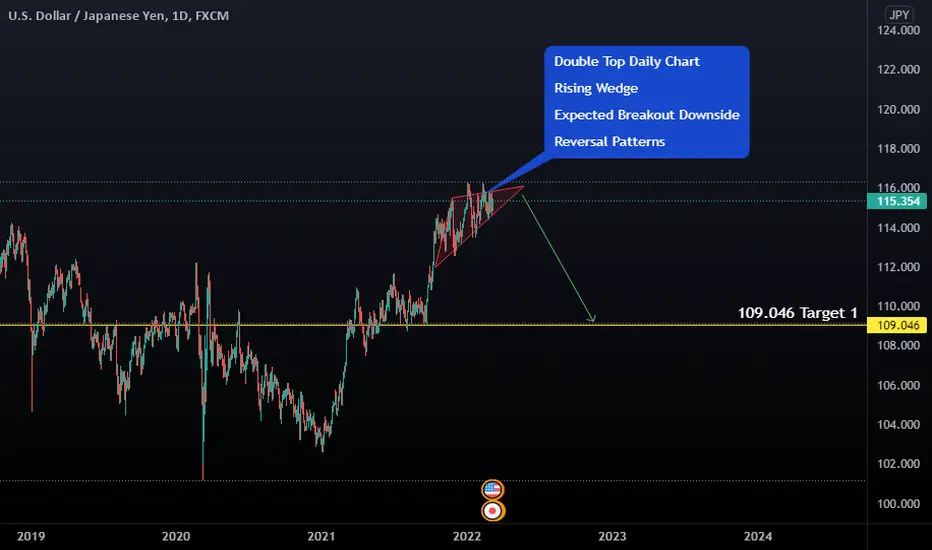
USD JPY Reversal PatternsRising Wedge forming in Apex.
Reversal Pattern back to Support Levels at 110/109
BTC : a risky Long OpportunityBTC Looks like a good zone to long some. we are at the support at the triangle and BTC looks good for some buy. However, Do not forget the market is bearish and stop loss will be Daily candle closing below the support of the triangle. Also remember smart money comes in when people are at fear.

USDCAD False Breakout, SHORT!USDCAD is trading around a major resistance level, I will be looking for a short-term selling opportunity around 1.2750

SOLANA Slope RSI at an extreme pointThere has not been a pattern to confirm the bottom yet and it would be unwise to enter a trade right now but we the indicators are telling me that the bottom has been reached. The honey Cypher VWAP is at a very low point, the previous time it reached this level we got a massive move to the upside. At this point we had a double bottom formation which further increased the likelyhood of a strong trend.
My strategy here is to wait for a reversal pattern to surface and enter a trade with a very small stop loss, -2% with a TP1 5% TP2 10% and a trailing at 3% with -3%. You could also enter a trade the moment a reversal brick get's printed but that is less reliable than the patterns.
Link to the bounded slope oscillator.

ADA/USDTADA/USDT pair seems to be in a Falling Wedge to me, if the current supprt level at around $0.89 breaks I expect the price to go to the lower trendline again. Target at around $0.72 - $0.75 seems realistic to me, IF this scenario plays out. The other scenario I would look at is gaining supprt at the current level and wait for a high Volume breakout confirmation to the upside before entering a long position.
Feel free to give feedback!

CRWD: Complete Trend Analysis + Key Points to watch!Hello traders and investors! Let’s see how CRWD is doing today and do a complete MTFA on it!
In the 1h chart, we see a clear bull trend, and there’s no reversal pattern around. The 21 ema is a technical support, and as long as it keeps above it, there’s no reason to worry. However, we could see a reversal if CRWD loses the red line at $ 190.36.
In addition, as evidenced by the purple line, the previous top is not higher than the previous top, and if it loses the $ 190, the market may see this as a possible Double Top, or as a bearish pivot point.
A pullback on CRWD wouldn’t be that problematic, as in the daily chart we see some good patterns. It is finally breaking the 21 ema again, and it stopped doing lower highs/lows, ending the bear trend for good. What’s more, it triggered a Double Bottom chart pattern above the red line at $ 154.15 (we’ll talk about it later).
This seems to be a nice reversal pattern, and a pullback to the 21 ema is expected, and this wouldn’t ruin the reversal thesis. To be honest, now is the best time for us to see a small pullback on CRWD, just look at the weekly chart:
We just hit the 21 ema in the W chart, and that’s a nice resistance on CRWD. To me, it would be good to see CRWD doing a pullback to its 21 ema in the daily chart, in order to build another bullish structure and trigger a reversal in the weekly chart as well.
Remember the red line at $ 154.15, we can see it from here too. This line was Sep 2020 top, now it is working as a support, and this movement reinforces one of the most important principles of Technical Analysis that I always mention in my analyses: The Principle of Polarity.
CRWD has its challenges, but we see many good signs to work with. Let’s pay attention to the key points mentioned in this analysis. I’ll keep you guys updated on it, so remember to follow me to keep in touch with my future analyses.

BTC-D1-REVERSAL IN PROGRESS...GLOBAL PICTURE
DAILY (D1)
After having reached, yesterday, an intraday high @ 35'332 and nearly achieved a full Fibonacci retracement (former high @ 45'850), the BTC lost momentum and as a result, closed slightly above the middle of the previous white candle which mean, that yesterday's price action, roughly triggered a DARK CLOUD COVER (Bearish warning signal); today's ongoing downside price action is currently confirming this downward selling pressure and a DAILY CLOSING BELOW 43'000 would weigh further on the BTC and therefore open the door for lower levels.
Daily clouds area is between 42'524 and 39'093
RSI still above 50, @ 57.93
LAGGING LINE failed to enter in the daily clouds and is in progress to reverse too.
The MID BOLLINGER BAND, my own barometer,is currently @ 40'825 and also roughly in the middle of the daily clouds support; this level should be watch at very carefully as a daily closing below this point. would directly put the focus towards the daily clouds bottom around the 39'000 level.
WEEKLY (W1)
A quick look at the weekly char shows , for the time being a failure to breakout the weekly top clouds resistance area !
Watch the clouds in this time frame as a broad indicator for further development.
4 HOURS (H4)
DOUBLE TOP FORMATION IN PROGRESS , coupled with a double doji and a RSI BEARISH DIVERGENCE !!!
Trigger level @ 43'220
Technical target (in case of downside breakout confirmed) @ 41'108
Interesting to note that the H4 Kijun-Sen is @ 41'174 and should also be seen as a PIVOT LEVEL in this H4 time frame
1 HOUR (H1)
As for H4, a double top formation is in progress.
Currently, already, below :
1) Kijun-Sen
2) Mid Bollinger Band
3) Tenkan-Sen
4) the clouds
The double top target @ 41'108, coincides also roughly with the H1 clouds bottom support @ 41'241; the 50 % Fibonacci retracement of the 37'015-45'332 recent rally is @ 41'173
LAGGING LINE below TS and KS but still above the clouds.
IRONMAN8848 & Jean-Pierre Burki
