Apple Full Trend Reversal W/ MA?NASDAQ:AAPL
Apple might be in the middle of a full on reversal from this massive drop it's been on for awhile now. Follow the 20/50/150/200 MA from 1 minute all the way up to 1 hour chart and notice how they are all reversing trend. The key now is to follow the 2H-4H today maybe more to see if they complete the reversal on the 50 passing over the 150 etc. Could be an amazing sign for Apple. If it gets stuck though the downside would be a big sell off. I think Apple is bullish and people want it to be bullish in the market so my hopes are directed that way. Also is was massively oversold since Feb.
Thoughts?
Do you due diligence as always and make sure to keep up to date with all the market news and pre market buzz concerning the overall market and virus.
Reversalpoint

Bitcoin: New Sell Signal? Consider These Inflection Points.#Bitcoin has reacted off of the 6425 resistance level that I have been highlighting recently. And as a result, is in the process of producing a mixed signal. Broader structure favors a test of recent lows, while short term order flow may be pointing to a not so obvious change. The larger structure (recent bearish swing from 8K to 4K) should carry more weight, until a new pattern or development comes along to negate that idea. The aim of this article and video is to point out what these changes can look like and how they will shape our SWING TRADE decisions as the price unfolds.
These are the main points of this video:
1. Price has tested the 7150 area, but could not close above 6425. While the push into the low 7Ks is a positive, and may be a sign of a changing price structure (better chance of reversal upon next retrace), it is not enough to provide any kind of conformation that we can rely on. This is the nature of a mixed signal. We are still open to taking swing trade long signals (we recently shared one at 5750), but at 1% risk ONLY.
2. IF price closes below 5640, a new sell signal will be confirmed. We do NOT intend to exit our long upon such a signal, and have compensated for such movement with a wide stop and smaller position size (1% risk). The push to the 7150 area helps to define two particular inflection points where a bullish reversal can materialize and we are willing to give the market a chance to produce one of these scenarios.
3. The 4800 area is the first location where a higher low can develop. IF a pin bar or inside bar appears in this area on THIS time frame, we will be prompted to share a new SWING trade long idea. Since we are long, we will not add to our swing trade (strict risk control). The second area is the one that tricks most bears and that is the failed low around the 3500 area. This is where price appears to be making a lower low, followed by a sharp reversal candle. A pin bar or outside bar would be compelling and within the scope of our expectations. This is basically a variation of the double bottom and a common pattern that we specifically look for in terms of our swing trade strategy.
Again these are a summary of high probability inflection points that we are anticipating, these are not predictions or absolute opinions of any kind. Bitcoin, like the stock market is motivated by the same irrational behaviors: greed and fear which play out in particular and repetitive patterns of order flow. As retail traders who are not privy to non public material information, order flow is the next best thing we can possibly get, not news or other forms of infotainment. Capitalizing on it requires overcoming the obstacles put in the way by our own human nature. If you want to win in the long run, stop reacting to the obvious.

Long ADAAfter a deep retrace ADA is holding steady at the bottom of a long channel spanning a few months. Could be a nice place to buy some cheap ADA if we see a swing low :)

EUR/AUD : Trade SetupsWe can see More upside Move till to test the Swing High then can see Reversal in downside.
ThankYou

Tightening Wedge-----I see 3 Potential ScenariosI see 3 potential scenarios here. Still too early to tell. But from what I see thus far, the market will trade sideways until close and well see a potential reversal signal as soon as tomorrow OR not!

Stock reversal After the stock was sharply falling, the significant volume came out, - that's the first sign of the trend stalling. Then the reversal pattern appeared, which got confirmed by the big white candle that closed above January high (marked as bright green). I was a bit late as I didn't manage to catch the market closing, so I tried to get in at the opening on the following day.
1)Stop loss is under recent lows.
2)Profit target is around the beginning of the sharp decline.

USDCAD Price is getting close to our bearish zone again This is a full breakdown of my perception of Price action on higher time frames! I take my entries using smaller time frame confirmation and you should too. If you have any questions about this trade or my strategies feel free to ask them in the comment section below!
Good Luck!!!!!!!!!!!

EURJPY SHORT TRADE, BEARISH REVERSAL? 600 PIPS POTENTIAL!! Happy Monday everyone!!
After screening my chart this afternoon, i saw that there is interesting sell signal on Euro / Yen especially at the bigger time frame. Is it possible of the bear take in charge now? hmmm.. Might Be!! but lets take a look what information market currently gives us.
Monthly Time Frame
- Downtrend line potential 3rd touch
- Support breakout 128.803 currently on pullback
- Bearish Engulfing candle: Resistance at 123.318, Support at 120.008
- Sell signal identified
Weekly Time Frame
- Downtrend line potential 3rd touch (similar to monthly time frame)
- Support breakout 121.674 current on pullback
-Bearish Engulfing candle: Resistance at 123.357, Support at 121.259
- Sell signal identified
Daily Time Frame
- Support breakout 122.506
- currently price had already touch this support and move, creating engulfing bearish candle, this where i found my sell confirmation.
*ENTRY POINT EXPLANATION*
H4 Time Frame
- Lower low structure formed, 122.821 as high and 122.075 as our new lower low, breaking 122.212 as last week support.
- Double top formation formed at 122.821 as resistance, WAIT FOR PULLBACK to neckline 122.633, than we can good to sell
If this really monthly reversal movement than we might catch 600 pips more at last support 116.470
Thank you for looking at my analysis, this is my point of view on EUR YEN, whats yours? please let me know on the comment and i hope we can be friends ^^

USDCHF - LongA Nice area of reversal for USDCHF
Going to open a long position now on this trade, 1% risk on target 1 and 0.5% risk on target 2
Lets see how it plays out

AUDNZD - Long Possible long entry coming up on AUDNZD
Lots of buying pressure at this area previously.
Will be looking for longing opportunities as soon as we enter this zone.
Lets see how it plays out. Any questions feel free to ask

CRUDE OIL REACHING SELLING DECISON POINTCrude Oil is reaching a selling decision point. Wait any reversal candlesticks or reversal chart patterns or any divergence of any oscillator indicators.

AUDUSD Monthly reversalPrice may go down a little further, potentially to around 0.675 before reversing back up by at least 70 pips

Securing My Edges with XAUUSD I can't help but notice the huge potential H&S pattern that has been forming on the pair ever since it found resistance at the $1556 handle. Friday's bull trap that saw price ran up to $1518 only to get a quick rejection of that area lets me know that sellers aren't ready to roll over without a fight. The rule of thumb is to wait for the confirmation bear candle after the formation. If we get a bear candle on Monday's trade day we would definitely get the confirmation that $1518 is indeed the reversal point. I have already started to build out a short position at $1,505 and would definitely add another position if I see $1,507-1510. My stop loss is somewhat generous at $1525.
On the fundamentals front, the FOMC minutes is due on Wednesday and the market has already priced in a rate cut. The USA/China trade talks are going well so we might hear a more hawkish tone from the Federal Reserves members. If this scenario plays out, we will get the volatility to push the pair down. As always, it is hard to predict what we get on the economic front on a day to day basis which can change the likelihood of the technical set up playing out.
Here's My Plan-
Short Gold at $1,505.04. Add to position if I see $1507.4 or better.
Stop loss is 200 Pips
Target 1: $1446 and Target 2: $1335
Be sure to follow me for more set ups. Comment your thoughts below. Share with a friend. Give a thumbs up (LIKE) to show support.
Good Luck and Happy Trading!

USDCHF #Forex #ForexTrader #ForexTrading #ForexChartIf the daily candle can close engulfing then i will be going short.
Reasons;
-Still uncertainty over the Dollar strength with the Chinese trade war going on.
-Struggling to break through the 1. level
-Each push towards that level has gotten weaker and weaker.
Lets see how it plays out.
Any questions feel free to comment or message.

USDJPY #Forex #ForexTrader #ForexTrading #ForexChartUSDJPY - shorts or longs on 15min take your pick
I'm more inclined to go short due to higher TF's still being bearish, but with US trade talks looking positive and JPY seeming to weaken last week it could turn the tables
Lets see
Any questions drop me a message or a comment im happy to help
Ben
#PipGainFX

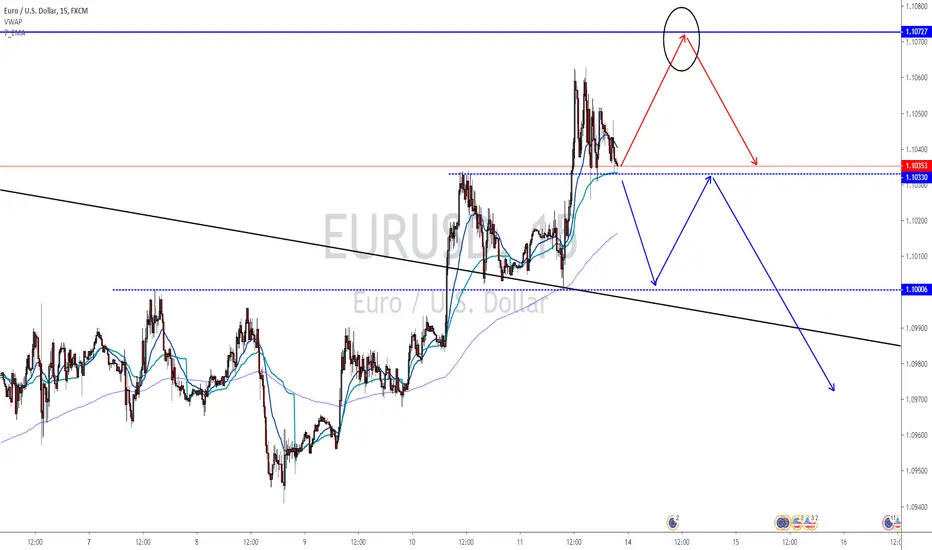
EURUSD #Forex #ForexTrader #ForexTrading #ForexChartForecast for my 15min TF strategy.
Very bearish on the daily TF but gaining strong momentum on the 4 hour and hourly TF
Will be waiting to see how price reacts around the current level, but with the US/China trade war seeming to have positive talks, could see some dollar strength and push the EURO lower
Any questions feel free to ask, by dropping a comment or a message im happy to help
Ben
#PipGainFX
EURUSD 4H EFC INDICATOR STRATEGYEFC INDICATOR is a REVERSAL finding INDICATOR.
EFC INDICATOR finds your ENTRY SIGNAL.
EFC INDICATOR finds your STOP LOSS.
EFC INDICATOR finds your TAKE PROFIT.
EFC INDICATOR has an adjustable risk reward setting.
PM me is you have any questions about the EFX INDICATOR that I can help you with.

AUDUSD #Forex #ForexTrader #ForexTrading #ForexChartAUDUSD looks like its struggling to get down past this level yet again. could be a chance to grab some quick profit.
Or it may go longer term and move higher. But with the rate cuts its highly unlikely
Id be definitely looking for a move up to 0.674-0.675. Then it may look to reverse and move lower.
Any questions feel free to ask.
Ben
#PipGainFX

ORBEX: EURJPY - Successful Zig-Zag Could Validate ReversalIt looks like the corrective intermediate wave (C) of the corrective bearish Primary wave 5 ended at 115.87. As part of Cycle b, or 2, we can now expect prices to move higher medium and long-term with one of the medium-term upside stops laying at 122.54.
The current minute ii correction is likely to end as a zig-zag complex pattern w,x,y with minuette y potentially ending near 116.76, where the 78.6% FR of the minute impulse is. In case it turns up sooner, we should be looking that happening from next week onwards, if not today, Friday.
The current structure suggests that once this correction is done with, prices could continue up and end complete the 5-wave minute impulse at the 1.618% FE, where minor 1 is likely to form a corrective pullback pattern.
We could look for short-term sells and then a reversal to follow the motive minute wave iii.
Invalid below 115.88
Stavros Tousios
Head of Investment Research
Orbex
This analysis is provided as general market commentary and does not constitute investment advice.

ETH USDT - Not so Wild Idea, BullsJust a wild ETH USDT Idea working off some pivots. This Inverse Head and Shoulder has absolutely no structure what-so-ever at this point, but working with some swing pivots could potentially line something up for a reversal - something to watch as per usual.
Good luck traders, may you find yourself on the profitable side of it.

XAUZAR pair climbed high breaking the highest res zone , forming a new zone, however price is dropping , DOUBLE TOP POTENTIAL, after break of neckline and price pushing below , zone low , strong sell must be anticipated.

More pain ahead for Altcoins after some initial gains? Bearish for altcoins in the mid to long term if BTC.D finds support at ca. 68.7% and rebounds (at or before 6th Sept).
Neutral for altcoins , if BTC.D drops below 68.7%, or fails to move higher away from 68.7% after 6th Sept.
Bullish for altcoins , if BTC.D falls below 68.7% and retest as resistance with immediate target down to 66.64% (then chart to be reassessed).

Watch out for another drop :) PMA is going to drop down again.
As we can see in each sycle MACD reversal means drop of PMA.
MACD looks like it wants to reverse.
Also BTC looks like it can go up again, so all altcoins will go down.
All in all - I'm waiting to pack bags at 1 satoshi :) Let's get rich :)
