Smart Money Concepts in Action: XAUUSD Tests Strong Resistance Market Context and Structure
On the 1-hour chart, XAUUSD (Gold) has been in a bullish market structure, forming consecutive Breaks of Structure (BOS)—a clear sign of buying pressure and upward momentum. These BOS points mark moments when the market forms new highs, confirming bullish continuation.
However, as price approaches the 3370–3380 zone, it reaches a well-defined resistance/supply area. This zone has previously rejected price and can be viewed as a region where institutional selling may occur.
🧠 Smart Money and Liquidity Concepts
From a Smart Money Concepts (SMC) perspective, price often moves to areas of liquidity—zones where buy stops (above highs) or sell stops (below lows) are collected. In this chart:
Price pushes up towards 3370, potentially grabbing liquidity above recent highs.
This move could be a liquidity sweep, where the market fakes a breakout to trap retail traders before reversing.
Such behavior often occurs near institutional zones, suggesting a possible distribution phase—where large players offload positions before a move in the opposite direction.
⚙️ Resistance Analysis: Why 3370 Matters
The 3370–3380 area has acted as a ceiling in the past.
Price is currently reacting near this level, showing early signs of rejection.
This zone aligns with previous order blocks, where institutions may have placed sell orders.
In educational terms, this shows how supply zones can act as natural turning points in a market, especially when price approaches them after an extended move.
📦 Support & Potential Downside
If a reversal happens from this resistance, the next key support zone lies between 3300–3320. This level has historically acted as demand and could be revisited for price rebalancing or order filling.
📝 Educational Summary
This XAUUSD chart provides a great learning opportunity in observing:
How Break of Structure (BOS) confirms trend direction.
The role of liquidity zones in trapping retail traders.
How smart money operates around key levels like 3370.
The importance of combining structure, zones, and reaction for confluence.
Reversaltrading

July 13, Forex Outlook : This Week’s Blueprint to Profit!Welcome back, traders!
In today’s video, we’ll be conducting a Forex Weekly Outlook, analyzing multiple currency pairs from a top-down perspective—starting from the higher timeframes and working our way down to the lower timeframes.
Currency Pairs:
EURUSD
USDCAD
AUDUSD
EURGBP
EURJPY
GBPCHF
USDCHF
NZDCHF
NZDUSD
EURNZD
Our focus will be on identifying high-probability price action scenarios using clear market structure, institutional order flow, and key confirmation levels. This detailed breakdown is designed to give you a strategic edge and help you navigate this week’s trading opportunities with confidence.
📊 What to Expect in This Video:
1. Higher timeframe trend analysis
2. Key zones of interest and potential setups
3. High-precision confirmations on lower timeframes
4. Institutional insight into where price is likely to go next
Stay tuned, take notes, and be sure to like, comment, and subscribe so you don’t miss future trading insights!
Have a great week ahead, God bless you!
The Architect 🏛️📉

Tesla - There's more after the +60% rally!Tesla - NASDAQ:TSLA - will blow even further:
(click chart above to see the in depth analysis👆🏻)
It is almost incredible to see such a large cap stock rally more than +60% in less than two months. But Tesla is clearly the exception and therefore we should expect the unexpected. What's quite likely is at least another rally of about 25% from here and a retest of the previous all time high.
Levels to watch: $250, $400
Keep your long term vision!
Philip (BasicTrading)

Ethereum - The bottom is finally in!Ethereum - CRYPTO:ETHUSD - is starting the rally:
(click chart above to see the in depth analysis👆🏻)
Finally, after dropping an expected -65% over the past couple of months, Ethereum is retesting and already rejecting a significant horizontal structure. Together with the strong confluence of support, Ethereum is now creating a long term bottom, initiating the next bullish cycle.
Levels to watch: $2.000, $4.000
Keep your long term vision!
Philip (BasicTrading)

Reversal Trade in ICICI Prudential1. Consolidation breakout
2. Positive Divergence on RSI
3. Volume pop up
4. MACD signal turning green
5. RSI near 70
6. Good weekly close

Reversal Trade in ASTRAL1. Consolidation breakout
2. Positive Divergence on RSI
3. Volume pop up
4. MACD signal turning green
5. RSI near 70

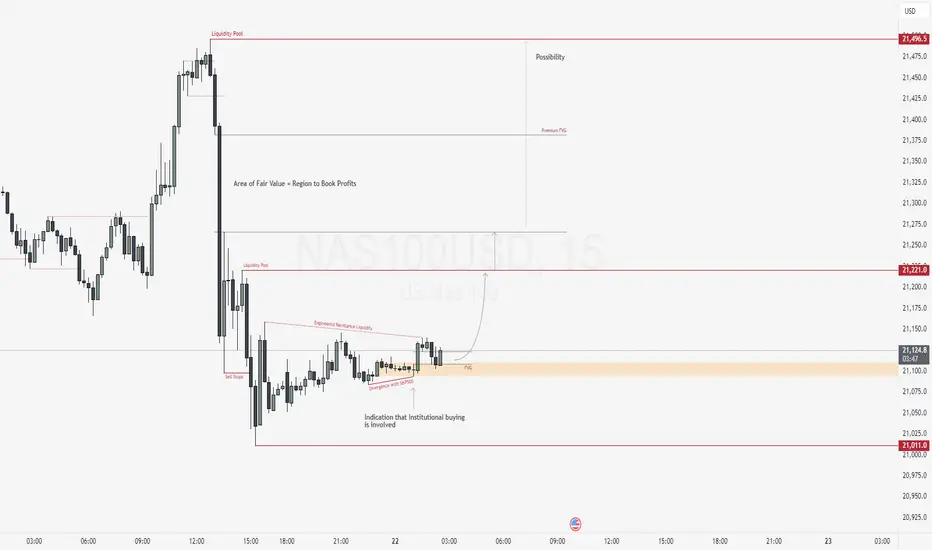
NAS100USD: SMT Divergence Signals Reversal from Discount PricingGreetings Traders,
In today’s analysis, we are closely monitoring NAS100USD for a potential reversal of bearish institutional order flow. While the broader trend has been bearish, current price action presents strong confluence for a bullish shift, suggesting an opportunity to align with a possible upside move.
Market Context:
NAS100USD is currently trading in deep discount territory, which historically presents favorable conditions for institutional accumulation. We’ve observed a liquidity sweep—price took out previous sell stops—suggesting institutions may have order-paired against willing sellers at these discounted levels.
Key Observations:
SMT Divergence with S&P500: While the S&P500 took out its previous low, NAS100USD remained above its corresponding low. This divergence signals underlying strength and institutional buying on NAS100USD, offering a strong indication of a reversal.
Bullish Structure Hints: Minor breaks in market structure to the upside are emerging, further validating the bullish narrative.
Institutional Support Zone: Price is currently trading inside a bullish order block that is also aligned with a Fair Value Gap (FVG)—a strong confluence zone that may act as support for continued upside movement.
Trading Strategy:
Await confirmation of support holding within the order block and FVG zone.
Target 1: Relatively equal highs just above current price action—an engineered liquidity pool where buy stops are likely resting.
Target 2: The premium FVG, a key area of institutional interest where longs accumulated at a discount will be offloaded for profit. The area of fair value is an region where the institutions start to book their profits.
By reading the divergence, price action, and institutional behavior, we can strategically position ourselves to capitalize on a high-probability reversal.
Happy Trading,
The Architect 🏛📊
S&P500 - The bottom we have been waiting for!The S&P500 - TVC:SPX - officially created the bottom:
(click chart above to see the in depth analysis👆🏻)
This month we officially saw one of the craziest stock market fakeouts of the past decade. With a drop and reversal rally of about +15%, the S&P500 is about to even close with a green monthly candle, which then indicates that the stock market bottom was created.
Levels to watch: $120, $250
Keep your long term vision!
Philip (BasicTrading)

Bitcoin - The Bottom Is In!Bitcoin ( CRYPTO:BTCUSD ) is reversing right now:
Click chart above to see the detailed analysis👆🏻
It was really just a matter of time until Bitcoin actually manages to create a potential short term and longer term bottom. With this monthly candle, bulls are taking over again and starting to buy cryptos quite heavily. The chart just tells us that this is not the end, but rather the continuation.
Levels to watch: $70.000, $300.000
Keep your long term vision,
Philip (BasicTrading)

NAS100USD: Rejection Block & Breaker Converge for Sell SetupMarket Context:
In today’s analysis of NAS100USD, we note that although the market has been trading within bullish institutional order flow, current price action is presenting multiple signs that a bearish reversal may be underway. Institutional behavior appears to have shifted, particularly after liquidity was swept and price began to respect resistance zones.
Key Observations:
Premium Buy Stop Sweep:
Price action swept the swing high rather than breaking it cleanly, indicating a stop raid. This is a common smart money tactic used to engage with buy stop liquidity in premium pricing before reversing.
Rejection Block Formation:
A sharp rejection followed the liquidity sweep, leaving behind a Rejection Block—a powerful institutional resistance zone. This suggests the institutions placed sell orders against willing buyers and are defending this level.
Market Structure Shift:
We observe a break in internal structure to the downside, further confirming that the prior bullish order flow may now be transitioning into a bearish phase.
Breaker Block Retest:
Price has retraced into a Breaker Block, where institutions typically revisit prior zones of buying to mitigate exposure and initiate new sell positions. This zone is reinforced by alignment with the previous buy stop sweep, providing a high-value confluence area for short opportunities.
Trading Plan:
Entry Strategy:
Await confirmation within the breaker on the lower timeframes. Once confirmed, these zones offer a strong institutional case for short positioning.
Targets:
Focus on discount liquidity pools as the primary objective. Selling from premium levels with the intention of targeting undervalued zones mirrors institutional execution models.
Stay aligned with smart money behavior—observe, confirm, and act with precision.
Happy Trading!
The Architect

Tesla - The Next 7 Days Decide Everything!Tesla ( NASDAQ:TSLA ) is sitting at a crucial structure:
Click chart above to see the detailed analysis👆🏻
Despite the -60% correction which we have been seeing over the past couple of months, Tesla still continuously validates its overall uptrend. That's exactly the reason for my strong bullish thesis and the assumption, that after we see bullish confirmation, Tesla will reject the current support area.
Levels to watch: $250, $400
Keep your long term vision,
Philip (BasicTrading)

NAS100USD: Is this a False Break?Greetings Traders,
In today’s analysis on NAS100USD, we observe sustained bullish volatility, indicating that the institutional order flow remains decisively bullish. As such, our objective is to align with that momentum and seek opportunities to position ourselves accordingly.
Current Market Context:
Now entering the New York session, we can anticipate continued upward movement. A key technical development is the recent liquidity sweep—price action took out a set of sell stops, creating the appearance of a potential bearish break of structure. However, this movement aligns with a classic “Turtle Soup” scenario, where a false break is engineered to trap liquidity before the market resumes in its dominant direction.
Institutional Insight:
This sweep suggests that institutions have likely order paired against willing sellers, using their stops as entry liquidity. With that liquidity now absorbed and price rejecting lower levels, we look for bullish confirmations to join the smart money narrative.
Trading Focus:
We are now monitoring for lower-timeframe confirmation entries to validate bullish setups, ideally supported by institutional arrays or bullish order blocks that hold as support.
Let the market reveal the footprints of smart money—our role is to read and respond with discipline.
Regards,
The Architect

Amazon - Look At This All Time High Retest!Amazon ( NASDAQ:AMZN ) will create the bottom soon:
Click chart above to see the detailed analysis👆🏻
The trend on Amazon is clearly towards the upside and the recent correction of about -30% did not change that at all. Rather, we are now witnessing an extremely bullish all time high break and retest and therefore, if Amazon actually creates bullish confirmation, this could form a bottom.
Levels to watch: $180
Keep your long term vision,
Philip (BasicTrading)

NAS100USD: Discount Reversal & Bullish Continuation NarrativeGreetings Traders,
In today’s analysis on NAS100USD, we observe the market operating within a bullish institutional order flow—a clear signal for us to align with the prevailing momentum and look for high-probability buying opportunities.
Market Context:
The market has established a well-defined bullish swing, followed by a retracement that delivered price action deep into discount territory. Within this zone, a prior low was taken out, serving as a liquidity grab where institutions could execute order pairing—buying against the willing sellers (sell stops) positioned at discounted prices.
Key Observations:
Optimal Entry Zone: Price retraced into the 62%–79% Fibonacci levels, historically considered the optimal reversal zone. Following this, we observed a rejection—an early indication of bullish re-engagement.
Breaker Block Alignment: The rejection coincides with a breaker block array, a zone where previous selling orders are mitigated and fresh institutional buying begins. This strengthens the validity of the expected reversal.
Bullish Continuation Signs: Post-rejection, price action confirmed a shift in market structure, and prior order blocks have now begun to act as bullish support arrays.
Trading Strategy:
With institutional footprints aligning at key technical zones, I am anticipating further upside. Upon receiving confirmation on the lower timeframes, I will look to enter buy positions, aiming to target the liquidity pools resting in premium prices—the next logical draw for institutional interest.
Stay focused, follow the smart money, and let the structure guide your entries.
Kind Regards,
The Architect

Solana - Here Comes The Bullish Reversal!Solana ( CRYPTO:SOLUSD ) might head for new all time highs:
Click chart above to see the detailed analysis👆🏻
Just a couple of months ago, Solana perfectly retested the previous all time high and created an expected short term rejection. However, with the current major support area and a potential bullish reversal, Solana remains in a strong market, potentially heading for new all time highs.
Levels to watch: $120, $250
Keep your long term vision,
Philip (BasicTrading)

Nasdaq - Printing The Obvious Bottom!Nasdaq ( TVC:NDQ ) already finished the correction:
Click chart above to see the detailed analysis👆🏻
After we witnessed a minor "crash" of about -25% over the past couple of weeks, the bottom might be in on the Nasdaq. We simply saw another very bullish all time high break and retest and depite the possibility of a second retest, I am (still) extremely bullish at these levels.
Levels to watch: $17.000
Keep your long term vision,
Philip (BasicTrading)

NAS100USD: SMT Divergence Hints at Potential ReversalGreetings Traders,
In today’s analysis of NAS100USD, although the current market structure reflects bearish institutional order flow, there are growing signs that a potential reversal may be forming.
Key Observations:
1. Smart Money Technique (SMT) Divergence:
We are currently observing SMT divergence—a strategy where the underlying asset (NAS100) is compared against its benchmark (US500). These indices typically maintain a 90–100% correlation. However, when this correlation breaks down, it often signals that a reversal may be imminent. In this case, while NAS100 continues to show bearish momentum, the divergence from US500 suggests the possibility of bullish interest building.
2. Institutional Support at the Rejection Block:
Further confluence for a potential reversal lies in the presence of a rejection block acting as a strong institutional support level. This is a zone where smart money previously defended price, and if confirmed, it could provide an optimal entry for long positions.
Trading Plan:
We will monitor the rejection block for confirmation of bullish intent before entering any trades. If confirmed, the idea is to target the buy-side liquidity residing in premium pricing zones.
Invalidation Level : This reversal idea will be invalidated if NAS500 breaks below its most recent swing low.
Stay alert for confirmation, and always ensure the idea fits within your broader trading framework.
Kind regards,
The Architect

Meta - The Correction Is Officially Over!Meta ( NASDAQ:META ) is retesting the previous all time high:
Click chart above to see the detailed analysis👆🏻
For more than 7 years, Meta has been perfectly trading in a reverse triangle formation. And just three months ago, Meta once again retested the upper resistance trendline and reversed towards the downside. But with the retest of the previous all time high, this correction is over.
Levels to watch: $500, $800
Keep your long term vision,
Philip (BasicTrading)

Bitcoin - All Time Highs Are Inevitable!Bitcoin ( CRYPTO:BTCUSD ) is still massively bullish:
Click chart above to see the detailed analysis👆🏻
Despite the correction of about -30% which we have been seeing lately, Bitcoin remains in a bullish market. Even if we see another drop of about -20%, this will still just turn into a textbook bullish break and retest and either way, new all time highs will follow on Bitcoin.
Levels to watch: $70.000, $400.000
Keep your long term vision,
Philip (BasicTrading)

Xrp - Don't Underestimate The Bulls!Xrp ( CRYPTO:XRPUSD ) is bullish despite the recent drop:
Click chart above to see the detailed analysis👆🏻
Yes, we have been seeing a quite strong correction of about -50% on Xrp over the past couple of months. But no, this bullrun doesn't seem to be over yet but instead Xrp is creating a significant bullish break and retest formation. So if we get the bullish confirmation, we might see new highs.
Levels to watch: $1.8, $3.0
Keep your long term vision,
Philip (BasicTrading)

Nvidia - The Chart Just Told Us So!Nvidia ( NASDAQ:NVDA ) might just still head a little lower:
Click chart above to see the detailed analysis👆🏻
After Nvidia perfectly retested the previous rising channel resistance just a couple of months ago, it was quite expected that we'll see a retracement. The overall trend however still remains bullish and if Nvidia drops a little more, the overall bullrun continuation rally might just follow.
Levels to watch: $80
Keep your long term vision,
Philip (BasicTrading)

Bitcoin - This Is Just Unbelievable!Bitcoin ( CRYPTO:BTCUSD ) is not dropping at all:
Click chart above to see the detailed analysis👆🏻
After we have been seeing one of the craziest weekly drops which I have experienced in my entire trading history, all major cryptos and especially Bitcoin are strongly holding their levels. Since bullish strength continues quite often, I do expect new all time highs on Bitcoin soon.
Levels to watch: $70.000, $300.000
Keep your long term vision,
Philip (BasicTrading)

S&P500 - The Correction Is Over Now!S&P500 ( TVC:SPX ) is retesting massive support:
Click chart above to see the detailed analysis👆🏻
Over the past couple of days, we have been seeing a quite harsh stock market "crash" with an overall correction of about -20%. However, as we are speaking the S&P500 is already retesting a major confluence of support and if we see bullish confirmation, this drop might be over soon.
Levels to watch: $4.900
Keep your long term vision,
Philip (BasicTrading)
