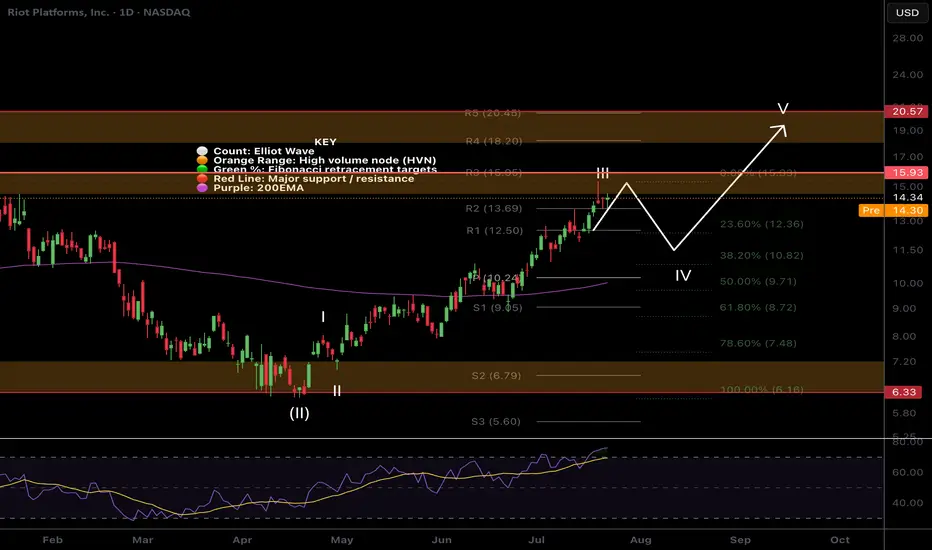
$RIOT Targets hitNASDAQ:RIOT has hit my take profit target at the High Volume Node and R3 daily pivot where it has found resistance.
Wave III appears to be complete with wave IV expected targets being the 0.382-0.5 Fibonacci retracement, also the daily pivot point and ascending daily 200EMA, $10.24.
Analysis is invalidated if we continue to the upside with a new swing high. RSI is overbought no bearish divergence.
Safe trading
RIOT
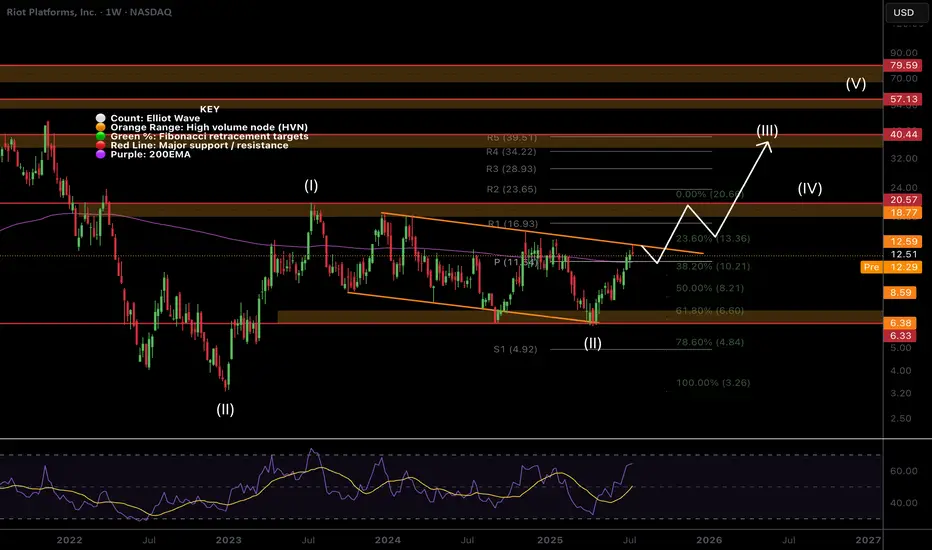
$RIOT Hit The Target Whats Next?NASDAQ:RIOT hit the descending orange resistance were I took partial take profits on my trade this week and it was immediately rejected as expected.
Price is now above the weekly pivot so that is the next support. This level also matches the weekly 200EMA.
Wave (II) hit the 'alt-coin' golden pocket of 0.618-0.786 Fibonacci retracement at the High Volume Node (HVN) support and descending support line which kicked off wave (III).
A breakout above the descending resistance line bring up the the next target of the HVN and previous swing high at $18-20 and $40 following a breakout above that.
Safe trading
$RIOT Continues to Follow PathNASDAQ:RIOT Is sticking closely to the plan testing the bottom and top of the channel multiple times.
Price closing above the weekly 200EMA and weekly pivot Friday will be a very bullish signal. As we have over 4 tests of the upper boundary resistance there is a high probability we break through and continue higher in a high degree wave 3.
Initial targets are the weekly R5 pivot at $39 and all time high at range at $79.
Price tested the .618 Fibonnaci retracement in a complex correction for wave 2.
Analysis is invalidated below the channel support.
Safe trading

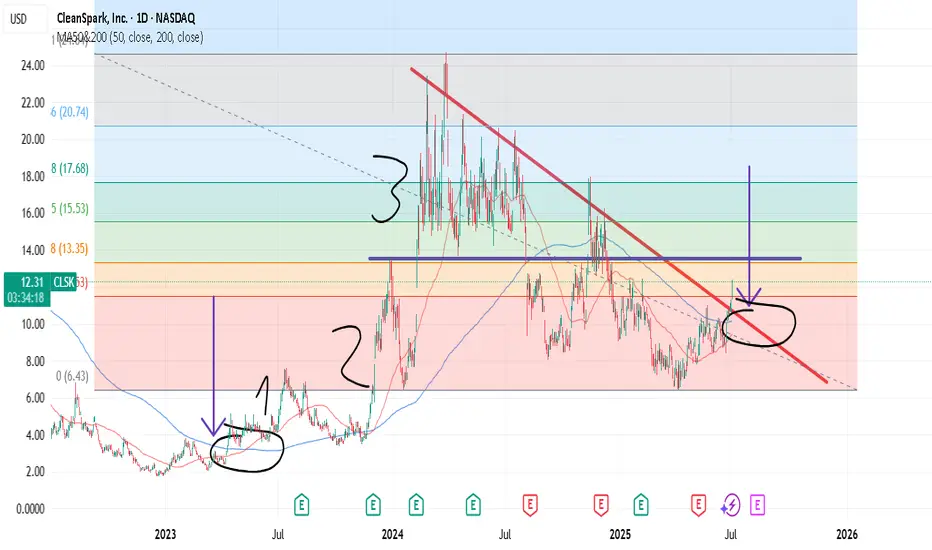
Mega bull trend starts now, CLSKIn short:
1) Goldencross soon to be triggered.
2) too see how the stock could perform (with accumulated, low 200dma), we can look in 2023. It peaked in mid July. After explosive rally in november.
3) 13$ levels is the 50% fibonacci..
4) 1st Elliot wave - people are skeptical. 2nd - woohoo. 3rd wave - fomo.
//Advancing in relative strength (CLSK/SPX).
//Small cap ( AMEX:IWM ) outperformance due to rate cut cycle (starts in September). Evidence is yesterday broadening rally.
//52WH is at november 18$. Expect a gamma squeeze?
position based on probabilities. I never make targets (future is unknown).
🥂
RIOT Stock: Leveraged Bet on Bitcoin’s Next Leg UpMy Bullish Thesis:
1. Leverage to Bitcoin Without Holding BTC
RIOT is one of the largest publicly traded Bitcoin miners in the U.S., offering investors exposure to the upside of Bitcoin — without directly owning the coin.
If Bitcoin goes to $100K or higher, miner stocks like RIOT historically outperform BTC in percentage terms.
This makes RIOT a high-beta play on the ongoing crypto bull market.
2. Post-Halving Upside
The April 2024 Bitcoin halving cut block rewards by 50%, which squeezes less-efficient miners — but RIOT benefits from:
Low-cost mining operations due to cheap electricity agreements in Texas.
Recent upgrades in hardware efficiency (with high-performance ASICs).
Greater share of the network hash rate as weaker players drop out.
Historically, Bitcoin and miners perform best in the 6–18 months after a halving, positioning RIOT for strong gains through year-end 2025.
3. Massive Infrastructure and Expansion
RIOT owns a 400+ megawatt mining facility in Texas, one of the largest in North America.
They’re expanding capacity and have locked in long-term energy deals that give them a key advantage during spikes in energy costs.
The company also earns revenue through demand response credits, essentially being paid to shut down power usage during Texas grid stress — a unique hedge for a miner.
4. Regulatory Edge Over Offshore Miners
As U.S.-based and NASDAQ-listed, RIOT is better positioned than foreign or unregulated competitors if/when the U.S. passes legislation around digital assets and mining.
This could lead to greater institutional adoption of RIOT versus other miners.
It’s also eligible for ETF inclusion or institutional funds focused on digital infrastructure or U.S. innovation.
RIOT is a classic “picks and shovels” play on the Bitcoin bull run — offering levered upside without having to buy BTC directly. With post-halving tailwinds, institutional favorability, and a strong technical breakout in progress, RIOT may be one of the top speculative growth plays in the crypto equity space heading into the second half of 2025.
Disclosure: I am part of Trade Nation's Influencer program and receive a monthly fee for using their TradingView charts in my analysis.

RIOT - Market Predictive Analysis & ForecastingRIOT
Reversing from a lesser scale (VI), associated with predefined levels
- Eyeing two pivots from 9.587. First one at 7.9189, second at 7.1653; target at 6.4434 is the minimum low
- Lowest low belons to larger scale from 20.8157 to 6.1294-5.6764
Long term remains BULLISH
#RIOT

$IREN has the lowest all-in cost of mining a single coinNASDAQ:IREN is mining a single bitcoin at $40,000 all-in costs. When bitcoin appreciates to $150-200k, the miners with their rigs, land, infrastructure, balance sheet, hardware etc will be repriced higher. Thats the gain I would like to capture with this entry here at $9 a share.
This phenomenon will be seen throughout the entire sector, all miners will appreciate from here.

Double bottom and Demand on RIOT! OptionsMastery:
🔉Sound on!🔉
📣Make sure to watch fullscreen!📣
Thank you as always for watching my videos. I hope that you learned something very educational! Please feel free to like, share, and comment on this post. Remember only risk what you are willing to lose. Trading is very risky but it can change your life!

RIOT Platforms Options Ahead of EarningsIf you haven`t bought RIOT before the previous earnings:
Now analyzing the options chain and the chart patterns of RIOT Platforms to the earnings report this week,
I would consider purchasing the 12usd strike price Calls with
an expiration date of 2026-3-20,
for a premium of approximately $1.35.
If these options prove to be profitable prior to the earnings release, I would sell at least half of them.
Disclosure: I am part of Trade Nation's Influencer program and receive a monthly fee for using their TradingView charts in my analysis.

OptionsMastery: Looking for an immediate buy on RIOT!🔉Sound on!🔉
📣Make sure to watch fullscreen!📣
Thank you as always for watching my videos. I hope that you learned something very educational! Please feel free to like, share, and comment on this post. Remember only risk what you are willing to lose. Trading is very risky but it can change your life!

RIOT next BTC to bull 🐂 road map I already provided RIOT analysis ⏰ successfully top 🔝 & correction completed 🚀
Unfortunately 😬 my 2 posts got disconnected against trading view rules 📌
Again making complete analysis for next bull run 🐂
Before entering pls #DYOR
Below this post I will update you everything 🙂
So just follow and share post and save it by boosting 🚀 it 🙌
So if I updated anything in this macro correction or exit or crucial things u get updated 📌
Let's get started 📌
🧵👉

$RIOT, a setup for a comeback- Showing some strength on the pre market, RIOT is bullish above 12.30.
- while I am not expecting the move to be bigger than 12.50 on the day, keeping with momentum, we can see it at 13.70 by next week.
- a larger move to 14.20-15 may still on be on the table.
- Trade is risk off bellow 11.60.

Crypto Miner CLSK longterm patternBullish "march" if all factors hold true?
ie NVDA look weak-ish.
Falling yields would be nice.
Trump told his crypto team to investigate BTC reserve question within 100 days. That's now around April.
www.investing.com Markets pricing 1st rate cut around June.
Look into longterm macd potential.

Looking for a break of this upper trendline on RIOT! Sound on!🔉
📣Make sure to watch fullscreen!📣
Thank you as always for watching my videos. I hope that you learned something very educational! Please feel free to like, share, and comment on this post. Remember only risk what you are willing to lose. Trading is very risky but it can change your life!

+1,436% vertical from $0.55 to $8.45You were warned on time, before it went on a massive push higher.
It was mentioned in chatroom way before that.
Probably goes to test new highs at market open

Lets start a RIOT! 150% Potential UpsideChart #3/ 40: NASDAQ:RIOT 🪖
-Need Bull Flag Breakout at$16
-H5 Indicator is Green
-Volume Shelf Launch
-Williams Consolidation Box Thriving
🎯 $21 📏 $32 ⏳ Before 2027
NFA

$MSTR to 350 - corrective wave NASDAQ:MSTR to 350 - corrective wave in play.
Sustaining above $420 would negate this idea. Current price is $400

RIOT clean flag break?I'm seeing so much here but something so beautiful. From recent rises to its share price I believe there is some support here forming at $12. This chart seems to be headed upwards and it was in a flag mode and broke out of it. Could be a nice long for $15 by 4/2025.

CAN #RIOT, #AI and #ACHR successfullly copy #SOFI SoFi Technologies (SOFI)
As shown in the chart, SOFI has rebounded from its support level (Wave 2) and has already broken above its downtrend line, indicating that it is currently in the process of Wave 3.
Wave 3 seems confirmed here as the price has broken through the descending trend line and is showing strong upward momentum. Further confirmation would be maintaining a price level above 13.83.
Riot Platforms (RIOT)
For RIOT, the chart shows that it is currently at the support area of Wave 2 and has not yet broken out.
To confirm the start of Wave 3, RIOT needs to break above the green descending trend line shown in the chart and hold above the 14.27 level (indicated as a buy point).
If it breaks this descending trend line with increased volume, it would confirm the beginning of the Wave 3 uptrend.
C3.ai (AI)
For AI, the chart shows the price is also at the low point of Wave 2, forming a descending wedge structure.
To confirm the start of Wave 3, the price needs to break above the upper trend line of this descending wedge (around 27.76) and demonstrate a strong move upwards.
Once it breaks out with notable volume, it would confirm the start of the Wave 3 trend.
Archer Aviation (ACHR)
For ACHR, the chart also shows the price is in the low area of Wave 2, consolidating within a descending trend line.
To confirm the start of Wave 3, the price needs to break above the descending trend line shown in the chart and hold above the 5.28 level.
A strong breakout above this key level with high volume would confirm the beginning of Wave 3.
Summary of Elliott Wave Theory Application: According to Elliott Wave Theory, Wave 3 is typically the most powerful wave, so it is crucial to wait for a breakout of the Wave 2 structure (usually a descending trend line) accompanied by higher volume. Once each stock breaks through the specified key levels, it would confirm the start of Wave 3, indicating a continuation of the bullish trend.

Riot next BTC halving to bull run road map
I already provided RIOT analysis ⏰ successfully top 🔝 & correction completed 🚀
Unfortunately 😬 my 2 posts got disconnected against trading view rules 📌
Again making complete analysis for next bull run 🐂
Before entering pls #DYOR
Below this post I will update you everything 🙂
So just follow and share post and save it by boosting 🚀 it 🙌
So if I updated anything in this macro correction or exit or crucial things u get updated 📌
Let's get started 📌
🧵👉
1 📌
Next halving 25TH APR 2024
expecting price $28-35 RIOT
2 📍
2025 jan-march range expecting bull run top 🔝 target 🎯💯
Then money 💰 flow back to
BTCUSD
to final top 🔝
.
3 📌
Present support zones 📌 ( BUY / ACCUMULATION )
$12-11.5 ( 20-30% 💰 )
$7.25-8.6 ( 40-50% 💰 )
Worst case 📌 $5-6 #imo not possible 😜
Stop 🚏 lose #SL :: month close below $5
.
4 📍
Resistance 🤥 ( selling / exit )
Before going sell learn 😃 about PRINCIPAL TRADE concept 👍
It's nothing but removing your liquid or seeing your liquid 💰 at that target or zone 📌
Only holding #profit either to rotate nor to be safe in this risk assets 🙌
Principal trade target 🎯
$25-35 ( expecting halving time )
Profit sell :: $52-84 ( even more possible but that time I will update you here )
Always be in a plan 😉 keep mind 🧠 with minimum target 🙂
Then ur emotions won't get hurt 🤕
❤️🔥

$RIOT about to play catch up to the upside?NASDAQ:RIOT has been consolidating in a bottoming wedge and looks set to break out.
I think we see a very sharp move to the $18 resistance as RIOT has serious catching up to do. I think RIOT and HUT will be the most bullish two miners for this next move up.
After hitting $18, we should see some consolidation before the next big move higher.
Not sure if we get into the $100s or not, but will update the chart as the move plays out.

RIOT Platforms Options Ahead of EarningsAnalyzing the options chain and the chart patterns of RIOT Platforms prior to the earnings report this week,
I would consider purchasing the 10usd strike price Calls with
an expiration date of 2024-11-1,
for a premium of approximately $0.40.
If these options prove to be profitable prior to the earnings release, I would sell at least half of them.

RIOT: bullish count as long as 5 waves completesRIOT is chugging along since the low made in September. As BTC is holding major support areas, RIOT is getting the tailwind it needs to move forward. The price action looks bullish; but we have not seen a full 5 wave sequence. We need to see a few more higher highs and higher lows and get close or above $13 resistance level to have some kind of confidence that bull cycle has started. Keeping in line with BTC, after the minute degree wave 1 is complete, the whole market will plunge into a correction for a few months. That will be a true test of this bull market. If price can hold above $8 support, then sky will be the limit once we get out to the other side of correction....
If price breaks below $8.52 now, then this count is invalid. We might see a larger leading diagonal or a deeper correction might still be intact for intermediate 2.
