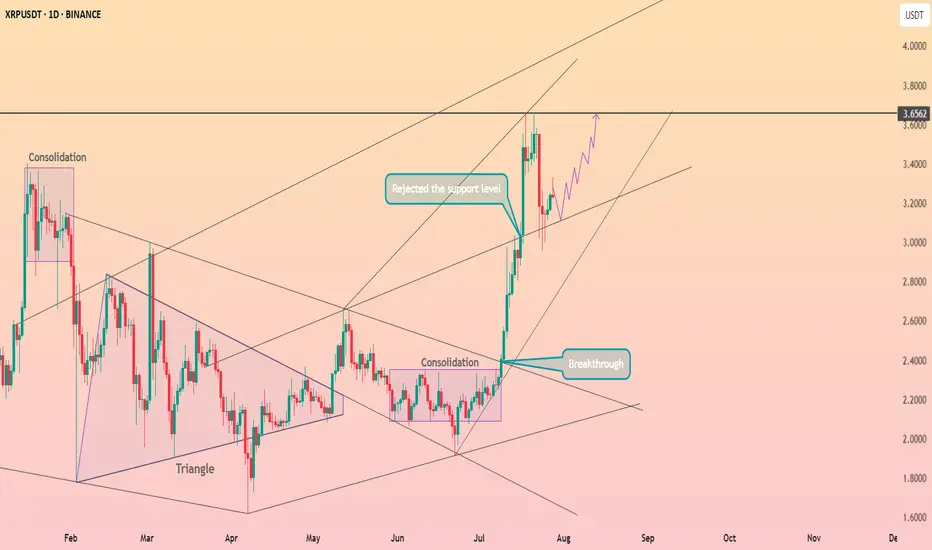
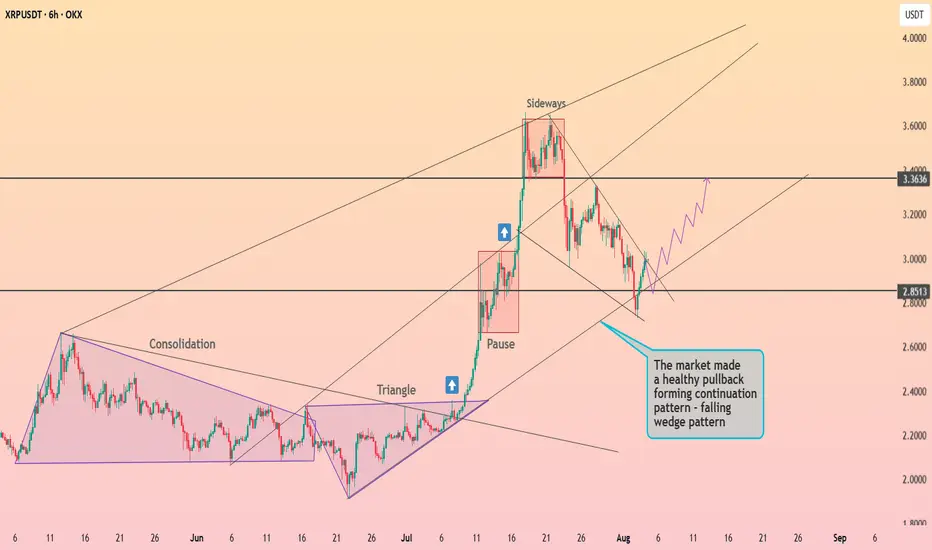
XRP is preparing to exit the wedge ┆ HolderStatOKX:XRPUSDT is forming a falling wedge after a sharp breakout and pullback. Price is stabilizing near $2.85, a key former resistance level. If bulls reclaim momentum here, a move toward $3.36 becomes a high-probability scenario.
Ripple
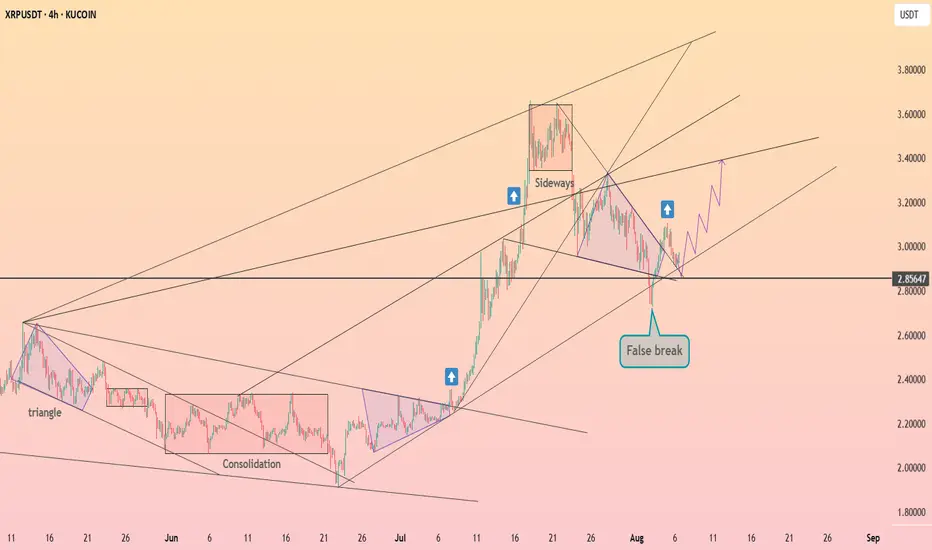
XRP go out from the wedge ┆ HolderStatKUCOIN:XRPUSDT faked a breakdown below 2.85 and is now recovering back into range. This aligns with previous bullish setups following consolidation. As long as the false break holds, price may attempt to move toward 3.40–3.50 again.
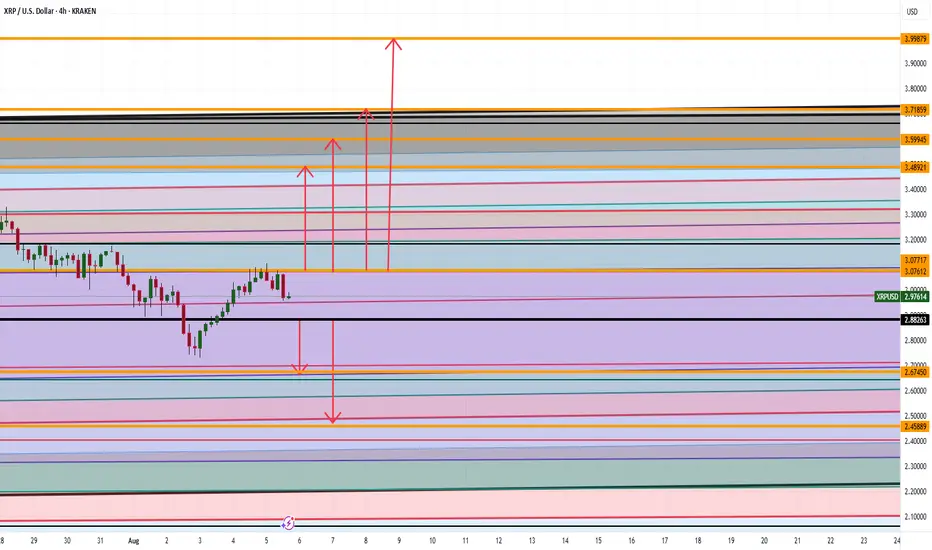
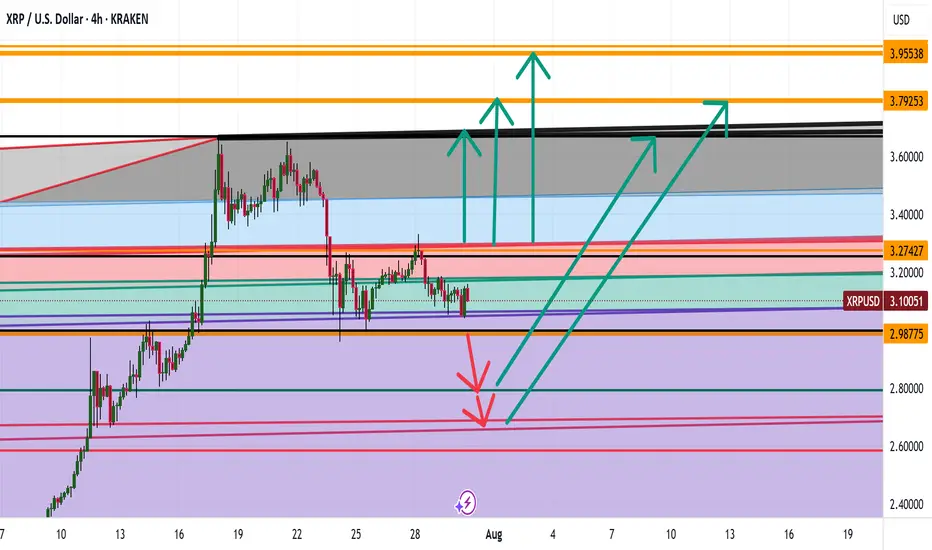
XRP ARE WE GOING TO $4 ANALYSIS Good afternoon
So looking at XRP we can spot a couple things :
Bullish Side: If we can break the high at 3.07 then 3.48,3.59,3.71, and 3.99 makes sense
Bearish Side: If we go below 2.88 then a drop down to 2.67 then 2.45 makes sense
Trade Smarter Live Better
Kris
ETH/USDT | ETH Under Pressure – Watch $3500 Support!By analyzing the Ethereum chart on the weekly timeframe, we can see that after reaching the $3940 zone, ETH faced selling pressure and is now trading around $3540. If the price fails to hold the key $3500 support, a deeper decline is likely, with potential targets at $3040 first and possibly $2680 as the second bearish target.
Please support me with your likes and comments to motivate me to share more analysis with you and share your opinion about the possible trend of this chart with me !
Best Regards , Arman Shaban

XRP Price Struggles as Key Holders’ Outflows Hit 7-Month HighBINANCE:XRPUSDT is currently priced at $2.99 , sitting just below the $2.95 resistance. The bearish market sentiment and outflows are evident, making it difficult for the altcoin to break through this resistance. A continuation of the current trend may lead to further downward pressure on the price.
BINANCE:XRPUSDT longer-term outlook is also influenced by its HODLer net position change, which has reached a seven-month low . The LTHs, who have a significant impact on the price of XRP, are seeing their positions decrease
BINANCE:XRPUSDT is likely to test the support of $2.65 in the coming days, unless investors shift their sentiment. If this support level fails to hold, XRP may experience further losses, putting additional strain on the altcoin and its investors.
To recover, BINANCE:XRPUSDT will need to reclaim $2.95 as support and break through the $3.00 mark . A successful breach of these levels could pave the way for a move towards $3.41, ultimately invalidating the current bearish outlook and offering hope for a potential recovery.
All in XRPRegulatory Shift: Barriers for Ripple and XRP are easing, clearing the path for dominance in crypto/blockchain markets.
End of Retail Bubble: The retail-driven crypto era is fading, with institutional players paving the way for entry.
XRP ETF Progress: Eight XRP spot ETF applications from major funds await SEC approval, expected within months.
Ripple Lawsuit Nearing End : Resolution is imminent, setting a precedent for other crypto projects.
Blockchain as Infrastructure: The new U.S. Treasury Secretary and SEC Director recognize blockchain as critical national infrastructure, comparable to railroads and the internet in its transformative potential. This perspective aligns with the rhetoric of global financial authorities like the IMF, BIS, and WEF, as well as leading consulting firms, which have championed blockchain’s role in revolutionizing finance and cross-border transactions over the past few years.
Market Trends : Stablecoins, CBDCs, tokenization, and cross-border payments will drive growth, settling on public blockchains.
XRP’s Advantage : Stress-tested by global banks and governments for over a decade, XRP is uniquely equipped for large-scale enterprise adoption. Backed by Ripple, a leading fintech with connected leadership and top talent, XRP leverages unmatched expertise and a global network of bank and payment partners, driving innovation and solidifying its enterprise-grade infrastructure.
Market Performance: Post-election, XRP surged 500%, outperforming all coins, with stop-loss hunting below $3 likely over.
Conclusion and price prediction XRP remains largely unnoticed by mainstream media, its transformative potential yet to resonate with the broader public. Compared to Bitcoin, XRP is still in its infancy as a store of value and speculative asset for retail investors. Yet, as market dynamics shift and critical developments unfold, a potent blend of utility-driven demand and speculative momentum could propel XRP to $10 by the end of 2025. If Ripple’s vision of an Internet of Value takes root—enabling seamless, instant, and low-cost global transactions, capturing a substantial portion of SWIFT’s payment flows, and harnessing the power of tokenization—XRP could emerge as a cornerstone digital asset commodity, potentially soaring to triple-digit valuations by 2030 and fundamentally redefining its role in the global financial ecosystem.
XRP Short Hedge in Play Against ETH & BTC Divergence 🚨📉 XRP Short Hedge in Play Against ETH & BTC Divergence ⚖️💥
Right now, Bitcoin is sitting at a major lost level: 115,700 . Unless we reclaim that zone , the market structure remains bearish. If BTC does reclaim it—I’ll turn ultra bullish. But until then, I must actively look for some shorts.
And in a sea of liquidity, XRP might offer reliable setups for short-side trades.
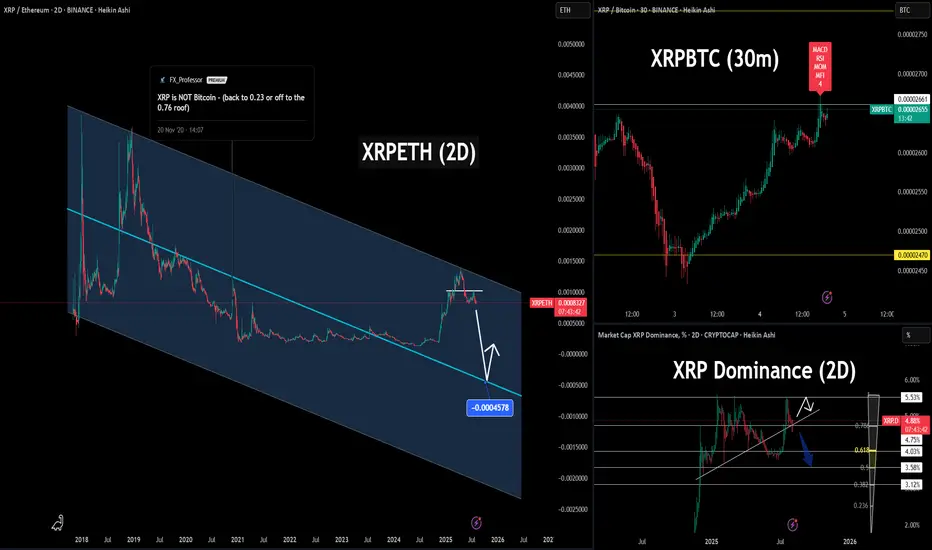
📊 1. XRP vs Ethereum (2D)
We're right at the top of a multi-year descending channel on BINANCE:XRPETH XRPETH. This is a textbook short entry zone , with a potential drop back toward the midline or lower boundary.
✅ Setup: Short XRP / Long ETH — clean hedge with relative strength in ETH.
⏱ 2. CAPITALCOM:XRPBTC XRPBTC (30m)
We now have 4 confirmed bearish divergences on the short-term chart:
🔻 MACD
🔻 RSI
🔻 Momentum
🔻 Money Flow Index (MFI)
This setup has a high probability of reversal, particularly at these horizontal resistance levels.
📉 3. CRYPTOCAP:XRP.D XRP Dominance (2D)
Rejection at 5.53%, again. Now with added Fibonacci confluence levels on the pullback:
0.618 Fib sits right at 4.03%
0.5 Fib near 4.75% (current battle zone)
Deeper liquidity zones at 3.58% and 3.12%
If dominance fails to hold the 4.75% neckline, we could see a full Fibonacci retrace back to the golden ratio— a strong potential drop.
📎 Throwback Chart: Nov 2020
📈 Here's a setup I posted years ago:
👉 XRP is NOT Bitcoin – back to 0.23 or off to the 0.76 roof
That idea nailed the explosive move from $0.23 to $0.76 , and then the collapse back to $0.17.
XRP has a history of sharp pops followed by deep drops — and this looks like another one might be brewing.
🔍 Macro Bearish Factors:
📦 XRP supply = 100 Billion (vs BTC’s 21M cap)
🧠 Ripple controls over 42.5% of total XRP (wallets + escrow)
📉 94% of XRPL txns hold no real value— network activity mostly spam
🕳️ “Dark pool” OTC volume suppresses price discovery
🧱 UNL validator model exposes centralization and network fragility
📊 XRP dominance structurally capped near 5.5%, now rejecting hard again
📌 In conclusion:
This is not about bias, it's about structure and data.
When the charts line up with fundamentals, and liquidity is flowing toward ETH and BTC, XRP becomes the natural hedge.
Short XRP. Long ETH. Watch BTC.
One Love,
The FX PROFESSOR 💙
Disclosure: I am happy to be part of the Trade Nation's Influencer program and receive a monthly fee for using their TradingView charts in my analysis. Awesome broker, where the trader really comes first! 🌟🤝📈
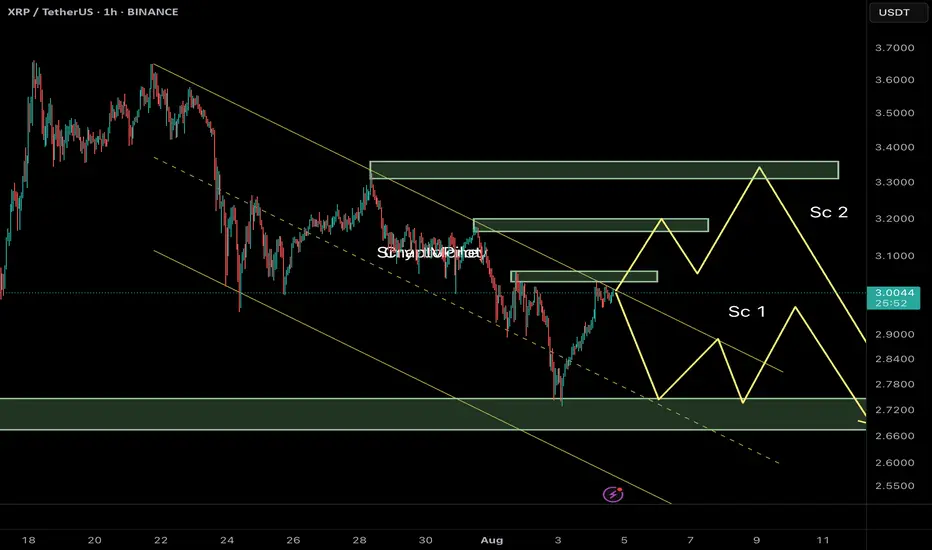
Ripple (XRP/USDT) Technical Analysis – 1H Timeframe🔰 Current Market Context:
After breaking below the ascending channel near $3.50, XRP has entered a corrective phase within a descending channel. Price is now hovering around a mid-range resistance zone, and we can outline two key potential scenarios from here:
⸻
📌 Scenario 1 (Sc1) – Immediate Rejection and Bearish Continuation
In this case:
• Price gets rejected from the current resistance zone ($3.05–$3.10).
• A quick corrective pattern (likely a Zigzag or Flat) plays out.
• XRP moves down to test the next demand zone near $2.70–$2.65, breaking below recent swing lows.
✅ This scenario aligns with the current weak structure and visible sell-side pressure. Liquidity above recent highs has likely been swept, creating a setup for continuation downward.
⸻
📌 Scenario 2 (Sc2) – Extended Correction with a Final Bull Trap
In this case:
• Price pushes higher toward a deeper resistance zone near $3.30–$3.40.
• A liquidity grab above the prior highs triggers a sharper reversal afterward.
• The overall structure could form a Diametric or Complex Correction, suggesting a deeper and more time-consuming wave before resuming the bearish trend.
⛔ This scenario requires strength and acceptance above $3.15, and should be treated as an alternative unless proven by price action.
⸻
🎯 Summary & Trade Strategy:
Scenario 1 is currently more probable unless we see a strong break and close above $3.10. Expectation: XRP may head toward the $2.70–$2.65 demand zone if resistance holds.
⚠️ Avoid entering early. Wait for confirmation via internal BOS (Break of Structure), bearish engulfing near OB zones, or signs of rejection with volume at resistance.
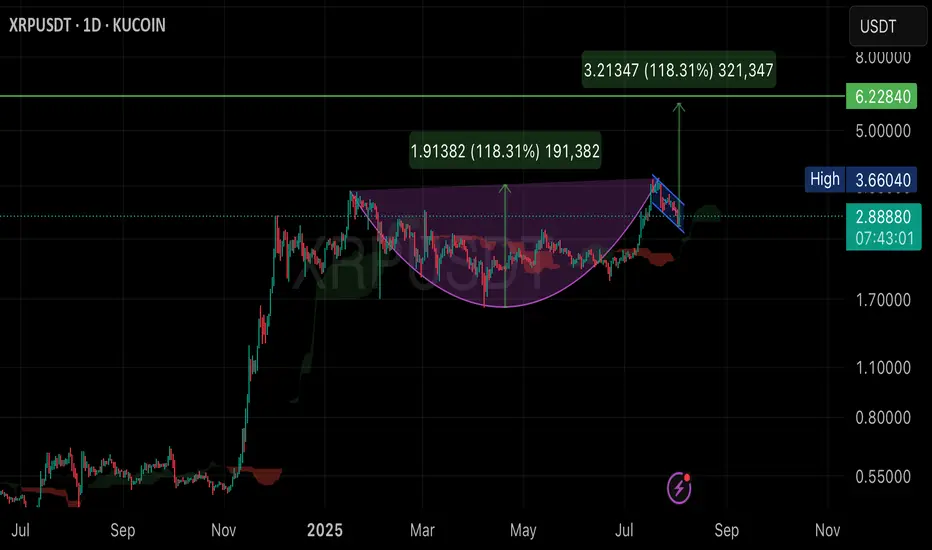
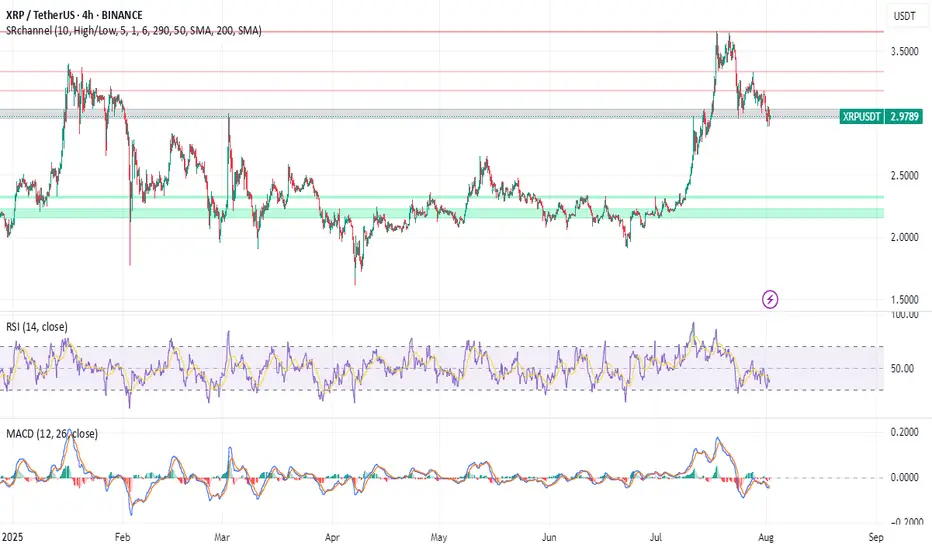
XRP doing Cup with handle pattern?technical analysis chart of the XRP/USDT using daily data (1D). Here are the main details:
• Cup and Handle Pattern: The chart displays a “cup and handle” formation, which is a bullish continuation pattern suggesting further upward movement. The rounded shape below represents the “cup” (running from roughly February to July 2025), and the small channel to the right is the “handle.”
• Target Price:
• The chart shows a projected breakout target from the handle region—from about 2.88 USDT to 6.22 USDT.
• The value 1.91382 (118.31%) is the measured move—calculated from the bottom of the cup to the neckline, then projected upwards from the breakout point.
• Another label, 3.21347 (118.31%), shows a similar projected percent gain (about 118.31%) from the breakout point.
• Support and Resistance Lines:
• Horizontal lines mark key levels, such as 3.66 (recent high) and 6.22 (target).
• Other Indicators:
• The chart uses a red moving average and Ichimoku cloud to highlight trend support and resistance zones.
• Current Status:
• The current price is 2.88881 USDT (up 4.30% on the day).
• A blue channel represents the consolidation phase before an anticipated breakout.
Summary:
This chart suggests that, if there’s a breakout from the “cup and handle” pattern as shown, the next target price for XRP is around 6.22 USDT, representing an estimated 118% gain from the breakout point. The analysis uses technical patterns and indicators to project possible future price movements.
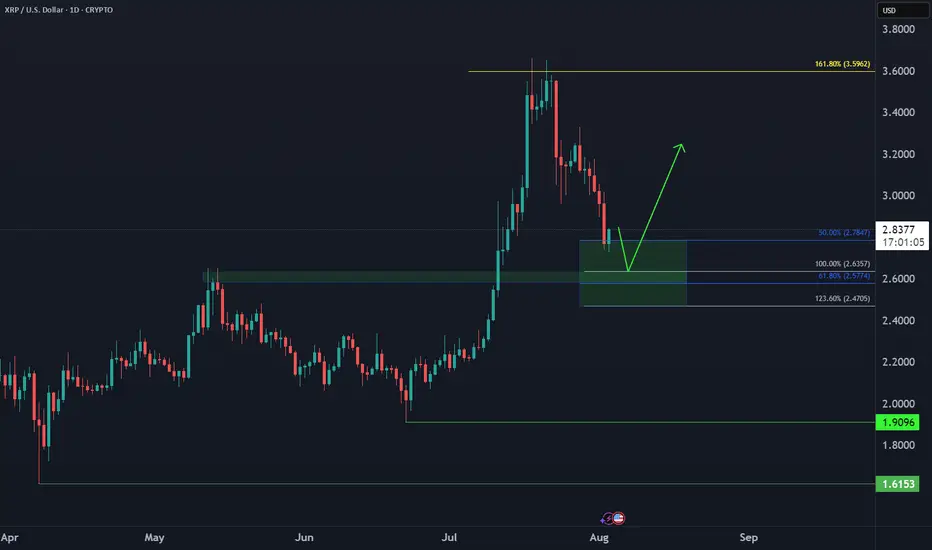
Ripple XRP Bullish Reversal📈 CRYPTO:XRPUSD dropped in 3 swings vs June low, now in buy zone $2.78–$2.47. Marginal lows still possible, but bounce expected next week from this extreme area.
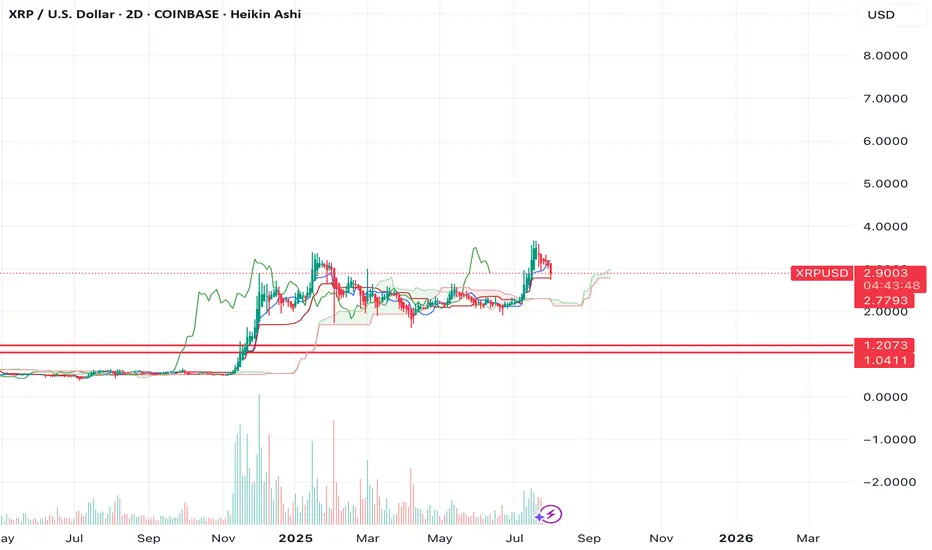
$XRP ENJOYERRRs see ya at $1.04-$1.20If we look at the chart of XRP, you can see that since the move in fall of 2024, we've had a massive lack of balance on the chart.
We ran up quickly without testing any levels as support.
That makes me think we're going to see the lack of balance get corrected and the same move is now going to happen in the opposite direction.
The $1.04-1.20 region looks like a good area of support to me.
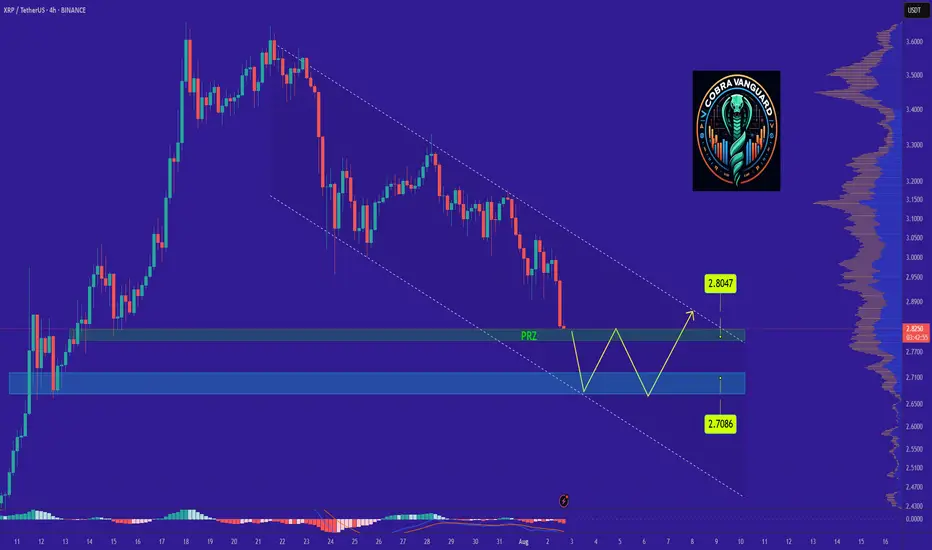
XRPs Situation (Daily) !!!If the price loses the PRZ range, it will drop to the bottom of the channel and then rise to the top of the ascending channel, which will take some time.
Best regards CobraVanguard.💚
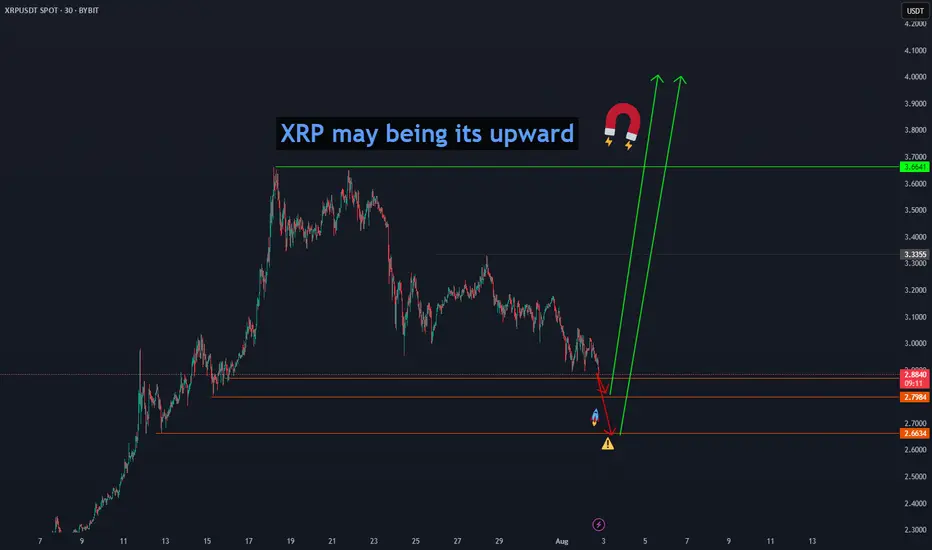
XRP may being its upward" Ripple (XRP) may begin its upward move from the price levels of 2.8865, 2.7984, and 2.6634, aiming for a first confirmed target at 3.6641 and then $4." BINANCE:XRPUSDT
The Great XRP Escape Plan: Thief Strategy Deployed🌀 XRP/USDT – Thief Trader’s Master Heist Plan: Crack the Vault Before They Catch On! 🧠💰
🔐💸 Operation Code: Ripple Raid 3.9 - Eyes on the Prize, Hands on the Trigger 💥
🌍 Attention Global Market Robbers and Strategic Money Movers!
This ain't just another analysis—this is the Thief Trading Style Blueprint, surgically designed for the XRP/USDT Crypto Market. Whether you're a silent sniper or full-squad raider, this trade setup is your next high-voltage money heist.
🔍 Market Breakdown:
📊 Technical + Fundamental = Robbery Precision
Currently, Ripple (XRP) is showing bullish fuel—charging into our trap-the-bears zone. Volatility is tightening, resistance is trembling, and it smells like liquidity is about to get stolen.
⚠️ Warning: The market’s at a risky cross-zone – overbought with heavy consolidation – where big bears and trapped traders usually play defense. That’s exactly where we strike.
🔓 Entry Gameplan – “Wait, Trigger, Execute”
📈 Entry:
"The heist begins when the candle breaks the high and screams confirmation!"
Set Buy Stop Orders above the recent resistance (around 3.1000).
Alternatively, use Buy Limit Orders on pullbacks at key swing levels (15M or 30M timeframes).
We use a multi-layered entry strategy (aka DCA + stacking like a pro thief stacking vaults). Be surgical. Be patient.
📌 Pro Tip: Always set a chart alert at the trigger zone to avoid missing the breakout party.
🛑 Stop Loss – “Breakout First, Then Talk Safety”
🚫 NO SL BEFORE BREAKOUT. Period.
Once price breaks out, then:
🔐 SL = Nearest 4H candle wick swing low (around 2.8000).
But remember, your SL = your risk appetite.
Whether you're placing 1 big order or 10 mini traps, manage it smart.
🎯 Target – "Get Rich, Then Vanish"
🏴☠️ Primary Take Profit Zone:
Target: 3.9000
Or exit anytime you see signs of reversal.
Don't get greedy—get paid.
👀 Scalpers’ Note:
Only play the Long side.
If you're deep-pocketed, dive in straight. If not, ride with swing traders and trail your SL to protect profits.
🔥 Why This Trade is 🔐:
📈 Current price structure, liquidity zones, and momentum favor bulls.
📊 Correlated intermarket signals + on-chain activity + macro backdrop align with XRP strength.
🧠 Smart money accumulation is visible – this is your window before the big breakout.
🚨 News & Position Management Alert:
📢 Stay clear of opening trades during major news events.
Use Trailing Stop-Loss on running positions to lock gains while letting profits fly.
This is not hype. This is precision.
Thief Trader doesn’t guess – we plan, we trigger, we exit.
📌 Final Words:
Whether you're scalping seconds or swinging for days – follow the blueprint. XRP has a vault to crack, and we’re here to rob it clean.
Now go out there, set those traps, and let the market pay you like it owes you.
🧠💸🕶️ Next Heist Plan Coming Soon… Stay Sharp.

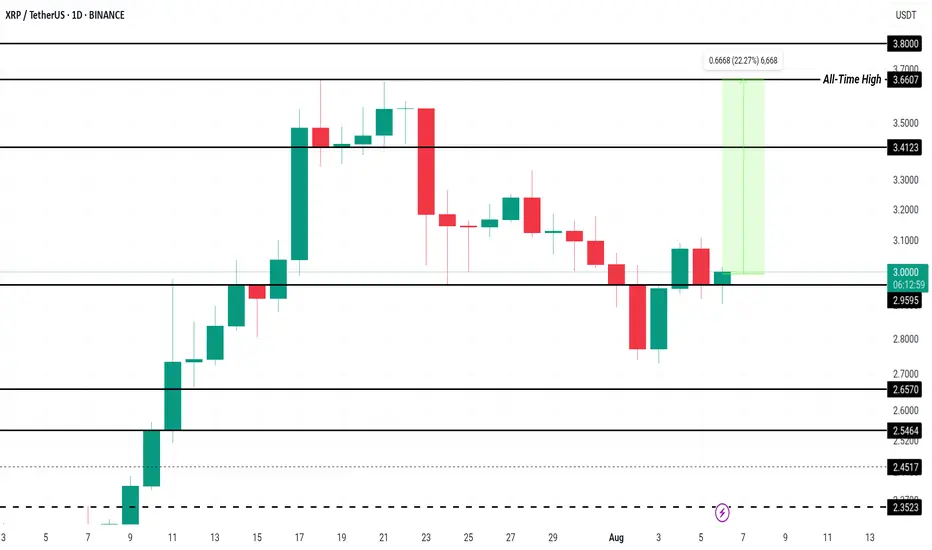
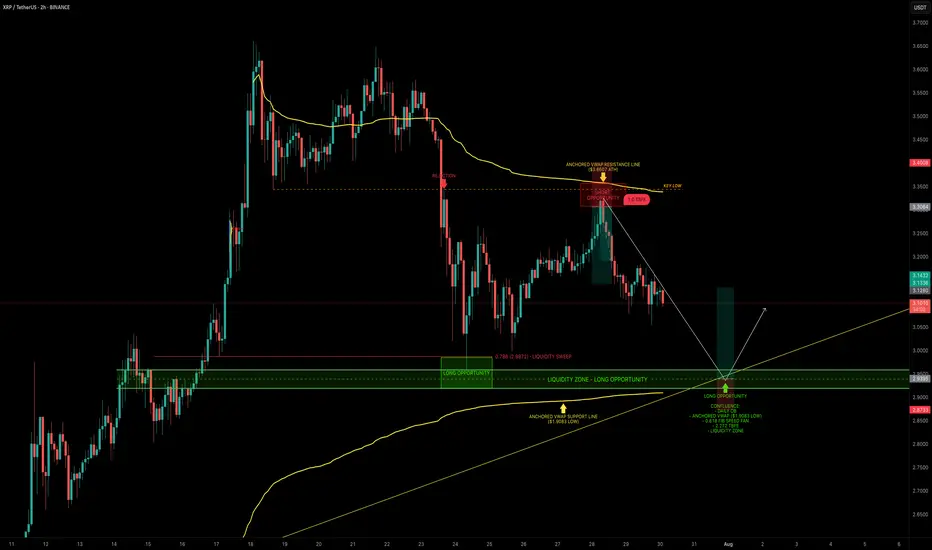
XRP — Mapping Out the Next High-Probability Long SetupXRP continues to respect key levels, delivering clean setups and strong technical reactions.
📉 Recent Price Action Recap
After the flush from $3.65 into the $3.00 support zone, XRP printed a solid bounce back toward the $3.30 resistance area, forming a clean short setup between $3.30–$3.35.
Price is now trading mid-range within the 6-day consolidation.
🟢 Next High-Probability Long Setup
A prime long opportunity lies between $2.96 and $2.9175 sitting within a key daily order block.
Confluence at this zone includes:
Liquidity pool just below the $2.9555 swing low
Anchored VWAP from the $1.9083 swing low resting just under the block
0.618 Fib Speed Fan lining up as dynamic support (July 30 – Aug 2)
2.272 Trend-Based Fib Extension at $2.9297
📈 Long Trade Setup
Entry Zone: $2.96 – $2.9175
Stop Loss: Below anchored VWAP (clear invalidation)
Target: $3.1/$3.13+
R:R: ~1:3+
💡 Educational Insight
This setup is a great example of how multiple tools layered together (like Fibonacci levels, VWAPs, order blocks and liquidity zones) can significantly increase the probability of a trade playing out.
When structure, volume-based tools and time alignment all point to the same area, it creates a high-confluence trade zone. These are the areas where risk is most defined and reward is most favourable, a principle every technical trader should anchor their strategy around.
_________________________________
💬 If you found this helpful, drop a like and comment!
Want breakdowns of other charts? Leave your requests below.
XRP Price Prediction: Is a Breakout to $15 Imminent? XRP Breakout Targets $15 — Analyst Says 'This Is Just The Start': Is XRP Set to Explode?
The cryptocurrency world is once again turning its attention to XRP, the token developed by Ripple Labs, as bullish analysts predict an imminent and explosive rally. After a strong run-up earlier in 2025, XRP has pulled back slightly and is now approaching a critical support zone. Some analysts are now calling for a $15 breakout target, even as the token hovers near $2.80, a level many see as a pivotal point for the next leg of the bull market.
Let's dive into the latest developments, technical analysis, and market sentiment surrounding XRP — and why some believe "this is just the start."
XRP Price Overview: Current Positioning
As of early August 2025, XRP is trading around the $2.85 mark, down from its recent high near $3.70. While this pullback may concern short-term traders, technical analysts argue that this retracement is healthy and necessary for the formation of a higher low, a common pattern in bullish market structures.
The key price levels to watch include a support zone between $2.80 and $2.95, resistance at $3.70, downside risk to $2.20 if $2.80 fails, and upside targets of $5 in the short term and $15 in the mid-term.
Why $2.80 Is So Important
The $2.80 support level is emerging as a make-or-break price zone. It aligns with multiple technical indicators including the 0.618 Fibonacci retracement from the previous rally, the Value Area High (VAH) from recent price accumulation zones, and Higher Time Frame (HTF) structure showing consistent support around this level in recent months.
If XRP manages to hold this level and establish a higher low, it could kick off a new bullish wave, potentially targeting $5 in the short term and beyond in the medium term.
Analysts Call for $15 XRP — Is It Possible?
Several key factors support the bull case. Institutional interest continues to grow as Ripple's partnerships with banks and financial institutions support long-term utility. Legal clarity has improved significantly after years of regulatory uncertainty, with the SEC lawsuit largely resolved, removing a major overhang. Technical indicators including bullish divergence on the RSI, MACD bullish crossover, and increasing volume all support upward momentum. Additionally, as Bitcoin stabilizes, funds are flowing into major altcoins, including XRP, as part of the typical altcoin rotation cycle.
August Rally Incoming? Bullish Divergence Signals 20% Upside
Technical analysts have identified a bullish divergence forming on the daily and 4-hour charts — a classic signal that often precedes a strong move upward. This divergence appears as the price makes lower lows while the RSI makes higher lows, suggesting momentum is shifting in favor of the bulls.
If confirmed, this divergence could catalyze a 20% rally in August, potentially pushing XRP back above $3.40 and testing the critical $3.70 resistance. A clean break above this level would likely open the floodgates for further gains.
$3.70: The Gatekeeper to Higher Highs
While there's excitement around the potential for XRP to hit $5 or even $15, the path forward must first go through $3.70. This resistance level has stalled price action multiple times in 2025 and will likely serve as a psychological and technical barrier.
Two scenarios are possible: a break above $3.70 would open the door to $5 and $7 targets quickly, while a rejection at $3.70 could lead to a pullback toward $2.20, especially if $2.80 fails.
Traders Hedge With New XRP Rival: Remittix
As XRP consolidates, some traders are diversifying their holdings into Remittix (RTX), a new cross-border payments token that promises enhanced scalability and compliance tools. RTX has gained traction recently, especially among DeFi-native traders seeking alternatives to XRP's centralized development model.
Remittix highlights include strong tokenomics with a deflationary model and staking rewards, a real-world use case targeting remittance markets in Asia and Africa, and a PayFi Wallet with beta slated for launch in Q3 2025, offering seamless integration with fiat on/off ramps.
While Remittix is gaining momentum, XRP's brand recognition, liquidity, and institutional partnerships still give it a significant edge in the payments space.
XRP Price Forecast: Short-Term and Long-Term Outlook
In the short term over the next 30 days, the bullish scenario involves holding $2.80 support, breaking $3.70, and rallying to $5. The bearish scenario would see XRP lose $2.80, drop to $2.20, and consolidate.
For the mid-term outlook in Q4 2025, if the bullish trend continues and macro conditions remain favorable, XRP could target $7 to $10 by the end of the year. In a full altseason scenario, $15 is not out of reach, according to some analysts.
Key Catalysts That Could Drive XRP Higher
Several catalysts could propel XRP higher. Institutional adoption continues to expand as Ripple's partnerships, especially in the Middle East and Asia-Pacific, lay the groundwork for long-term utility. CBDC integration presents another opportunity as Ripple works with multiple central banks on developing Central Bank Digital Currencies. Any progress here could significantly boost XRP's real-world use.
ETP listings could bring new inflows as XRP may benefit from exchange-traded products in Europe and Asia, especially if more crypto-based ETFs gain traction globally. The macro environment also favors growth, with a dovish Fed, weakening USD, and rising crypto adoption all creating a fertile environment for altcoins like XRP to thrive.
Community Sentiment: Is the XRP Army Ready?
The XRP community, also known as the XRP Army, remains one of the most passionate and active in the crypto space. Social media sentiment has turned increasingly bullish, with hashtags like #XRPToTheMoon and #XRP15 trending on X (formerly Twitter).
However, analysts caution against overexuberance, noting that market cycles can be volatile and unpredictable.
Risks to Watch
While the bullish case is compelling, it's important to consider the risks. Macro-economic shocks from a sudden shift in interest rates or recession fears could impact crypto markets broadly. Regulatory setbacks remain possible — although Ripple has gained legal clarity in the U.S., future regulations in Europe or Asia could cause volatility.
Network risks from any technical issues or security breaches could erode trust and trigger selloffs. Competition from new projects like Remittix, Stellar (XLM), and other payment-focused tokens could eat into XRP's market share.
Final Thoughts: Is XRP Set to Explode?
With XRP hovering near a critical support zone at $2.80, all eyes are on whether bulls can defend this level and push the token back into an uptrend. If successful, the next moves could be explosive, with analysts forecasting $5 in the short term and potentially $15 or higher before the end of 2025.
While risks remain, the technical setup, improving fundamentals, and renewed community optimism all point toward a bullish continuation — if key levels hold.
As always, investors should stay informed, manage risk, and avoid emotional decisions in this fast-moving market.
Summary
XRP currently trades around $2.85 with key support at $2.80 and major resistance at $3.70. Short-term targets point to $5 while mid-term projections suggest $10 to $15 is possible. Downside risk exists to $2.20 if support fails. Bullish catalysts include legal clarity, growing utility, and increasing adoption, while bearish risks encompass macro shocks, competition, and potential regulation.
Disclaimer
This article is for informational purposes only and is not financial advice. Cryptocurrency investments are highly volatile and involve significant risk. Always do your own research (DYOR) and consult with a financial advisor before making investment decisions.
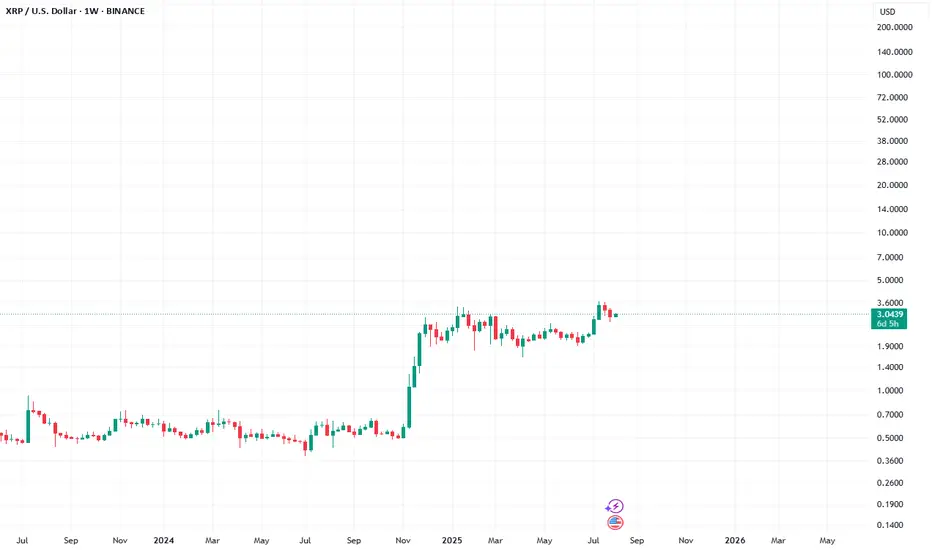
Xrp - The final bullish breakout!💰Xrp ( CRYPTO:XRPUSD ) will create new all time highs:
🔎Analysis summary:
After a consolidation of an incredible seven years, Xrp is finally about to create new all time highs. With this monthly candle of +40%, bulls are totally taking over control, which means that an altcoin season is likely to happen. And the major winner will simply be our lovely coin of Xrp.
📝Levels to watch:
$3.0
🙏🏻#LONGTERMVISION
SwingTraderPhil

What To Expect From XRP In August 2025?Currently, BINANCE:XRPUSDT is trading at $2.99, slipping through the key support level of $3.00. While the altcoin is still over 22% away from its ATH of $3.66 , the foundation for potential growth remains strong. Historical data has shown that August typically brings bearish momentum for BINANCE:XRPUSDT , with median monthly returns of -6% .
However, given the strong buying activity observed recently and the positive technical indicators, this August might defy the usual trend. If BINANCE:XRPUSDT manages to secure support above $3.41, the altcoin could push towards its ATH once again . Alexis Sirkia, Captain at Yellow Network, discussed with BeInCrypto how XRP’s future could be looking like.
“Institutions that have been in the market for a while are gaining momentum. We're also, in the meanwhile, in a macro environment where funds are doing risk rotation… BINANCE:XRPUSDT is taking its stand with regulation and infrastructure, not hype. That's what will endure in the long run. Short-term flows are fleeting, but the groundwork laid today will define the cycle to follow.”
However, there’s a downside risk. If BINANCE:XRPUSDT fails to reclaim the $3.00 support, the price could fall to $2.65, invalidating the bullish thesis. A drop to this level would mark a four-week low and would likely lead to further selling pressure.
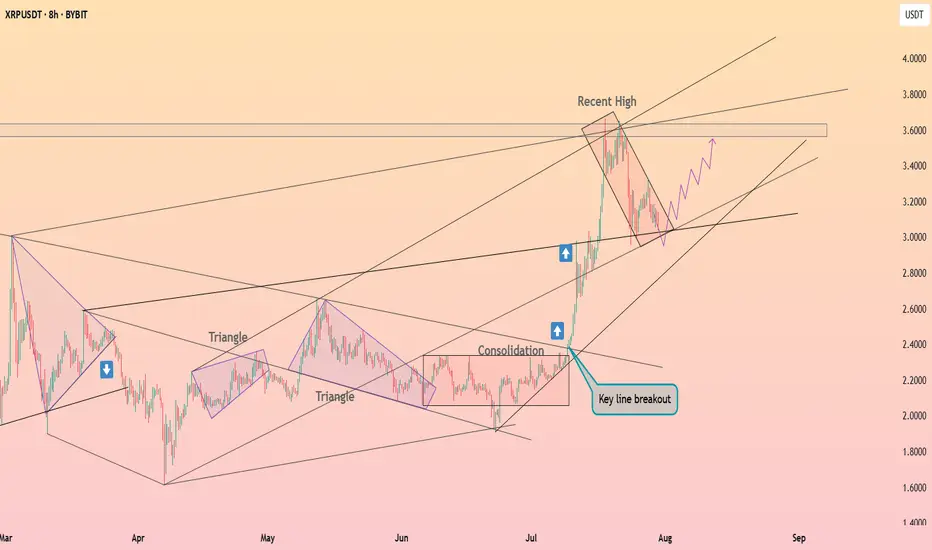
XRP is testing a support ┆ HolderStatBYBIT:XRPUSDT recently broke out of a long consolidation and triangle setup, rallying into the 3.60 region. It is now forming a falling channel — a common bullish continuation pattern. Price must hold the 3.10–3.20 support area for a renewed move toward 3.80–4.00. The broader structure remains bullish until invalidated.
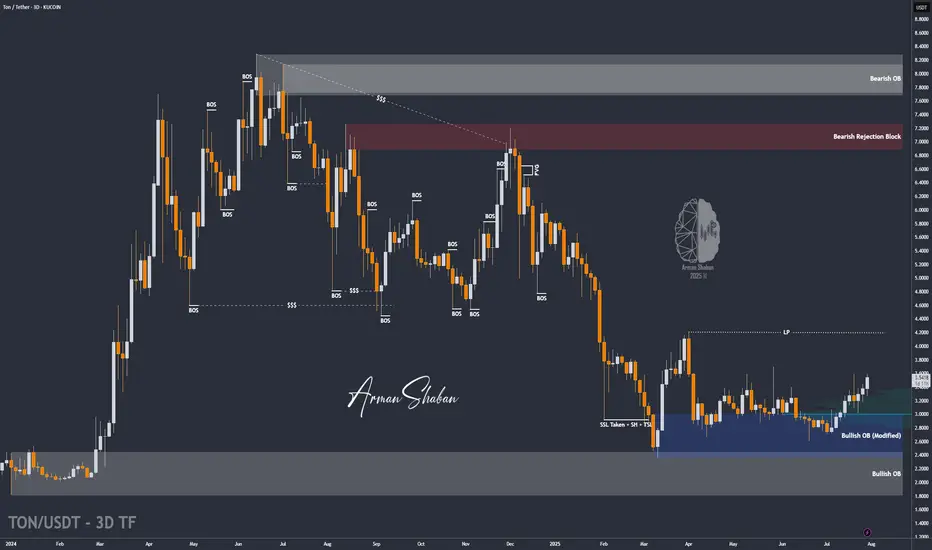
TON/USDT | Surges 18% – Eyes on $3.63, Then $4.20 and $4.68!By analyzing the Toncoin chart on the 3-day timeframe, we can see that after a pullback to the $3 area, strong demand kicked in, and within just one week, the price surged over 18%, reaching above $3.5. Toncoin is currently trading around $3.53, and I expect it to hit the $3.63 target soon. The next bullish targets after that are $4.20 and $4.68.
Please support me with your likes and comments to motivate me to share more analysis with you and share your opinion about the possible trend of this chart with me !
Best Regards , Arman Shaban
$XRP Historical Golden Ratio - Weekly Timeframe The Historical Golden Ratio (HGR) is the Fibonacci-based market analysis methodology that I created in 2020 (but really discovered). It identifies critical price inflection points by applying Fibonacci in a very unique and fundamental way. It may appear complex from the outside to new and even experienced technical analysis, but under the hood is a very simple and logically built engine that only has two critical parts really. However, it reveals an underlying structure within markets that appears to be fractal-based and dictated by the Golden Ratio. For the experienced market participant, time behind the wheel will reveal that the driving force behind markets has been in plain sight all along; M = φ * H(t) * e^(k * I(t))

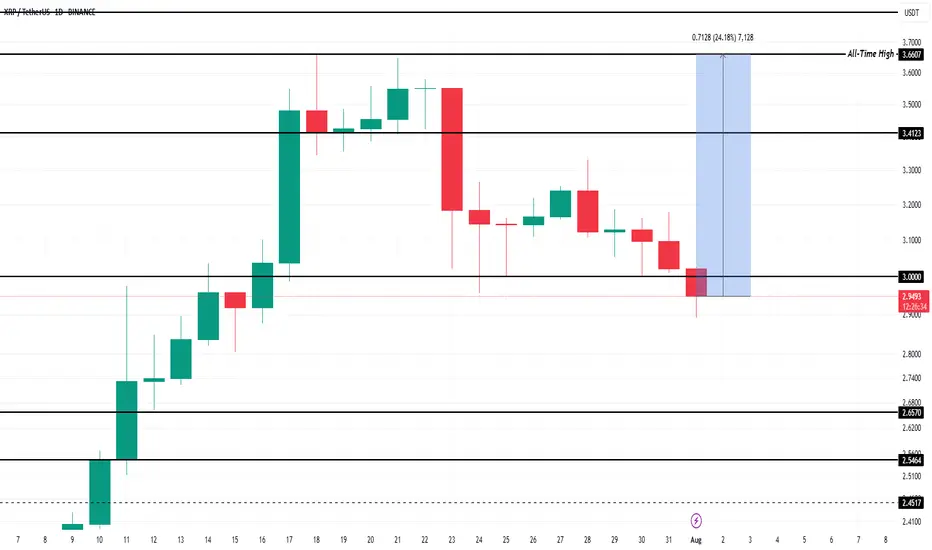
XRP WHERE ARE WE HEADED ? LEVELS TO LOOKOUT FORHey trading fam
So XRP is a fun one but based on BTC correcting and what we are seeing there are a couple thesis's that we currently have for it
Thesis 1: We break south from 2.98 lows: Levels to look out for:
2.80
2.70
2.68
Thesis 2: We break the highs of 3.29: Levels to look out for:
3.65
3.79
3.99
Trade Smarter Live Better
Kris
XRP held the support line ┆ HolderStatBINANCE:XRPUSDT is holding above $0.685 support after a correction from recent highs. Price is stabilizing inside a horizontal channel, with buyers defending the bottom of the range. A clean push above $0.70 would reopen the path toward $0.75. The market is at a decision point with strong reactions at both ends of the range.