XRP Weekly-Monthly Analysis / Retracement Levels for BuyWeekly - Monthly trend: Bearish
Chart Pattern: Head & Shoulders (H&S) - Bearish Continuation Pattern
Bearish Candlesticks signals:
HANGING MAN (Bearish, Single Candlestick pattern) / Weekly Timeframe / 09 DEC 2024
BEARISH ENGULFING (Bearish, Double Candlestick pattern)/ weekly Timeframe / 27 JAN 2025
TWEEZER TOP (Bearish, Double Candlestick pattern) / 1 Day timeframe / 20 FEB 2025
FALLING THREE METHODS (Bearish, five-fold Candlestick pattern) / 1 Day timeframe / 07 MAR 2025
Retracement Fib Price Levels:
0.00% (3.4000)
23.60% (2.6879)
38.20% (2.2474)
50.00% (1.8914)
61.80% (1.5353)
78.60% (1.0284)
100.00% (0.3827)
Good prices for buy (the lower the better):
61.80% (1.5353) – Golden Zone / Golden Pocket
78.60% (1.0284) – Entry Zone
Between 78.60% (1.0284) and 100.00% (0.3827) is the Risk Zone, which we have the Neckline of the ‘’ Quadruple Bottom Pattern ‘’ at the price range ‘’ 0.6291 – 0.7850 ‘’
I am having buy limit at 0.78500 on the neckline of ‘’ Quadruple Bottom Pattern ‘’.
Ripple

Ripple (XRP)Xrp usdt Daily analysis
Time frame daily
Risk rewards ratio >1.5
Short position ↘️↘️
Bad news for Ripple investors
Head and shoulders pattern is created
So I think , maybe xrp fall down to 1.7$

Is a Retest of $2 Inevitable for Ripple’s Next Move?Hello and greetings to all the crypto enthusiasts, ✌
All previous targets were nailed ✅! Now, let’s dive into a full analysis of the upcoming price potential for Ripple 🔍📈.
Ripple is approaching a crucial daily resistance level, which could trigger a notable price correction. A potential decline of at least 20% is expected, bringing the price down to the trendline acting as a strong support zone. Meanwhile, the key target remains the $2 level, which aligns with a major daily support area. Given its psychological significance, a retest of $2 is highly probable before the next market move.📚🙌
🧨 Our team's main opinion is: 🧨
Ripple is nearing a major resistance, likely facing a 20% drop to trendline support, while $2 remains the key target and a strong psychological support level. 📚🎇
Give me some energy !!
✨We invest hours crafting valuable ideas, and your support means everything—feel free to ask questions in the comments! 😊💬
Cheers, Mad Whale. 🐋

AND THESE LITTLE PIGGIES CRIED WAAH WAAH ALL THE WAY HOMEIf you haven't realized yet or maybe you all cant read properly but your hopes of getting into the crypto reserve are long gone. Not only that but they intend to sell the forfeited and seized digital assets other than Bitcoin to buy more Bitcoin. REJECTED!


Phemex Analysis #65: Pro Tips for Trading XRPIn the dynamic world of cryptocurrency, few narratives are as compelling as that of XRP ( PHEMEX:XRPUSDT.P ), the digital asset developed by Ripple Labs. Once mired in regulatory challenges, XRP is now entering an exciting phase, reshaping its path and sparking renewed discussions about its future potential.
Crypto Strategic Reserve
On March 2, 2025, President Donald Trump announced the creation of the U.S. "Crypto Strategic Reserve," aiming to position the United States as a leader in digital finance. XRP was among the select cryptocurrencies—including Bitcoin, Ethereum, Solana, and Cardano—chosen for this reserve. This announcement sent waves through the market, significantly boosting XRP's value and reaffirming its importance in the cryptocurrency ecosystem.
White House Crypto Summit
Anticipation is building for the upcoming White House Crypto Summit on March 7, 2025. Ripple’s CEO, Brad Garlinghouse, along with other industry leaders, will discuss regulatory frameworks and the integration of cryptocurrencies into the broader financial system. This event is expected to provide insights that could influence XRP's adoption and market dynamics.
These developments mark a pivotal moment for XRP, highlighting Ripple’s evolution from controversy to prominence and underscoring the cryptocurrency’s growing significance in the financial sector.
Possible Scenarios for XRP Price Movement
1. Sustained Bullish Momentum
The inclusion of XRP in the U.S. Crypto Strategic Reserve has bolstered investor confidence. This endorsement may attract institutional investors, increasing demand and potentially driving XRP's price higher. If the White House Crypto Summit results in favorable regulatory outcomes, XRP could experience sustained bullish momentum.
Pro Tips:
Monitor Institutional Involvement and Regulatory Developments: Positive news in these areas can further fuel XRP's bullish momentum.
Key Resistance Levels: A breakout above $2.65 could signal a bullish run, with a move above $3.00 on high volume confirming this trend.
2. Profit-Taking and Short-Term Correction
After recent gains, some investors might take profits, leading to a short-term price correction. This is common following rapid price increases as traders seek to realize gains.
Pro Tips:
Identify Support Levels: Key support levels include $2.12, $1.95, $1.76, and $1.35, where buying interest may resume.
Consider Staggered Entries: To mitigate volatility, consider placing buy orders at various support levels. Utilizing Phemex's scaled orders feature can streamline this process.
3. Regulatory Uncertainty Leading to Volatility
While the summit aims to provide regulatory clarity, outcomes perceived negatively by the market could lead to increased volatility. Uncertainty in regulatory developments can cause rapid price fluctuations as investors react to new information.
Pro Tips:
Implement Risk Management Strategies: Use stop-loss orders and appropriate position sizing to protect against adverse price movements.
Diversify Investments: Avoid overexposure to XRP by diversifying your cryptocurrency holdings to manage risk effectively.
Final Thoughts
XRP's inclusion in the U.S. Crypto Strategic Reserve and the upcoming White House Crypto Summit have positioned it at a critical juncture. Traders should stay vigilant, keeping informed about institutional developments and regulatory changes that could impact XRP's price. By considering the scenarios outlined above and implementing sound risk management practices, traders can navigate the evolving landscape of XRP trading with greater confidence.
Tips:
🔥 Break free from "buy low, sell high"! Our new Pilot Contract empowers you to profit from ANY market direction on DEX coins with up to 3x leverage. Go long, go short, go further!
Check out Phemex - Pilot Contract today!
Disclaimer: This is NOT financial or investment advice. Please conduct your own research (DYOR). Phemex is not responsible, directly or indirectly, for any damage or loss incurred or claimed to be caused by or in association with the use of or reliance on any content, goods, or services mentioned in this article.

XRP's Battle for #2: Is $14 the Next Target?I’m starting to build a position on CRYPTOCAP:XRP below $2.10.
There is a topping pattern with a chance of continuation down below $2, but as long as $2 holds, the pattern has not yet fully developed.
I also like the strength XRP has shown, especially when most coins are making new lows. We can’t overlook the fact that this coin has had a multi-month breakout. Even if it invalidates my position here, I will continue to look for opportunities as long as BTC stays above $75K.
I’m aiming for above $14 😊, even though it seems far off, as the quarterly signal is still active. BINANCE:XRPUSDT

Explosive Growth of XRP: The Fifth WaveXRP’s 5th Elliott Wave rally represents a once-in-a-cycle opportunity for early adopters. With technicals aligning, institutional interest growing, and Ethereum’s dominance under threat, this is not merely a price swing—it’s a paradigm shift. Don’t miss the wave.
Alex Kostenich,
Horban Brothers.

xrpxrp usdt daily analyses
time frame daily
look at the chart
xrp is moving up and down slowly. when all of assets fall down in two week before , ripple was excepted
so I think if xrp break the red box (strong resistance) it can move to moon and my first target is 4.86$

XRP at a Crossroads! Will the Bulls Hold the Line?Yello, Paradisers! Is #XRP gearing up for another breakout, or are we about to see a deeper pullback? The battle at key levels is heating up, and the next move will separate the winners from the losers.
💎#XRPUSDT’s recent hyper pump was triggered by its major support zone at $2.00 – $1.95, where buyers stepped in aggressively. However, the move became unsustainable, leading to a sharp move back lower. Now, XRP is holding above the $2.30 – $2.20 support zone—a critical level that bulls must defend to keep the momentum alive.
💎If buyers maintain control of this support zone at $2.30 to $2.20 over the next few hours, we could see a recovery back toward the $2.70 – $2.80 resistance zone. However, breaking through this level won’t be easy, as XRP still faces key obstacles ahead.
💎The descending resistance, which previously rejected price spikes, remains a major hurdle. A clean breakout above $2.85 with strong volume would confirm real bullish strength and open the doors for a retest of the strong resistance zone at $3.20 – $3.30 levels which is XRP's recent all-time highs and this is the region where sellers are expected to step in aggressively.
Stay patient, Paradisers! The market always rewards discipline. If we see confirmation, we take action. If not, we wait. Trade smart, not fast! 🎖
MyCryptoParadise
iFeel the success 🌴

XRP | Know what you hold!XRP went on an absolute tear starting on November 3rd through mid-December during the 'Trump election pump,' but has pulled back and consolidated heavily. Even though we had a nice pump a few days ago when President Trump released his U.S. Crypto Reserve tweet, which featured XRP in the first position on the list, the price action has now retraced the majority of that move.
I wouldn't write off XRP just yet, and regardless of whether it drops more from current levels, there isn’t a crypto on the entire market that has the potential that XRP does moving forward—in my opinion.
Good luck, and always use a stop loss!

How are 'Stategic Reserve' assets going to react?? Weve had plenty of scepticism come out over inclusion of altcoins in the strategic reserves. News reports on it undermining the reserve.
We have also had Trumps cost cutting and tariffs pushing bearish pressure on the market. While ADA+XRP+SOL are sitting on previous all time highs. Even more troublesome is the unwinding of USDT.
This may pull away one of the largest liquidity providers to the crypto space. This can be extremely bearish.
I am myself however still bullish. I see rising fundamentals and a lot of room for upside in L1s and applications token price.

Trump’s crypto picks struggle: Saylor sees $200T market cap Bitcoin has fallen below the 78.6% retracement of Sunday’s surge and is now less than 2K above the level it was at when Trump tweeted about a strategic reserve including Bitcoin and a few altcoins.
Some of the smaller cryptocurrencies mentioned by Trump—Cardano, Solana, and Ripple—are holding up slightly better but have also dropped.
Strategy Executive Chairman Michael Saylor, whose company holds nearly 500,000 BTC, strongly endorsed Trump’s proposed strategic crypto reserve in a CNBC interview. Saylor also predicted Bitcoin’s market cap could reach $20 trillion and eventually $200 trillion, projecting a price of $13 million per BTC by 2045. In a bullish scenario, he sees Bitcoin hitting $49 million, while a bearish case could still put it at $3 million.

Trump Pumped the MarketTrump just dropped a game-changer: a U.S. Crypto Reserve, stacking Bitcoin (BTC), Ethereum (ETH), Ripple (XRP), Solana (SOL), and Cardano (ADA). He’s talking big, calling the U.S. the "Crypto Capital of the World." The market lost its mind: BTC surged 8% to $90,828, ETH jumped 13% to $2,516, and the altcoin crew, XRP, SOL, and ADA, exploded with gains of 33%, 22%, and over 60%, respectively. That was the initial rush. Over the last 12 hours, things have settled, prices are holding, but the hype’s taking a breather. All eyes are on the White House Crypto Summit for what’s next.
What’s Really Going On?
This could be massive. If the U.S. government starts holding crypto, it might drag big institutions into the game, and some solid regulations could calm the wild west vibes. But hold up, Trump’s got his own crypto side hustle (think meme coins and sketchy Justin Sun connections), which raises some red flags. The market loved the hype, huge spikes everywhere, but the quick cooldown shows traders aren’t fully sold yet. Other countries might panic or jump on the bandwagon, so expect more chaos either way.
Your Bags: Hold, Buy, or Bail?
If you’re sitting on BTC, ETH, XRP, SOL, or ADA, this could pump your portfolio long-term, especially if the summit brings real substance, not just noise. Trump’s involvement, though? That’s tricky, it could warp the market in unpredictable ways. Details are thin, and crypto’s still a rollercoaster. The big pump was exciting, but the quiet after suggests we’re in a wait-and-see spot. Hard proof always trumps promises.
How to Trade This (No Nonsense)
Know Your Coins: Don’t jump in blind. BTC’s the heavyweight champ, ETH’s the smart money, XRP’s got speed, SOL’s lightning, ADA’s eco-friendly, pick what fits your style.
Spread It Out: This market’s a monster, mix in some stablecoins or stocks so you’re not riding one wave.
Stay Sharp: X is your go-to for real-time buzz, cross-check with CoinDesk and Reuters, but filter the noise. Summit news will shake things up.
Protect Yourself: Set stop-losses, volatility’s brutal, and headlines flip on a dime.
Key Levels to Watch: Set alerts, BTC’s $90k- GETTEX:92K is the big fight, ETH’s $2,500 is critical, XRP’s $2.17-$2.50 could swing hard. Stay tight on these.
The Bottom Line:
Trump’s crypto move rattled the cage, but it’s not a free ride. Keep your wits about you, watch those levels, and don’t chase the hype blindly. The summit’s the next big trigger, brace for impact. This is a chess match, not a quick gamble, so trade smart and guard your stack.

TradeCityPro | XRP: Key Levels After Major Market News👋 Welcome to TradeCity Pro!
In this analysis, I want to review XRP, one of the most significant coins in the market. Yesterday, a major news update was released about XRP, and with a market cap of $156 billion, it currently ranks 3rd on CoinMarketCap.
📰 Important News Update
Before starting the analysis, let’s go over the major news regarding this project. Yesterday, former U.S. President Donald Trump tweeted that he plans to add a crypto reserve to the U.S. Treasury, stating that major cryptocurrencies like BTC, ETH, SOL, ADA, and XRP would be purchased by the U.S. Treasury.
✅ This is extremely bullish news for the market. As we saw yesterday, Bitcoin made a strong, sharp move, and the altcoins listed in the announcement also experienced massive price surges. For example, XRP surged by 30% following the news.
💥 I will discuss Bitcoin and other coins in future analyses, so make sure to check out today’s Bitcoin analysis, where I’ll also cover long-term scenarios.
📅 Weekly Timeframe
On the weekly timeframe, as seen on the chart, after bouncing along the ascending trendline, XRP confirmed its breakout above $0.73056, which initiated the main bullish leg, pushing the price up to $3.06717.
🧩 $3.06717 is the all-time high (ATH) and a major supply zone.If XRP can hold above this level, the next bullish leg could begin.
✨ In the event of a correction, the only key support visible on the weekly timeframe is $1.67220. For further support levels, we need to analyze lower timeframes.
🔍 The RSI oscillator has exited the overbought zone and returned to normal levels.If RSI re-enters overbought conditions, the bullish scenario becomes more likely.
📅 Daily Timeframe
On the daily timeframe, the first key observation is a strong bearish divergence on the RSI, which formed as price moved sideways inside the range between $2.02967 and $3.30467.
⚡️ The trigger for this divergence is a break below $2.02967, which has not yet happened.
Looking at market volume, after the $0.72448 breakout, volume significantly increased. However, volume has been gradually decreasing since the formation of the range.
📊 A drop in volume before a breakout often signals that a breakout is approaching.If volume continues to decline, be prepared for a potential breakout and enter positions accordingly once triggers are confirmed.
📉 If the range breaks downward, and the PRZ at $2.02967 is lost, XRP could enter a deeper correction toward key Fibonacci levels such as 0.382, 0.5, and 0.618.
💫 These three Fibonacci levels are strong support zones, which could prevent a further sell-off.
📈 On the bullish side, if the range breaks to the upside, a new bullish leg will begin, pushing XRP toward higher targets.If this bullish breakout happens, I will update the analysis with potential new targets.
⏳ 4-Hour Timeframe
Let’s now analyze the 4-hour timeframe and identify futures trading triggers.
🔍 After the drop from the $3.36021 peak, the price reached the bottom of the range, and market volume significantly decreased.This signaled that a major move was approaching.
🔑 As seen on the chart, the release of the U.S. Treasury Crypto Reserve news triggered an explosive move, pushing XRP up to $2.95244.
🔽 For futures trading, the closest short trigger is a break below $2.30010.For earlier short entries, we need to wait for a new structure to form.
🛒 For long positions, if $2.95244 is broken, a long entry can be considered.The main resistance for spot buying and the key long position trigger is at $3.36021.
📝 Final Thoughts
This analysis reflects our opinions and is not financial advice.
Share your thoughts in the com

XRP strategic reserve announcment! UPDATED FORECASTAs indicated in prior post (see: ) we have now reached the near term liquidity target at 2.8-2.9 zone; this news of a strategic reserve is highly likely to be sold off to trap both bulls & bears who are over-leveraged.
They rarely waste a good PR for such price action.
Expecting one more liquidity sweep below 1.70 for a final discount buy opportunity!! Looking to enter with LIMIIT buy orders at 1.65 area; its possible that we extend as low as 1.35 but my mentality is its best not to be idealistic, perfectionistic, or entitled at those levels! The market does not owe you the best or lowest price on anything! For that reason, consider anything below 1.70 to be a huge gift with a big big bow wrapped around it!

...And Back to Trump Pump againTrading Fam,
Just Friday I made a video titled, "Trump Pump. Trump Dump." The Trump pump occurred b/c of the election. The Trump dump occurred b/c of the Tariffs. And now, we are back to a Trump pump cycle b/c of promises to a crypto reserve. I have a feeling that this may be how it goes for crypto for a while until the community can observe actual tangible action vs. verbal accolades and promised use. But enjoy those gainz now.
✌️Stew

Xrp to the MOON? SeekingPips Long Buying XRPUSD ALL DAY!⭐️ Now today I have tons of messages asking me about XRP ⭐️
❗️Ladies and gentlemen 🟢SeekingPips🟢 has been long bias for the past 4 years at least and especially long XRPUSD All year on this platform with plenty of before the fact TRADE CALLS .🚀🚀🚀
✅️ Now you know I wanted another dip below the shaded area mentioned last week on Saturday 22 February.
(Go Back & See For Yourself)
✅️ We got what we wanted and even a momentary sub $2 XRP
I hope you were filled on your LIMIT ORDERS.
⚠️ My exact words were "Just for the records tho sub $2 I fill my pockets"
❓️NOW WHAT❔️
🌍It's VERY EASY , knowing that over 90% of so called TRADERS LOOSE MONEY in the markets and ALSO that they ENTER THE MARKET IN A RUSH WITHOUT MUCH OF A PLAN but they will sit in a LOOSING POSITION for far TOO LONG and EVEN CLOSE THEIR POSITION as soon as they have a SLIGHT PROFIT.🌍
ℹ️ Your job can be VERY SIMPLE.
With knowing the above all one has to do to CAPITALISE ON THIS INFORMATION is the EXACT OPPOSITE.
⚠️You DON'T HAVE TO BE A GENIUS to make MONEY in the market but you do have to HAVE A PLAN and ACT ON IT RELIGIOUSLY ⚠️
$XRP/USDT is testing a strong support zone around $1.80 - $2.00,$XRP/USDT is testing a strong support zone around $1.80 - $2.00, aligning with the Point of Control (POC) and the 200 EMA ($1.80), which acts as dynamic support. This area has historically been a high-volume demand zone, making it a crucial level for a potential reversal.
If buyers step in and defend this level, XRP could rebound toward $2.50 - $3.00 in the coming weeks.
However, a break below $1.80 would weaken bullish momentum and could lead to a deeper correction, possibly toward $1.50 or lower.
DYOR, NFA

XRP pushing back up?XRP is currently trading at 2.235, hovering near a potential rising wedge breakdown, which often signals a bearish move. However, a key support zone between 2.17 and 2.27 could act as a safety net, potentially triggering a bounce if buyers step in. If this support holds, XRP might push back toward the resistance zone at 2.50–2.80, with a breakout possibly targeting 3.00. But if the price slips below 2.17, it could drop toward a deeper support at 1.77. These levels are critical, think of support as a floor and resistance as a ceiling where price action often reverses or stalls.
Technical indicators are leaning bearish but not overwhelmingly so. The price is near the 50-hour moving average (MA), staying above it would be bullish, while dipping below could invite more selling. The RSI is below 50, indicating weak momentum, and the MACD shows a bearish crossover, suggesting downside risk. Volume is steady, but a spike could confirm whether a breakout or breakdown is real. Watch these tools closely: a price bounce from support with rising volume and improving RSI/MACD could flip the short-term outlook.
Market sentiment is mixed, clouded by the ongoing SEC lawsuit against Ripple, which keeps some traders cautious. On the flip side, rumors of ETF approvals or new partnerships could spark a rally if confirmed. Social media reflects this split, some see a breakout to 2.80–3.00, others brace for a pullback to 1.77. To stay ahead, set alerts at 2.17 and 2.50, monitor volume for confirmation, and keep an eye on crypto news for updates. With uncertainty high, consider using stop-losses below 2.17 (if long) or above 2.50 (if short) to manage risk. Don't forget: patience is key.

XRPUSD - Key Support ConfirmationXRPUSD is currently forming a Descending Triangle, a continuation pattern that typically signals bearish momentum. The critical support level at $2.00 serves as a decisive point for price action.
A successful defense of this level could trigger a short-term bullish reversal, with the immediate target aligning with the triangle resistance at $2.56.
However, a confirmed breakdown below $2.00 would validate an AB=CD bearish continuation pattern, potentially extending the downtrend toward the major support at $0.64.
Traders should monitor price action around the $2.00 level, as its reaction will determine the next directional bias.

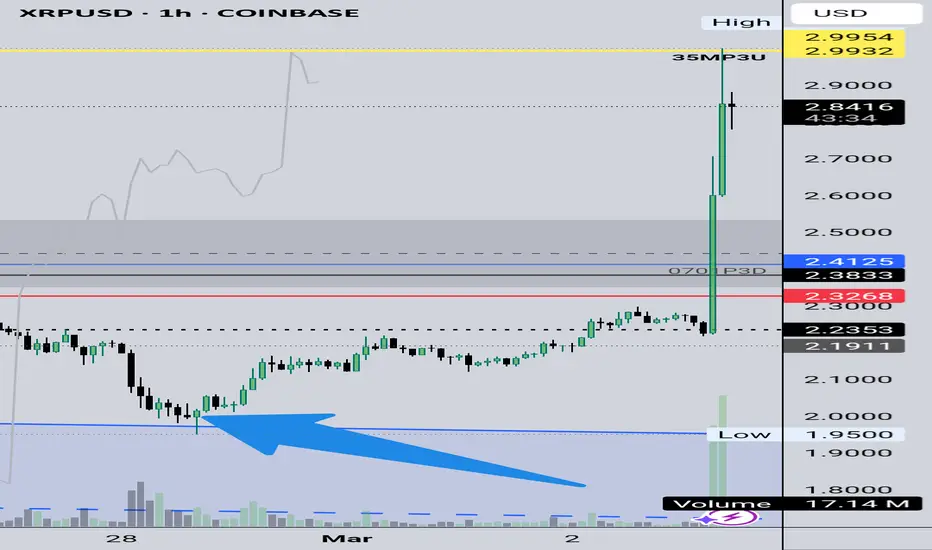
Be careful with RIPPLE !!!The price has formed a bullish wedge on the 1h time frame, and if it breaks out, it can drive the price up to around $2.8.
Give me some energy !!
✨We spend hours finding potential opportunities and writing useful ideas, we would be happy if you support us.
Best regards CobraVanguard.💚
_ _ _ _ __ _ _ _ _ _ _ _ _ _ _ _ _ _ _ _ _ _ _ _ _ _ _ _ _ _ _ _
✅Thank you, and for more ideas, hit ❤️Like❤️ and 🌟Follow🌟!
⚠️Things can change...
The markets are always changing and even with all these signals, the market changes tend to be strong and fast!!

XRP has TOPPED. you wouldnt believe it thoughxrp has topped. and should bottom around 65-75c.. just like in 2018 , 2021, no one thought the top was in.. just like what will happen now... oh well
