XRP's New Dawn: Beyond Bitcoin, Towards a Double-Digit Horizon
The cryptocurrency landscape is witnessing a seismic shift, and at its epicenter is XRP. In a stunning display of market dominance, the digital asset has embarked on a historic rally, fundamentally altering its perception and potential. Leaving the market's traditional bellwether, Bitcoin, in its wake with a colossal 277% outperformance over the past year, XRP has shattered its previous records. The token recently soared to a new all-time high of $3.66, pushing its market capitalization beyond the monumental $210 billion mark for the first time. This explosive growth, fueled by a confluence of regulatory triumphs, institutional validation, and overwhelming market momentum, has ignited the community and brought a once-fanciful question to the forefront of serious financial discussion: Is a $10 valuation the next logical destination for XRP?
This article delves into the multifaceted narrative behind XRP's meteoric ascent. We will dissect its remarkable outperformance against Bitcoin, explore the pivotal legal and regulatory victories that cleared its path, analyze the flood of institutional capital now entering the ecosystem, and examine the technical and on-chain data that suggests this rally may have only just begun.
Chapter 1: A Declaration of Independence - XRP's Decoupling from Bitcoin
For most of its existence, the cryptocurrency market has marched to the beat of Bitcoin's drum. Its price movements dictated the sentiment and direction for nearly all other digital assets. The year 2025, however, will be remembered as the year XRP declared its independence. The asset's 277% yearly surge against Bitcoin is not a mere statistical anomaly; it represents a fundamental rerating by the market, a recognition of XRP's unique value proposition, which is now unburdened by past uncertainties.
This divergence is starkly visible in recent trading. During the month of July alone, XRP appreciated more than 35% against Bitcoin, a powerful indicator of shifting capital flows and investor preference. While Bitcoin's narrative remains firmly rooted in its identity as "digital gold" and a hedge against inflation, XRP's story has evolved into one of proven utility and regulatory legitimacy. This newfound clarity has allowed its price to reflect its potential as a bridge currency for global payments and a cornerstone of a new, more efficient financial infrastructure.
The psychological impact of this rally has been profound. Prominent personalities like Dave Portnoy have publicly lamented selling their XRP holdings prematurely, echoing a sentiment of regret that is likely widespread among investors who exited their positions during the long years of legal ambiguity. This fear of missing out, while a potent market force, is not the sole driver of the current momentum. The rally is built upon a much sturdier foundation of institutional adoption and clear fundamental catalysts, suggesting a more sustainable trend than the speculative frenzies of the past.
Chapter 2: The Victory Lap - Regulatory Clarity as Rocket Fuel
The single most significant factor unlocking XRP's potential has been the definitive conclusion of its long and arduous legal battle with the U.S. Securities and Exchange Commission (SEC). The lawsuit, initiated in late 2020, had acted as a lead weight on the asset, alleging that Ripple's sales of XRP constituted an unregistered securities offering. This created a cloud of regulatory risk that kept many institutional investors and potential partners on the sidelines, particularly in the United States.
The tide began to turn with a landmark court ruling that determined XRP, when sold on public exchanges to retail customers, did not meet the definition of a security. This decision was a watershed moment, providing the legal clarity the secondary market desperately needed. The final chapter of this saga unfolded in 2025 as the SEC opted to drop its appeal and the parties moved to finalize a settlement. This resolution effectively ended the years of uncertainty that had suppressed XRP's value and stifled its adoption in the U.S.
This legal victory could not have come at a more opportune time. It coincided with a broader, increasingly constructive regulatory climate in Washington. The successful passage of several crypto-focused bills through the U.S. House has signaled a move towards establishing clear rules of the road for the digital asset industry. This favorable regulatory tailwind has not only vindicated Ripple's long-standing arguments but has also paved the way for the development of regulated financial products built around XRP, transforming it from a legally contentious asset into a compliant component of the future financial system.
Chapter 3: The Wall Street Endorsement - The Influx of Institutional Capital
With the legal clouds parted, the floodgates for institutional capital have swung wide open. The most tangible evidence of this is the enthusiastic race to launch XRP-based Exchange-Traded Funds (ETFs). An ETF is a mainstream investment vehicle that allows investors to gain exposure to an asset like XRP through their traditional brokerage accounts, representing a critical bridge between the worlds of crypto and traditional finance.
Financial services giant ProShares has led the charge, successfully launching a leveraged XRP futures ETF. The approval of such a sophisticated product by regulators is a powerful endorsement, signaling a high degree of comfort with XRP's market structure and legal standing. ProShares is far from alone; a veritable who's who of asset managers, including Bitwise and 21Shares, have also filed applications for their own XRP-based funds. The sheer volume of these filings from established Wall Street players underscores a deep and proactive institutional belief in XRP's long-term potential.
This institutional stampede is further reflected in the booming derivatives markets. Daily trading volume in XRP futures has swelled to over $235 million, while open interest—a measure of the total value of active contracts—has soared to a record high. This is the unmistakable footprint of large, sophisticated investors using these markets to speculate on and hedge their exposure to XRP. The recent price surge was amplified by a significant "short squeeze," where traders betting against XRP were forced to buy back their positions at higher prices, adding further fuel to the rally. This is not the behavior of a retail-driven fad; it is the mechanics of a market now dominated by serious institutional demand.
Chapter 4: Reading the Digital Tea Leaves - On-Chain and Whale Activity
A deeper look at the blockchain itself provides further compelling, if nuanced, insights. On-chain data reveals a fascinating dynamic among the largest holders of XRP, colloquially known as "whales." On one hand, there have been significant transfers of XRP from Ripple co-founder Chris Larsen to centralized exchanges, a pattern that often precedes selling. Throughout 2025, Larsen has moved hundreds of millions of dollars worth of the token, which could be interpreted as early insider profit-taking.
However, this potential selling pressure has been more than absorbed by a much broader trend of accumulation. Market data clearly shows a steady pattern of buying by other large, institutional-grade investors. It appears a new class of whales is confidently accumulating any supply that becomes available, creating a powerful and sustained tailwind for the price.
Adding a layer of data-driven optimism is the Market Value to Realized Value (MVRV) ratio. This advanced metric, which compares XRP's current price to the average acquisition cost of all coins in circulation, recently flashed a signal that has historically preceded enormous rallies. The last time this particular indicator showed a "golden cross," it heralded a massive 630% surge in XRP's price. While past performance is no guarantee of future results, this historical precedent provides a powerful data point that aligns perfectly with the bullish fundamental narrative.
Chapter 5: Charting the Uncharted - Price Analysis and Future Targets
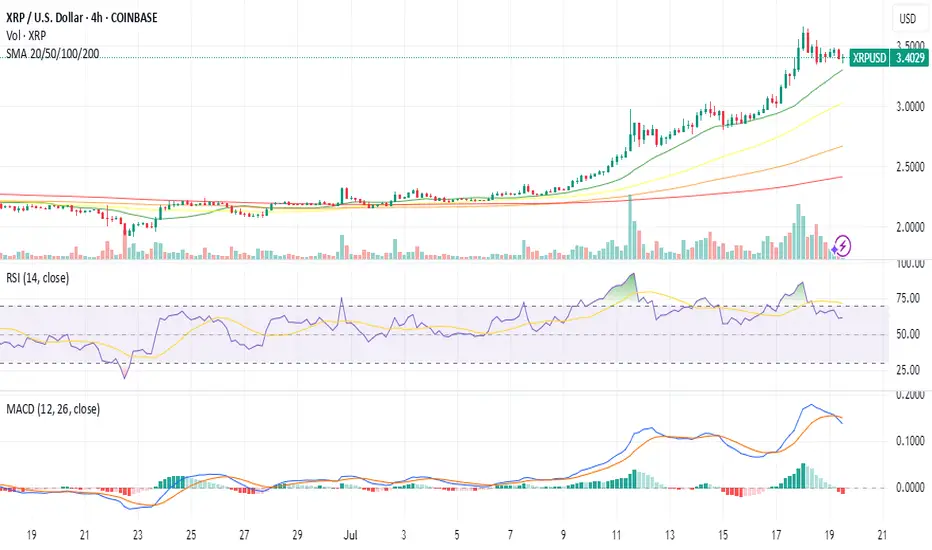
The culmination of these powerful catalysts has produced breathtaking price action. In a single 24-hour period, XRP's price leaped by 22%, decisively breaking its former all-time high and entering a phase of pure price discovery. Technical analysts have described the move as a textbook breakout following a long period of accumulation, a pattern that often leads to powerful and sustained upward trends.
With no historical resistance levels overhead, analysts are now turning to technical patterns and Fibonacci extension models to project potential future targets. A prominent "bull pennant" formation on the price charts suggests an astonishing long-term target of $14. More immediate, conservative targets are clustered around the $4.00 and $4.80 levels, which many believe are well within reach if the current momentum is maintained.
This brings the conversation to the ultimate question of a double-digit valuation. Can XRP realistically reach $10 or beyond? A growing chorus of analysts believes it can. Projections for the coming years vary, but many models point to a future where XRP trades comfortably in the double digits. Forecasts for 2030 range from a conservative $4.35 to more aggressive targets of $16, $22, and even higher. These predictions are not based on pure speculation but are rooted in the assumption that the institutional adoption unlocked by ETFs and Ripple's expanding global payment network will continue to drive demand and utility.
Conclusion: A New Era for XRP
XRP's recent performance represents more than just a bull run; it signifies a fundamental transformation. It has emerged from a crucible of legal and regulatory challenges not merely intact, but stronger, more resilient, and with a clear mandate in the world's most important financial market. This hard-won victory has unleashed a powerful synergy of positive forces: the validation of institutional capital, the tailwind of a favorable regulatory environment, and the overwhelming evidence of bullish technical and on-chain metrics.
Its decisive outperformance of Bitcoin marks a coming-of-age moment, proving that a digital asset with clear utility and legal standing can forge its own path and command its own powerful market narrative. While the future in any financial market remains unwritten, the convergence of factors supporting XRP has never been stronger. The conversation has irrevocably shifted. The question is no longer if XRP can reclaim its former glory, but rather how high its newfound momentum can carry it. For a rapidly growing number of investors, analysts, and institutions, the $10 price target has evolved from a distant fantasy into a plausible, and perhaps even imminent, reality.
Ripple
ADA/USDT | BIG Bullish Move Ahead! (READ THE CAPTION)By analyzing the Cardano chart on the 3-day timeframe, we can see that, as expected, the price continued its rally, reaching $0.89 before collecting liquidity above the $0.86 level and then facing a correction. Currently trading around $0.81, we expect the bullish trend to continue after this minor pullback. Key demand zones are at $0.78, $0.69, and $0.61. Based on the previous analysis, the next short- to mid-term bullish targets are $0.93, $1.05, and $1.33.
Please support me with your likes and comments to motivate me to share more analysis with you and share your opinion about the possible trend of this chart with me !
Best Regards , Arman Shaban

Be careful with RIPPLE !!!The pennant pattern has been broken, and the price follows an AB=CD pattern, targeting a rise above the 5 dollar.
Best regards CobraVanguard.💚

XRP's situation+ Target PredictionThe XRP is in a Bullish phase by a Falling Wedge Pattern.
A falling wedge indicates the potential for price to reach to $3.
Note if the PRZ ZONE is broken downwards with the strength of Bearish candles , this analysis of ours will be failed.
Best regards CobraVanguard.💚

XRPUSD - Why I see that Ripple even higherMedianlines, aka "Forks" have a simple but effective ruleset inherent. These rules describe the movement in certain situations. And of course, the most probable path of wher price is trading to.
Here we a rule in play that projects more movement to the upside, even if BTCUSD has had a strong pullback to the south.
Let's see:
If price is closing above a Centerline, then chances are high that it will retest it. If it holds and starts to continue it's path (to the upside), then the next target is the U-MHL, or the Upper Medianline Parallel, was Dr. Allan Andrews named it back many decades ago.
So, there we have it.
Chances are high that Ripple will reach new highs, with a final target at the U-MLH.

XRP rally to $8.50After XRP broke above the resistance at $1.80 now that became the major support for the past few months and XRP is taking off again.
According to this huge monthly triangle and calculate from the breakout, so the next target for XRP is $8.50 for the coming months.

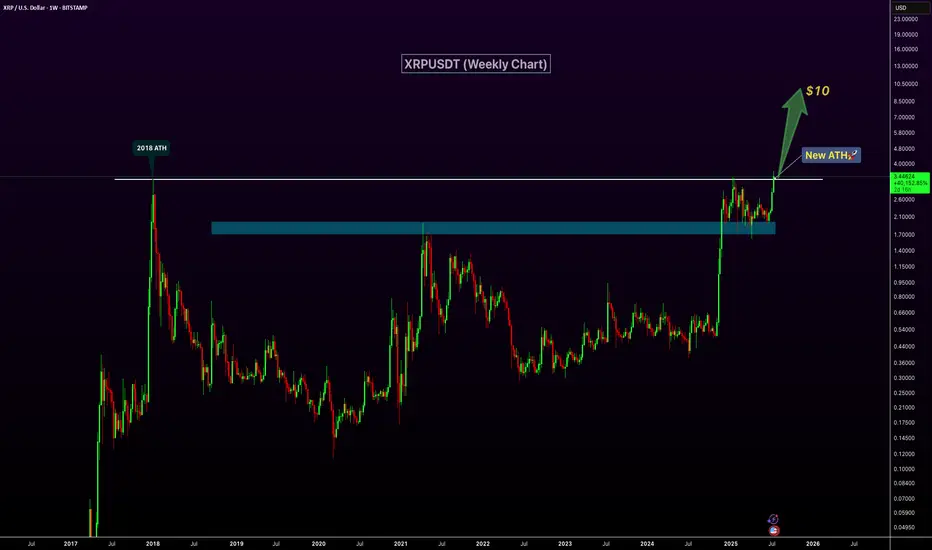
XRP Breaks 2018 High – New ATH Confirmed!XRP has officially broken above its 2018 peak, signaling a major bullish breakout and printing a new all-time high on the weekly chart. The previous resistance zone around $2.6–$3 has now flipped into strong support, confirming the strength of this move. With increasing volume and momentum behind the rally, XRP appears well-positioned for continued upside. The next key psychological target lies at $10, and current price action suggests a clear path toward that level. If bullish sentiment continues, this breakout could mark the beginning of a significant new uptrend.
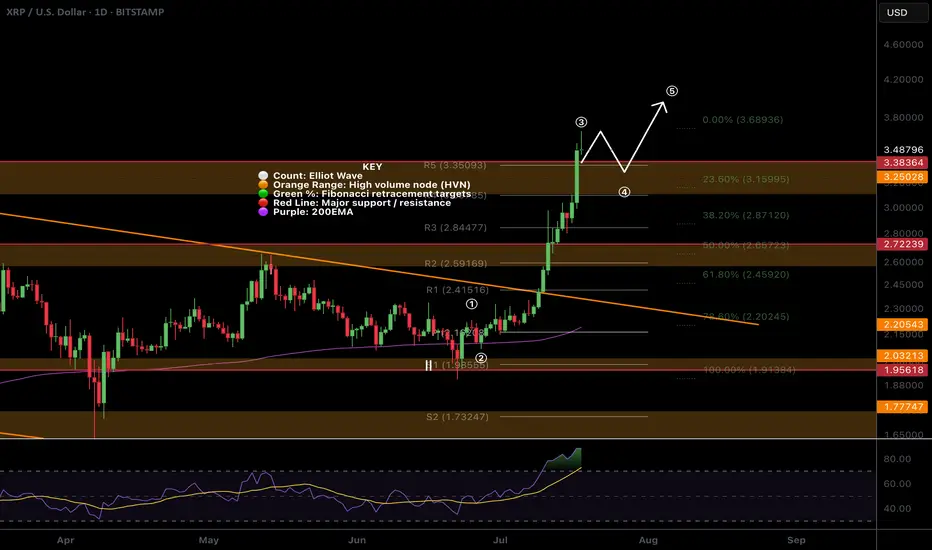
$XRP All time high! Time to sell or...?CRYPTOCAP:XRP appear to have completed wave 3 with a poke above all time high, typically this os behaviour of a wave 5.
The daily R5 pivot point has been breached so there is a significant chance of a decent pullback now but I wouldn't bet against the trend!
Wave 4 could be shallow, targeting the previous all time high, High Volume Node with waver 5 completing near $4.
Daily RSI is overbought but no bearish divergence yet which will likely emerge during wave 5.
Safe trading
XRP LONG TO ATHs! Ripple XRPUSD RLUSD XRP is Bullish to $4 at the very minimum. We successfully completed our retrace down to $1.95 to the dot. Expecting that to be our final support area and to start seeing consolidation, and upwards momentum. Media hype hasn't started yet, BTC is losing market dominance similar to 2017 2018. We are on the verge of another Diamond Hands bull run. Make sure to take some profits when emotions are hitting super dopamine levels of euphoria. The final pump happens fast and retraces even faster. The volatility will be insane.
Well keep tabs on this as the weeks go by. Good luck you beauties!

XRP - One More Wave Soon!Hello TradingView Family / Fellow Traders. This is Richard, also known as theSignalyst.
📈XRP has been overall bullish trading within the rising wedge pattern in blue.
However, it is approaching its all-time high at $3.4.
🏹 The highlighted blue circle is a strong area to look for buy setups as it is the intersection of the orange demand zone and lower blue trendline acting as a non-horizontal support.
📚 As per my trading style:
As #XRP retests the blue circle zone, I will be looking for bullish reversal setups (like a double bottom pattern, trendline break , and so on...)
📚 Always follow your trading plan regarding entry, risk management, and trade management.
Good luck!
All Strategies Are Good; If Managed Properly!
~Rich

ADA/USDT : +50% in 21 Days, More Rise Ahead? (READ THE CAPTION)Over 50% growth in just 21 days — Cardano’s explosive rally continues, and the $0.76 target has now been hit! Since our last analysis, ADA has kept pushing higher, successfully reaching the next key level and bringing the total return from this move above 50%. Currently trading around $0.73, with strong bullish momentum still in play, I expect it won’t be long before we head toward the next targets. Upcoming levels to watch: $0.93, $1.05, and $1.33 — we’re getting closer to that 100% gain!
Please support me with your likes and comments to motivate me to share more analysis with you and share your opinion about the possible trend of this chart with me !
Best Regards , Arman Shaban

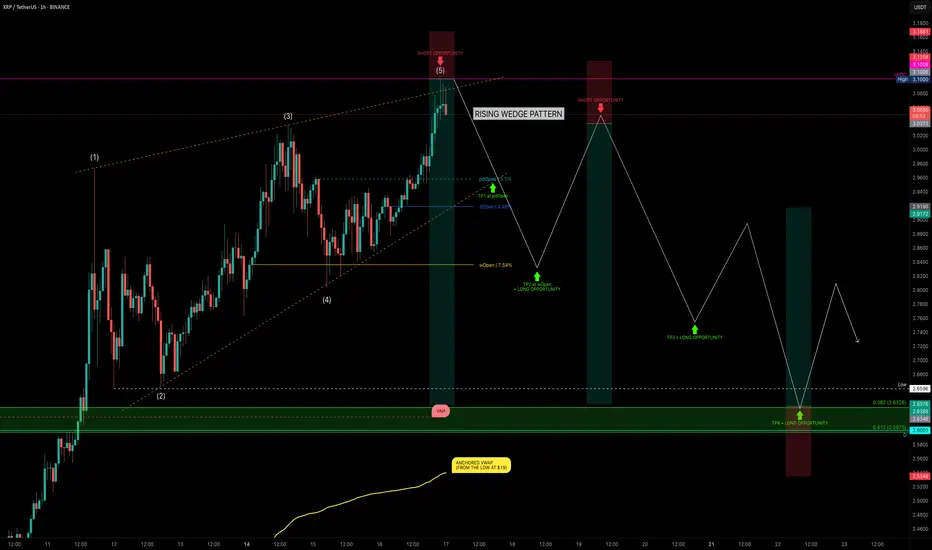
XRP Hits $3.10 — Rising Wedge or Ready to Fly?XRP has been on a strong run over the past 24 days, rallying from $1.90 → $3.10 — a +62% price increase. But after hitting key resistance, is XRP about to correct, or will it break out further? Let’s dive into the technicals.
🧩 Market Structure
Rising Wedge Pattern:
The current market structure resembles a rising wedge, with XRP likely completing wave 5.
Rejection Zone Hit:
Price tapped the nPOC at $3.10 and rejected — providing a clean short opportunity.
📉 Key Support Levels & Confluences
Taking the full 24-day bullish move:
0.382 Fib Retracement: $2.6326 — aligns with liquidity pool below the $2.6596 swing low.
226-day Trading Range VAH: ~$2.62 (red dashed line) — adds confluence.
Daily Level: $2.60 — further support.
Anchored VWAP from $1.90 Low: ~$2.54 (rising over time).
✅ Conclusion: The $2.66–$2.60 zone is a critical support area and offers a solid long opportunity.
Trade Setups
🔴 Short Setup (After Breakdown Confirmation):
Wait for a sell-off & breakdown of the wedge.
Ideal entry: retest of the lower wedge edge, ideal short entry would be between 0.618–0.786 fib retracement.
🟢 Long Setup:
Entry Zone: $2.66–$2.60
SL: below VWAP line
Target: Fib 0.618 as TP
🧠 Educational Insight: Rising Wedges Explained
A rising wedge is a bearish pattern, often signalling weakening momentum as price climbs within narrowing highs and lows.
Key points:
➡️ Volume typically declines as the wedge matures.
➡️ Breakdown below the lower wedge edge often triggers stronger sell-offs.
➡️ Retests of the broken wedge support turn into ideal short entries.
Pro tip: Combine wedge patterns with fib retracement zones and VWAP levels for higher-confidence setups.
Watch for wedge breakdown confirmation before shorting.
_________________________________
💬 If you found this helpful, drop a like and comment!
Want breakdowns of other charts? Leave your requests below.
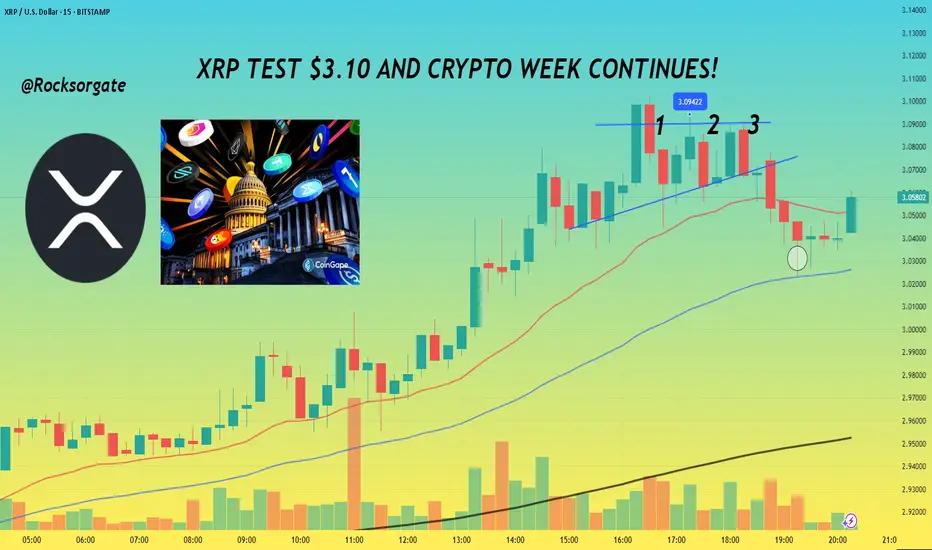
XRP TEST $3.10 AND CRYPTO WEEK CONTINUES!📊 Hey hey, hope all is well, gonna keep this idea pretty short and concise for the day, have a lot to do but thanks for joining as always.
📊 With Crypto week ongoing and the House of Representatives considering the Guiding and Establishing National Innovation for U.S Stable coins or GENIUS for short. Alongside that there's the Digital Asset Market Clarity Act or Clarity for short which is being considered as well. The last bill being considered is one which would be directed towards blocking the Federal Reserve from issuing a central bank digital currency directly to individuals.
📊 For summary CBDC is fiat money, just in digital form and that fiat money is issued and regulated by a central bank of a country.
📊 GENIUS has already made the rounds and passed through senate but is facing a snag, in limbo as House lawmakers as some lawmakers like Marjorie Taylor Greene and Chip Roy who themselves we're looking to get anti-CBDC language in with 12 republicans voting no on Tuesday's vote. Least to say things are still in flux, so we'll have to see if lawmakers can come to an agreement and sort things out simply put.
📊 If passed GENIUS would require stable coins to be fully backed by U.S dollars or similar liquid assets. Along with this you'd have annual audits for issuers with a market cap of more than $50 billion and guidelines would be established for foreign issuance.
📊 the Clarity Act takes a full on approach to crypto and would create a clear regulatory framework for crypto, this would function through the U.S Securities and Exchange Comission and Commodity Futures Trading Commission will regulate the crypto space. Digital asset firms would also have to provide retail financial disclosures and separate corporate from customer funds. More than likely in a nod to the collapse that FTX brought about for money when the company took advantage and started using customer funds.
📊 Overall these bills and acts alongside the CBDC bill would be a significant change for the digital asset space and give much more clarity for Institutions further allowing more money to enter the space basically.
Reference:
www.coindesk.com
www.theblock.co
📊 XRP itself will be impact by these changes just like the rest of the space with some digital assets making significant jumps or declines based on what bills and changes are ultimately decided so it's a crazy week to say in the least. For Technical I've added a chart below for reference:
📊 Can see how we're facing that horizontal level of resistance at $3.10 now, gonna set an alert for that but more than anything, right now what's gonna make or break things will be the news, we've already seen how much that's done us the last few weeks, grateful and blessed for it as always.
📊 Main thing now is to keep an eye on the news and watch that $3.10 level for resistance or a further breakout. We've also converged with our 200 EMA on the 3 minute chart so no doubt we'll see bulls and bears fight to break or keep that point. Should be an interesting next few days.
📊 Have to go study but as always, grateful for the continued support and those that take the time to read through these and continue with me on this journey, it's taken a few years but things are coming together finally, grateful we've perservered.
Best regards,
~ Rock '
Weekly/monthly bullflag on xrpusdAn even higher target than the symmetrical triangles two potential targets materializes when we confirm the breakout up from this bull flag. It will likely have a bullish target somewhere around $5.20. Upon reaching this target it will also be breaking above a big cup and handle that will then have an even higher breakout target which I will post in my next idea *not financial advice*

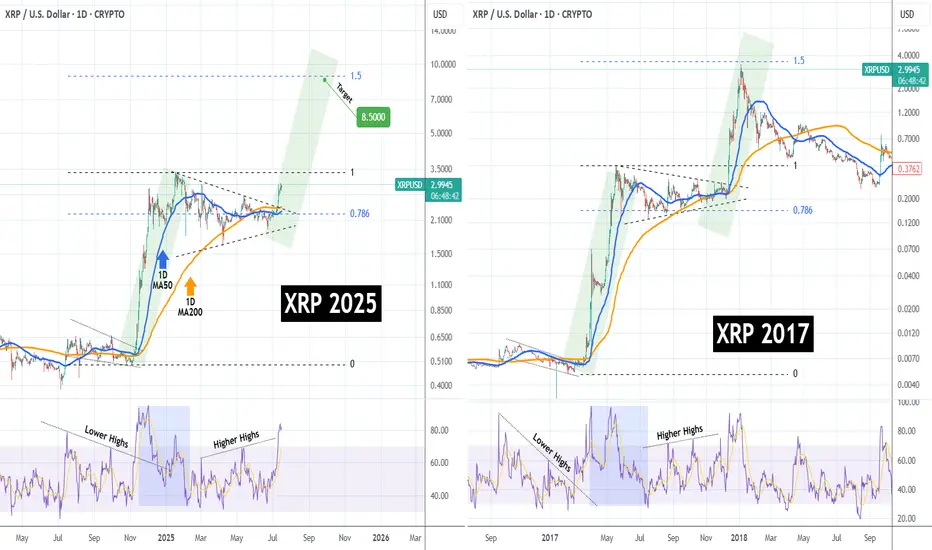
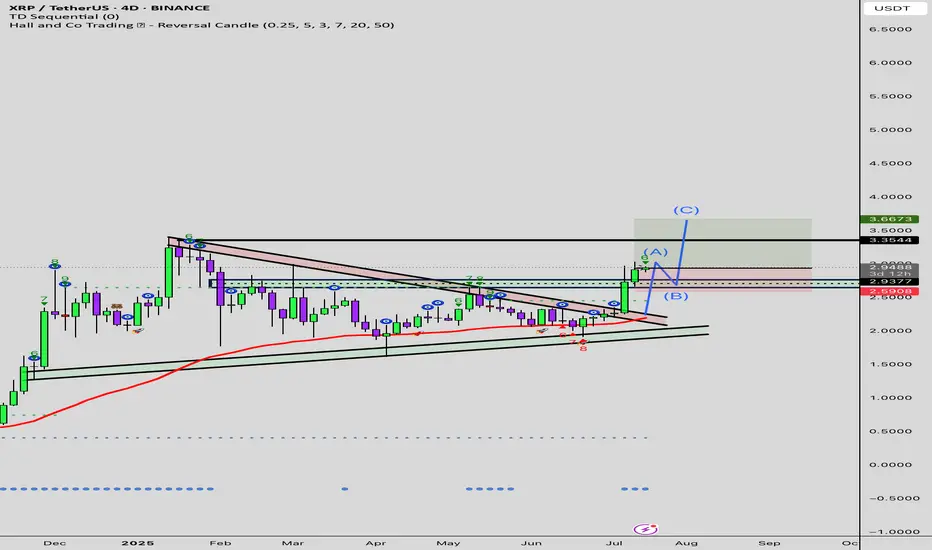
XRPUSD Has it started the mega rally to $8.500??XRP (XRPUSD) has been trading within a Triangle pattern for the past 6 months (January - July 2025) and only recently, it broke to the upside. Ahead of a pending 1D Golden Cross, this pattern is no different than the one of the previous Cycle from May - December 2017.
That setup resulted into the final Parabolic Rally of the Cycle that peaked just below the 1.5 Fibonacci extension. As you can see, both fractals are identical even from their starts, both initiated after a Falling Wedge that produced the first Parabolic Rally (green), which transitioned into the Triangle we described. Even their 1D RSI sequences are similar.
As a result, it is more than probable to see XRP hit $8.500 (Fib 1.5 ext), by the end of the year.
-------------------------------------------------------------------------------
** Please LIKE 👍, FOLLOW ✅, SHARE 🙌 and COMMENT ✍ if you enjoy this idea! Also share your ideas and charts in the comments section below! This is best way to keep it relevant, support us, keep the content here free and allow the idea to reach as many people as possible. **
-------------------------------------------------------------------------------
💸💸💸💸💸💸
👇 👇 👇 👇 👇 👇
XRP/USD (RIPPLE) BUYtitle: XRP/USD (RIPPLE) BUY
Asset: Crypto
Symbol: XRP/USD
Market Entry Price 1: $2.9450
Limit Entry Price 2: $2.7450
Stop Loss: $2.6450
Take Profit 1: $3.145 (close 10%)
Take Profit 2: $3.345 (close 25%)
Take Profit 3: $3.645(close 50%)
Take profit 4: $3.845 (close 75%)
Let any remaining Xrp run risk free
ETH/USDT : $3000 Reached, It's time foe $4000? (READ)By analyzing the Ethereum chart on the weekly timeframe, we can see that the price has finally broken the strong $2700 resistance and pushed toward the next target at $3000! Currently trading around $3150 and now within the $3130–$3440 zone, I expect a short-term rejection from this area. However, given the overall market trend, this level may not hold for long, and we could soon see a breakout toward the next targets at $3500, $3740, $4100, and $4470!
Please support me with your likes and comments to motivate me to share more analysis with you and share your opinion about the possible trend of this chart with me !
Best Regards , Arman Shaban
THE LATEST ANALYSIS :

LIVE TRADE (XRP)Hello friends🙌
🔥Here we are with live trading Ripple, please follow capital management.
📈Given the resistance break, we can enter a buy trade and move with it to the specified targets.
🔥Follow us for more signals🔥
*Trade safely with us*

Ripple buy signalHello friends
Given the good growth we had, we entered a deep correction, and now we have the opportunity to buy step by step in the specified support areas with capital and risk management and move with it to the specified targets.
*Trade safely with us*

Xrp:The fate of Ripple in the long termhello friends👋
After a good price growth that we had, you can see that the buyers gradually exited and a triangle pattern was formed.
Now, according to the specified support, it should be seen whether buyers support Ripple or not...
You have to wait and nothing can be said until the failure of the pattern, but we suggest that you buy step by step with capital and risk management in the identified areas that are very good supports and move to the set goals.
And in the end, we must say that don't forget that we are in a strong upward trend, that the probability of the continuation of the Bister trend is the possibility of a fall...
🔥Follow us for more signals🔥
*Trade safely with us*

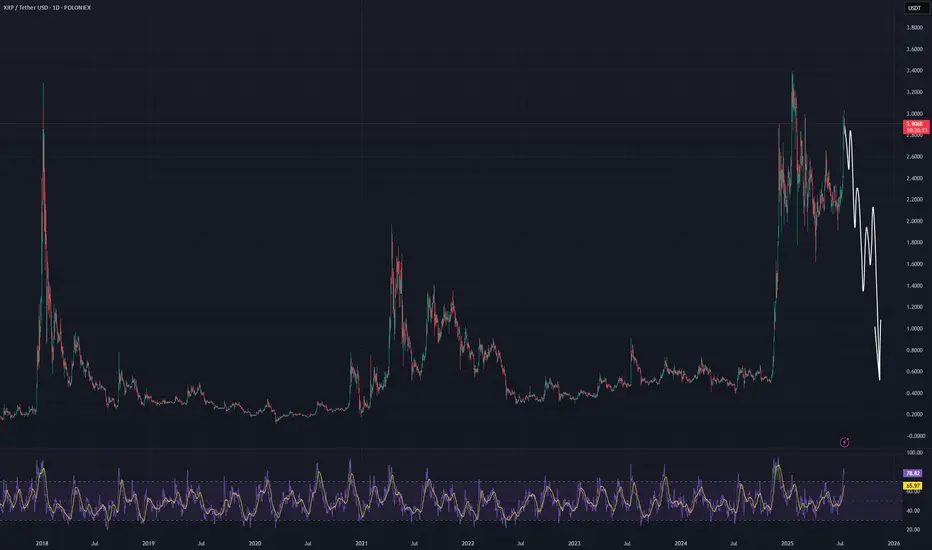
#XRP/USDT - SHORTThe chance that the asset will reach the $5 level is extremely low. This is indicated only by the 3-month timeframe. The rest of the data suggests that the movement will be in one direction.
(Not an investment recommendation).
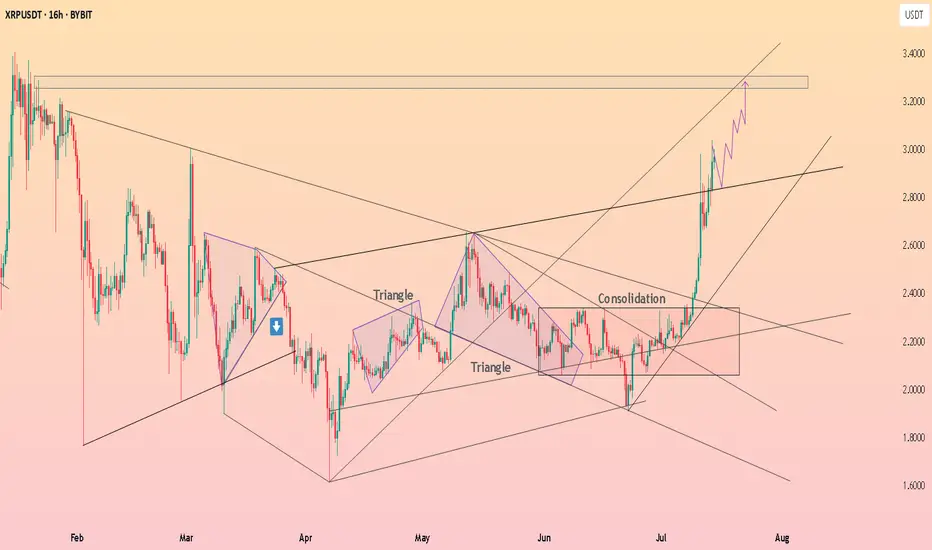
HolderStat┆XRPUSD explosive growthBYBIT:XRPUSDT rallied out of consolidation and triangle formations, driving price quickly toward the $3.20–$3.40 range. The trend remains bullish with structure pointing toward continued upside as long as support holds above $2.80.
$XRP All Tie High After Shallow Pullback?CRYPTOCAP:XRP had a fantastic week smashing all resistances. I am looking for a shallow pull back to test the High Volume Node support at $2.7 at the .236 Fibonacci retracement before continuing to challenge the all time high.
Wave (3) of a motif wave appears complete adding confluence to a shallow retracement for wave (4).
Daily RSI is extremely overbought.
Safe trading
