Will Ripple "leave a dent in the universe"?They called us crazy, when we bought xrp at the bottom, in the midst of court cases. What they don't see is that, many TODAY major companies that changed the world (e.g. Apple, Amazon, MSFT etc.) had long term court cases with the SEC before "leaving a dent in the universe". In our opinion, Ripple is next in line.
#xrp #crypto #bitcoin #ripple #banking #blockchain #finance #money #stablecoin #financialsystem
Ripple

SOL/USDT : Strong Bullish Move Ahead?By analyzing the #Solana chart on the daily timeframe, we can see that the price is currently trading around $149.62. If the price holds above the key level of $146.28, we could expect the beginning of a strong bullish wave, potentially delivering over 25% short-term returns.
If this scenario plays out, the next bullish targets are $168.50, $187, $220, and $263.
(Personal research is strongly recommended for long-term investment decisions.)
Please support me with your likes and comments to motivate me to share more analysis with you and share your opinion about the possible trend of this chart with me !
Best Regards , Arman Shaban

XRP 4H SHORTPrice did a trend line third touch on the bearish trendline, which in this case acts as the resistance. Price printed a bearish engulfing pattern signaling a pullback to at least 2.1600 and second target is 2.1100.

XRP Alert: $3 Bets Dominate as Massive "Wedge" Pattern SignalThe Anatomy of a Sleeper Awakened: Analyzing the $3 XRP Bet and the Decisive XRP/BTC Technical Pattern
In the relentless and often forgetful cycle of the cryptocurrency market, assets can fall into long periods of dormancy. They become laggards, overshadowed by newer, faster-growing projects, their communities tested, and their price action a flat line of disappointment on a chart full of parabolic curves. For years, XRP has been the quintessential example of such an asset. Plagued by a protracted legal battle with the U.S. Securities and Exchange Commission (SEC) and consistently underperforming its large-cap peers, it became the subject of both unwavering belief from its dedicated "XRP Army" and derision from the wider market.
However, the quietest corners of the market often hide the most tension. Beneath the surface of sideways price action, a confluence of powerful forces is beginning to emerge, suggesting that this slumbering giant may be on the verge of a violent awakening. This shift is not signaled by mainstream headlines or celebrity endorsements, but by the sophisticated and often predictive language of derivatives markets and inter-market technical analysis.
Two specific, potent signals have captured the attention of astute market observers. The first is a stunning development in the XRP options market, where call options with a $3 strike price are inexplicably dominating trading volumes. This is not a modest bet on a 20% gain; it is an audacious, seemingly irrational wager on a 500-600% price explosion. The second is a multi-year technical pattern on the XRP/BTC chart—a massive falling wedge that suggests XRP is coiling for a major rally, not just in dollar terms, but against the market's undisputed king, Bitcoin.
This analysis will conduct a deep dive into these two phenomena. We will dissect the implications of the $3 options bet, exploring the psychology and mechanics behind such speculative fervor. We will then meticulously break down the XRP/BTC wedge pattern, explaining its significance as a measure of relative strength and its potential to unleash a powerful wave of capital rotation. Finally, we will connect these market signals to the underlying fundamental drivers—the aftermath of the SEC lawsuit, Ripple's ongoing business development, and the broader market cycle dynamics—to construct a holistic thesis. While the road ahead is fraught with risk and uncertainty, the evidence suggests that the narrative surrounding XRP is undergoing a seismic shift, moving from a story of legal battles and stagnation to one of profound, speculative optimism.
________________________________________
Part 1: Decoding the Options Market Frenzy - The Audacity of the $3 Bet
To the uninitiated, the options market can seem like an esoteric and complex casino. In reality, it is a sophisticated mechanism for hedging risk and placing directional bets, and the data it generates provides an invaluable window into the collective mind of the market. The current activity in the XRP options market is not just a flicker of interest; it is a roaring fire of speculative conviction centered around a single, audacious number: $3.
Understanding the Language of Options
Before dissecting the significance of this event, it is crucial to understand the basic mechanics at play. A call option gives the buyer the right, but not the obligation, to purchase an asset at a predetermined price (the strike price) on or before a specific date (the expiration date).
For example, a trader buying an XRP call option with a $3 strike price is betting that the price of XRP will rise significantly above $3 before the option expires. If XRP were to reach, say, $4, the trader could exercise their option to buy XRP at $3 and immediately sell it for $4, pocketing the difference.
The key takeaway is that these options are leveraged instruments. A trader can control a large amount of XRP for a small upfront cost (the premium). However, if the price of XRP does not exceed the strike price by the expiration date, the option expires worthless, and the trader loses their entire premium. This makes buying far out-of-the-money (OTM) call options—where the strike price is significantly higher than the current market price—an extremely high-risk, high-reward strategy.
The Significance of the $3 Strike Price
The current market price of XRP hovers around $0.50 to $0.60. A $3 strike price, therefore, is not a bet on incremental gains. It is a bet on a monumental, life-changing rally of approximately 500%. This is what makes the situation so extraordinary. The fact that this specific strike price is the most traded in terms of volume indicates a massive concentration of speculative interest.
This phenomenon can be interpreted in several ways:
1. Extreme Bullish Conviction: The most straightforward interpretation is that a significant number of traders, from retail speculators to potentially larger funds, harbor a deep-seated belief that a major catalyst is on the horizon. This could be related to a final, favorable resolution in the SEC case, a major partnership announcement by Ripple, or the anticipated effects of a full-blown crypto bull market lifting all boats, with XRP expected to be a primary beneficiary. They are willing to risk a small premium for a chance at an exponential payout.
2. "Lottery Ticket" Mentality: A more skeptical view is that these are akin to lottery tickets. The premiums on these far OTM options are relatively cheap. A trader might spend a few hundred dollars on $3 calls, fully accepting that they will likely expire worthless. However, in the infinitesimally small chance that XRP does experience a black swan event to the upside, that small investment could turn into tens of thousands of dollars. It is a bet on volatility and a low-probability, high-impact event, rather than a nuanced analysis of fair value.
3. Potential for a Gamma Squeeze: This is a more complex but critical possibility. When a large number of call options are purchased, the market makers who sell these options are left with a short position. To hedge their risk, they must buy the underlying asset (XRP). As the price of XRP begins to rise and approach the strike price, the market makers' risk increases exponentially, forcing them to buy more and more XRP to remain hedged. This reflexive loop—rising prices forcing more buying, which in turn pushes prices even higher—is known as a gamma squeeze. The massive open interest at the $3 strike, while currently far away, builds a foundation of potential explosive fuel. If a rally were to gain serious momentum and push past $1, then $1.50, the hedging pressure on market makers would begin to mount, potentially turning a strong rally into a parabolic one.
4.
Analyzing the Volume and Open Interest
"Dominating trading volumes" means that more contracts for the $3 strike are changing hands daily than for any other strike price, whether it's a more conservative $0.75 or $1.00 call. This indicates active, ongoing betting. Open interest, on the other hand, refers to the total number of outstanding contracts that have not been settled. High open interest at the $3 strike signifies that a large number of participants are holding these positions, not just day-trading them. They are maintaining their bet over time, waiting for the anticipated price move.
The sheer concentration of both volume and open interest at such a high strike price is a powerful sentiment indicator. It tells us that the "smart money" or, at the very least, the most aggressive speculative capital, is not positioning for a minor recovery. It is positioning for a complete and total repricing of the asset. While this does not guarantee the outcome, it creates a self-fulfilling prophecy dynamic. The knowledge that this much speculative interest exists can itself attract more buyers, who want to front-run the potential squeeze.
________________________________________
Part 2: The Technical Tale of the Tape - XRP/BTC's Coiled Spring
While the options market provides a glimpse into the speculative sentiment surrounding XRP's dollar value, a far more profound story is being told on the XRP/BTC chart. This trading pair is arguably one of the most important long-term indicators for any altcoin, as it measures its performance not against a fiat currency, but against the crypto market's center of gravity: Bitcoin.
The Crucial Importance of the XRP/BTC Pair
When XRP/USD rises, it can simply mean the entire crypto market, led by Bitcoin, is in an uptrend. However, when XRP/BTC rises, it signifies something much more powerful: XRP is outperforming Bitcoin. This means that capital is actively rotating out of the market leader and into XRP, seeking higher returns. A sustained uptrend in the XRP/BTC pair is the hallmark of a true "altcoin season" for that specific asset and is often the precursor to the most explosive, parabolic moves in its USD valuation.
For the past several years, the XRP/BTC chart has been a painful sight for XRP holders. It has been in a brutal, grinding downtrend, meaning that even when XRP's dollar price rose, holding Bitcoin would have been a more profitable strategy. This long period of underperformance, however, has forged one of the most powerful bullish reversal patterns in technical analysis: a falling wedge.
Anatomy of the Falling Wedge
A falling wedge is a technical pattern that forms when an asset's price makes a series of lower highs and lower lows, with the two trendlines converging. The key characteristic is that the lower trendline (support) is less steep than the upper trendline (resistance).
• Psychology Behind the Pattern: The pattern represents a battle between buyers and sellers where the sellers are gradually losing their momentum. Each new push lower by the bears is met with more resilience from the bulls, and the price fails to fall as far as it did previously. The contracting range signifies that volatility is decreasing and energy is being stored. It is a period of consolidation that often precedes a major trend reversal. The bears are getting exhausted, and the market is coiling like a spring.
• The Breakout: The bullish signal is triggered when the price breaks decisively above the upper trendline (resistance) of the wedge. This breakout indicates that the balance of power has finally shifted from the sellers to the buyers. A valid breakout is typically accompanied by a significant increase in volume, confirming the conviction behind the move.
• Price Target: Technical analysts often measure the potential price target of a wedge breakout by taking the height of the wedge at its widest point and adding it to the breakout point. Given that the XRP/BTC wedge has been forming for several years, its height is substantial, suggesting that a successful breakout could lead to a rally of 200-300% or more against Bitcoin.
Analyzing the XRP/BTC Chart
The multi-year falling wedge on the XRP/BTC weekly and monthly charts is a textbook example of this pattern. It encapsulates the entire bear market and period of underperformance since the previous cycle's peak. The price has been tightening into the apex of this wedge for months, signaling that a resolution is imminent.
A breakout from this pattern would be a technical event of immense significance. It would signal the end of a multi-year bear market against Bitcoin and the beginning of a new cycle of outperformance. Traders and algorithms that monitor these patterns would interpret it as a major "buy" signal, potentially triggering a flood of new capital into XRP.
This technical setup provides a logical foundation for the seemingly irrational optimism seen in the options market. The traders betting on $3 XRP are likely looking at the XRP/BTC chart and seeing the same thing: the potential for a violent and sustained reversal. A 200% rally in XRP/BTC, combined with a rising Bitcoin price in a bull market, could easily provide the momentum needed to propel XRP's dollar valuation into the multi-dollar range. The two signals are not independent; they are two sides of the same coin, reflecting a deep and growing belief in an impending, historic rally.
________________________________________
Part 3: The Fundamental Undercurrents - The 'Why' Behind the 'What'
The explosive options activity and the powerful technical pattern are the "what." They are the observable phenomena. But to build a robust thesis, we must understand the "why." What fundamental shifts are occurring to justify this renewed optimism? The answer lies in a combination of legal clarity, steady business development, and predictable market cycle dynamics.
The Aftermath of the Ripple vs. SEC Lawsuit
The single greatest cloud hanging over XRP for years has been the SEC lawsuit, filed in December 2020, which alleged that XRP was an unregistered security. This created massive regulatory uncertainty, leading to its delisting from major U.S. exchanges and causing institutional capital to shun the asset.
In July 2023, a landmark summary judgment was delivered by Judge Analisa Torres. The key takeaways were:
1. Programmatic Sales of XRP on exchanges do not constitute securities transactions. This was a monumental victory for Ripple and the XRP community. It provided the legal clarity that exchanges needed to relist XRP, and it affirmed that for the average retail buyer, XRP is not a security. This removed the primary existential threat to the asset.
2. Institutional Sales of XRP were deemed securities transactions. This was a partial victory for the SEC, but it was confined to Ripple's direct sales to institutional clients in the past.
While the case is not fully over—with final remedies and penalties for institutional sales still being determined—the market has correctly interpreted the main ruling as a decisive win. The risk of XRP being declared a security across the board has been neutralized. This clarity is the single most important fundamental catalyst. It allows exchanges, investors, and partners to engage with XRP with a level of confidence that was impossible just a few years ago. The market is now looking past the remaining legal wrangling and focusing on the future.
Ripple's Unwavering Business Development
Throughout the entire legal battle, Ripple, the company, never stopped building. Its core mission is to use blockchain technology to improve cross-border payments, a multi-trillion dollar industry ripe for disruption. XRP, the digital asset, is central to its flagship product, Ripple Payments (formerly On-Demand Liquidity or ODL). This service uses XRP as a bridge currency to enable instant, low-cost international payments without the need for pre-funded nostro/vostro accounts.
Ripple has been steadily expanding its payment corridors, securing licenses in key jurisdictions like Singapore, Dubai, and Ireland, and forging partnerships with financial institutions around the globe. Furthermore, the company is actively involved in the development of Central Bank Digital Currencies (CBDCs), piloting its technology with several nations.
The recent announcement of a Ripple-issued stablecoin pegged to the U.S. dollar further expands its ecosystem. This move positions Ripple to compete in the massive and growing stablecoin market, leveraging the XRP Ledger's speed and efficiency.
This steady, behind-the-scenes progress provides a fundamental anchor to the speculative bets being placed. Unlike many crypto projects that are built on hype alone, Ripple has a real-world use case, a functioning business, and a clear strategy for capturing a share of the global payments market. The resolution of the SEC case allows this fundamental value proposition to finally come to the forefront.
The Inevitable Laggard Rotation
Finally, the optimism surrounding XRP can be explained by classic crypto market cycle dynamics. A typical bull market cycle follows a predictable pattern of capital rotation:
1. Bitcoin Leads: Capital first flows into Bitcoin, the market's most established and trusted asset.
2. Rotation to Ethereum: As Bitcoin's gains begin to slow, profits are rotated into Ethereum, the leading smart contract platform.
3. Large-Cap Altcoins: Capital then flows from Ethereum into other large-cap altcoins.
4. The Laggard Rally: Finally, in the latter stages of a bull run, traders seek out assets that have underperformed, or "lagged," the market. These laggards, often older coins with strong communities, can experience explosive catch-up rallies as a flood of speculative capital seeks the next big move.
XRP is the archetypal laggard. It has massively underperformed both Bitcoin and Ethereum for years. The bets being placed now—both in the options market and on the XRP/BTC chart—are a clear anticipation of this final, powerful stage of the market cycle. Traders are positioning themselves to front-run the great capital rotation into one of the market's most well-known but long-neglected assets.
________________________________________
Part 4: A Sobering Perspective - Risks and Counterarguments
No analysis would be complete without a balanced look at the potential risks that could invalidate the bullish thesis. While the confluence of signals is powerful, success is far from guaranteed.
1. The Options Trap: The most obvious risk is that the $3 call options are simply a mirage. The vast majority of far out-of-the-money options expire worthless. This could be nothing more than a wave of irrational exuberance from retail traders that ultimately amounts to nothing, leaving a trail of lost premiums.
2. The False Breakout: Technical patterns can fail. The XRP/BTC wedge could experience a "fakeout," where the price briefly breaks above the resistance line only to be aggressively sold back down, trapping hopeful buyers and resuming the downtrend.
3. Lingering Legal Headwinds: While the main ruling was a victory, the final penalty in the SEC case could be larger than anticipated, generating negative headlines and creating short-term selling pressure. Any future regulatory actions targeting other aspects of the crypto space could also have a chilling effect.
4. Adoption and Competition: Ripple's success is not preordained. The cross-border payments space is fiercely competitive, with traditional players like SWIFT innovating and other blockchain projects vying for market share. The ultimate success of Ripple's business model—and by extension, the utility-driven demand for XRP—is still a long-term question.
5. Centralization and Supply Concerns: A long-standing criticism of XRP is the centralized nature of its ledger and the large portion of the total XRP supply held in escrow by Ripple Labs. While Ripple has a predictable schedule for releasing this escrow, it represents a potential source of selling pressure and a point of concern for those who prioritize decentralization above all else.
Conclusion: The Convergence of Evidence
The case for a significant XRP rally is a tapestry woven from multiple, converging threads of evidence. It is not based on a single indicator but on a powerful confluence of speculative sentiment, technical structure, and fundamental catalysts.
The frenzied buying of $3 call options is the market screaming its ambition, a raw and unfiltered signal of extreme bullishness. It is a bet not just on recovery, but on a complete paradigm shift in the valuation of XRP. This audacious sentiment finds its technical justification in the multi-year falling wedge on the XRP/BTC chart—a coiled spring of potential energy that, if released, would signal a historic rotation of capital into the long-suffering asset.
Underpinning these market signals is a strengthening fundamental picture. The crucial legal clarity from the SEC lawsuit has removed the single greatest obstacle to XRP's progress, allowing the market to finally price in the steady, persistent work Ripple has done in building a global payments network. Combined with the predictable dynamics of a crypto bull cycle, where laggards eventually have their day in the sun, the stage appears to be set.
The journey to $3—and beyond—is still a marathon, not a sprint. It is fraught with the risks of failed patterns, expiring options, and the inherent volatility of the crypto market. However, for the first time in years, the narrative is not one of defense but of offense. The signals are clear: the market is no longer asking if the sleeper will awaken, but is now placing massive, leveraged bets on the magnitude of the roar it will make when it does. The current moment represents the starting gun, and for traders and investors who have been watching from the sidelines, the race for XRP's repricing may have just begun.

HolderStat┆XRPUSD forming the rising bottomBINANCE:XRPUSDT has broken above resistance and is consolidating above the breakout zone. This mirrors previous triangle–consolidation patterns that preceded upside moves. If momentum continues, a run toward 2.34 is in play.

TON/USDT : Are you Bullish or Bearish? Let's Talk!By analyzing the #Toncoin chart on the 3-day timeframe, we observe that the price is still within the demand zone between $2.40 and $3.00.
If the price manages to break above the $3.10 level and hold within the next 7 days, we can expect further growth from this cryptocurrency.
The expected returns are approximately 20% in the short term, 40% to 55% in the mid-term, and up to 110% in the long term.
Please support me with your likes and comments to motivate me to share more analysis with you and share your opinion about the possible trend of this chart with me !
Best Regards , Arman Shaban

ETH/USDT : Gearing Up for a Major Breakout? (READ)By analyzing the Ethereum chart on the weekly timeframe, we can see that the price has started rising just as expected and is now approaching the first target. For now, ETH faces major resistance in the $2,600–$2,900 zone.
If price breaks above this key area, I expect a strong bullish move from Ethereum!
Based on the main analysis, the short-term targets are $2,700 and $2,890, while the mid-term targets are $3,100 and $4,100.
Please support me with your likes and comments to motivate me to share more analysis with you and share your opinion about the possible trend of this chart with me !
Best Regards , Arman Shaban

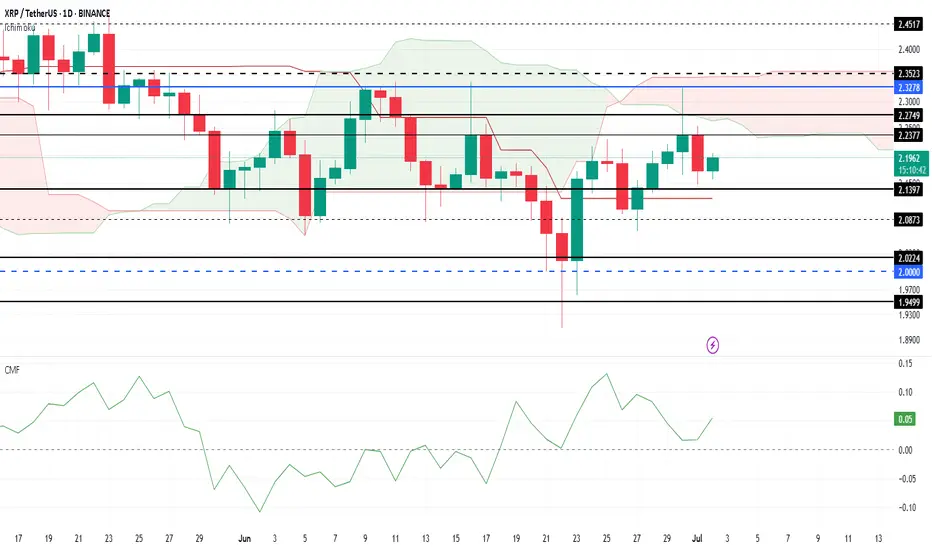
XRP Price Today: Rising Outflows Hinder RecoveryXRP has experienced notable volatility throughout June, with the altcoin failing to break through the $2.32 resistance level. Despite multiple attempts, XRP remains consolidated below this critical price point.
This price action indicates a lack of bullish momentum in the short term, making further gains challenging unless the resistance is breached.
The Ichimoku Cloud is turning negative , suggesting that bearish momentum could intensify for XRP. With the cloud positioned above the candlesticks, it signals further pressure on the price.
Additionally, rising outflows are visible on the CMF, as the indicator moves closer to the zero line, adding to the negative outlook.
If selling pressure continues to mount, XRP could fall below its support at $2.13 , potentially slipping to $2.02. This would mark a significant decline and invalidate the bullish thesis, signaling that XRP’s upward momentum could be at risk in the near future.
HolderStat┆XRPUSD before retest of the $2 levelBINANCE:XRPUSDT has rebounded from its 2.08 base and broken out of consolidation, aiming for the upper diagonal resistance near 2.40–2.60. With recurring bullish patterns and a history of strong follow-through after similar setups, momentum may build if 2.20 is cleared.

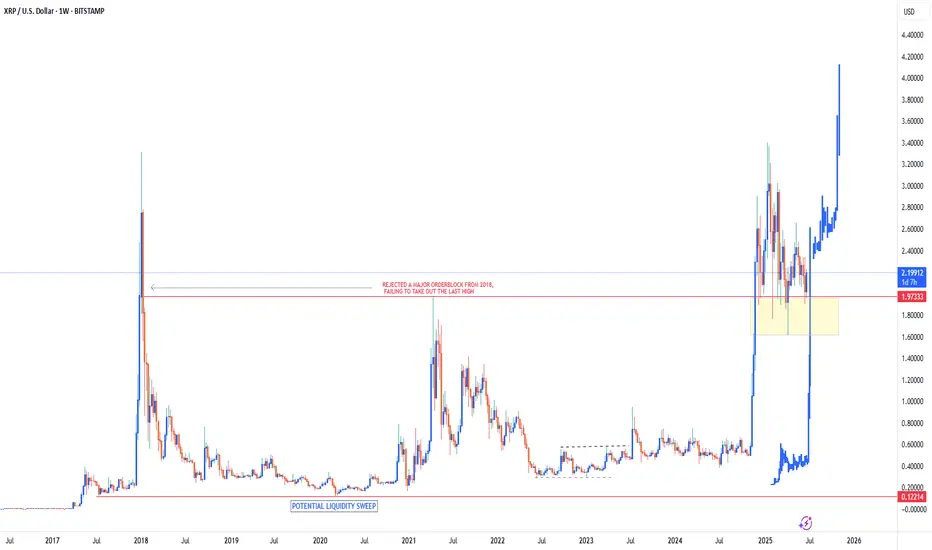
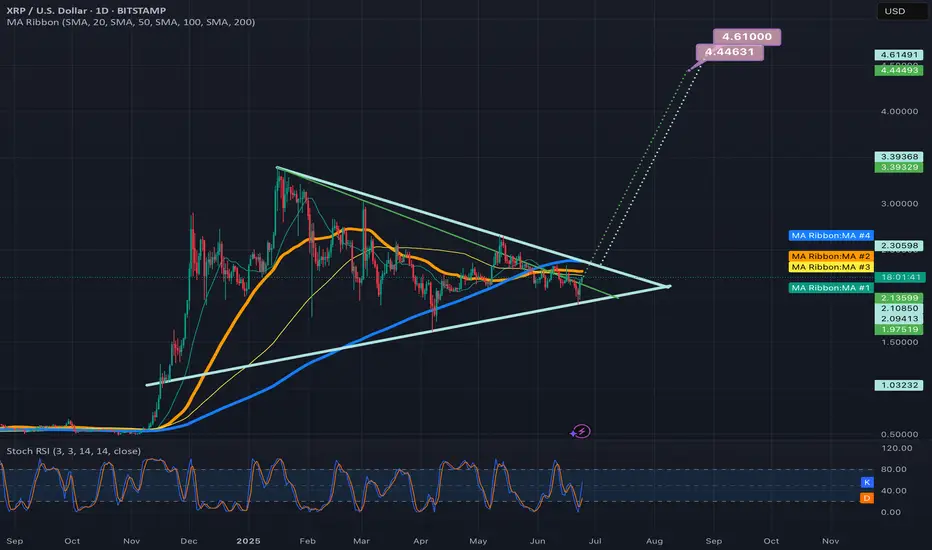
XRP Bullish to ATH of $4.10Since breaking out of its 6 year price range of $0.12 - $1.97 in November 2024, Ripple has remained within a bullish territory, sitting just above its support zone of $1.60 - $1.97.
As long as price can remain above this support zone I do believe that Ripple has much more upside to come in the next few YEARS. This definitely won’t be a fast move as there’s still a lot of legal situations involving XRP which is keeping price limited to the upside. But, as these legal battles come to an end & they will, it will slowly give XRP room to move to the upside.
I definitely see $4.1 as an achievable target for Ripple as the first target in the future. Once this price is reached, market structure & price action will give us a better indication of whether or not we can see high prices above the $4.1 target.
For now just be patient & let XRP play out in accordance with its external macro factors.
HolderStat┆XRPUSD consolidation of the assetBINANCE:XRPUSDT has bounced from the 2.02 level and is approaching the upper edge of a large consolidation structure. Multiple prior consolidation zones have led to breakouts, and the current bounce hints at continuation toward 2.30. A clean close above resistance would confirm bullish intent.

XRP UG-ah-LYXRP has been slowly chopping lower in a mess of overlapping candles. Lower highs and lower lows at the Highest degree. The trend is down and the Elliott Is ugly.
There is a chance here for the trend to shift, but that low needs to hold.
In Elliott Wave, ugly can be useful. An ugly pattern often screams correction. That is the working assumption right now. This structure could still be a complex wave four.
Even though the wave count has not been crystal clear, I am not flying blind. I am using support and resistance to track the structure and wait for clarity.
Here are the levels that matter right now:
3.4005 was the major high
3.0257 and 2.2762 are key reaction zones
2.6510 is the median and the first major line bulls need to beat
1.9736 is the old high that price continues to bounce from
1.9015 and 1.5267 are the potential downside reaction zones if the yellow path unfolds
If this is a correction, there is still potential to hold above 1.62 and send. If that level goes, the structure shifts fast to lower targets.
This is not the time to get brave without confirmation, mo.
Ugly price action can still resolve cleanly. But I want to see an impulsive move through one of these levels, followed by a corrective return to that level. That would offer a more ideal continuation in whichever direction price decides.
Let the level reactions speak first. I will act after.

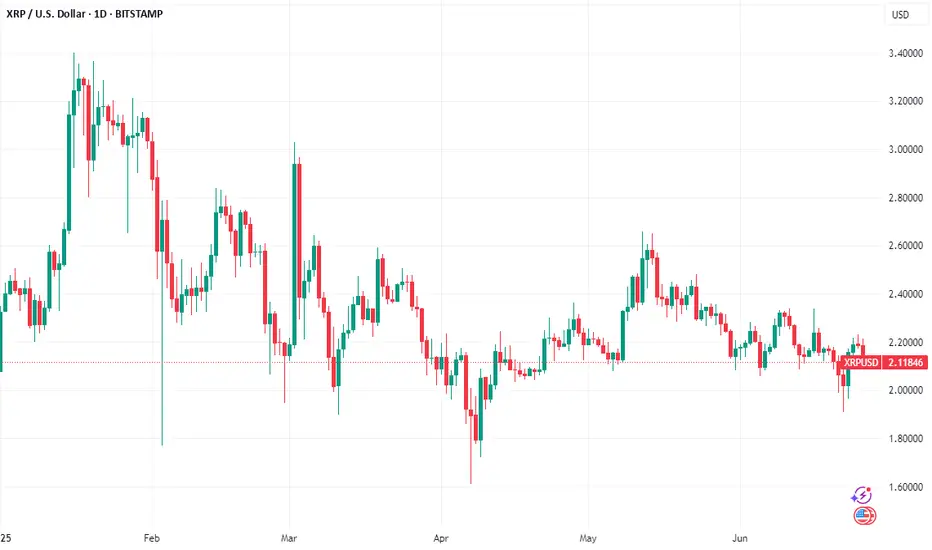
XRP to $3? Searches Surge as Whale Activity Hints at Price Boom
XRP, the cryptocurrency developed by Ripple Labs, has long been a subject of intense speculation and debate within the crypto community. Despite facing regulatory hurdles and market volatility, XRP has maintained a dedicated following, fueled by its potential to revolutionize cross-border payments. Recently, searches for "XRP to $3" have surged, reflecting renewed optimism among investors as the token exhibits signs of increased whale activity, institutional buying, and rising retail interest.
This article delves into the factors driving the renewed interest in XRP, examining the recent price movements, whale activity, and technical indicators that suggest a potential surge to $3. We will analyze the significance of the breakout above $2.20, the consolidation phase below this level, and the potential for XRP to reach $3.40. Furthermore, we will explore the factors that could either support or hinder XRP's ascent, providing a nuanced perspective on the potential for this cryptocurrency to reach new heights. By synthesizing these insights, we aim to offer a comprehensive overview of the factors that could shape XRP's price trajectory in the coming months.
Whale Activity and Institutional Buying: A Bullish Signal?
One of the key factors driving the renewed interest in XRP is the observed increase in whale activity. Whales, defined as individuals or entities holding large amounts of a particular cryptocurrency, can have a significant impact on market prices due to their ability to execute large buy or sell orders.
Recent data suggests that whales have been accumulating XRP, with whale-to-exchange transfers dropping to zero. This indicates that whales are not selling their XRP holdings, but rather holding onto them or even buying more. This accumulation by whales is often seen as a bullish signal, as it suggests that they believe the price of XRP is likely to increase in the future.
In addition to whale activity, there are also signs of increasing institutional buying of XRP. Institutional investors, such as hedge funds, asset managers, and corporations, are increasingly allocating capital to cryptocurrencies, including XRP. This increased institutional adoption can drive up the price of XRP and provide a more stable foundation for its long-term growth.
Breakout Above $2.20: A New Support Level
Another factor driving the renewed interest in XRP is the recent breakout above $2.20. This breakout is significant because it confirms a new support level for XRP. A support level is a price level at which buyers are likely to step in and prevent the price from falling further.
The breakout above $2.20 suggests that there is strong buying pressure for XRP at this level. This buying pressure could be driven by a combination of factors, including whale activity, institutional buying, and rising retail interest.
Consolidation Below $2.20: A Pause Before the Next Rally?
After breaking out above $2.20, XRP has entered a period of consolidation below this level. This consolidation phase is a normal part of the market cycle, allowing the market to digest the recent gains and prepare for the next leg up.
During the consolidation phase, the price of XRP is likely to fluctuate within a narrow range. This fluctuation can create opportunities for traders to buy low and sell high, but it can also be a period of uncertainty for investors.
The key question is whether the consolidation phase is a temporary pause before another rally or a sign that the breakout above $2.20 was a false signal. If the price can hold above $2.20 and eventually break out above the upper resistance levels, it would confirm the validity of the breakout and increase the likelihood of XRP reaching $3.
Potential for XRP to Reach $3.40: A Technical Target
Several analysts have suggested that XRP could potentially reach $3.40 in the near future. This target price is based on technical analysis, which involves studying price charts and other market data to identify patterns and predict future price movements.
One of the technical indicators that suggests a potential rally to $3.40 is the bull flag pattern. The bull flag is a bullish continuation pattern that signals a continuation of an existing uptrend. If XRP can break out above the upper trendline of the bull flag, it could potentially reach $3.40.
Another technical indicator that suggests a potential rally to $3.40 is the Fibonacci retracement levels. Fibonacci retracement levels are horizontal lines that are drawn on a price chart to identify potential support and resistance levels. If XRP can break above the Fibonacci retracement levels, it could potentially reach $3.40.
Technical Indicators: CMF and MACD Show Bullish Momentum
In addition to the bull flag pattern and Fibonacci retracement levels, other technical indicators also suggest that XRP is poised for a potential rally.
The Chaikin Money Flow (CMF) is a technical indicator that measures the amount of money flowing into or out of an asset. A positive CMF value indicates that money is flowing into the asset, which is a bullish signal. The CMF for XRP is currently positive, suggesting that there is strong buying pressure for the cryptocurrency.
The Moving Average Convergence Divergence (MACD) is a technical indicator that shows the relationship between two moving averages of an asset's price. A bullish MACD crossover occurs when the MACD line crosses above the signal line, which is a bullish signal. The MACD for XRP is currently showing a bullish crossover, suggesting that the cryptocurrency is poised for a potential rally.
Factors Hindering XRP's Ascent
While there are several factors that suggest XRP could reach $3 or even $3.40, it is important to acknowledge that there are also factors that could hinder its ascent.
• Regulatory Uncertainty: XRP has faced regulatory challenges in the past, and ongoing regulatory uncertainty could dampen investor sentiment and prevent the cryptocurrency from reaching its full potential. The lawsuit filed by the Securities and Exchange Commission (SEC) against Ripple Labs continues to cast a shadow over XRP's future.
• Market Volatility: The cryptocurrency market is known for its volatility, and sudden price swings could wipe out gains and deter investors.
• Competition: XRP faces competition from other cryptocurrencies and traditional payment systems.
• Demand Fades: If demand for XRP fades, the price could fall back to previous support levels, such as $1.54.
XRP Bulls On Alert: 'This Trendline Is Everything'
Despite the potential challenges, XRP bulls remain optimistic about the cryptocurrency's future. Many analysts have emphasized the importance of a key trendline, stating that "this trendline is everything." This trendline represents a critical support level that must be maintained for XRP to continue its upward trajectory.
If XRP can hold above this trendline, it would signal that the bullish momentum remains intact and that the cryptocurrency is on track to reach its potential targets. However, if the price breaks below this trendline, it could indicate that the bullish momentum is fading and that a further correction is likely.
XRP Price Prediction: Possible Bullish Moves Ahead
Based on the current market conditions, technical indicators, and whale activity, there are signs that suggest possible bullish moves ahead for XRP. However, it is important to remember that the cryptocurrency market is inherently unpredictable, and there is no guarantee that XRP will reach $3 or $3.40.
Investors should carefully consider the risks involved and conduct thorough research before making any investment decisions. It is also important to diversify your portfolio and avoid putting all of your eggs in one basket.
Conclusion
Searches for "XRP to $3" have surged, reflecting renewed optimism among investors as the token exhibits signs of increased whale activity, institutional buying, and rising retail interest. The breakout above $2.20, the consolidation phase below this level, and the potential for XRP to reach $3.40 are all factors that have contributed to this renewed interest.
However, it is important to acknowledge that there are also factors that could hinder XRP's ascent, such as regulatory uncertainty, market volatility, and competition. Investors should carefully consider the risks involved and conduct thorough research before making any investment decisions.
Ultimately, the future of XRP's price will depend on a complex interplay of technical factors, market sentiment, and fundamental developments. By staying informed and using proper risk management techniques, investors can position themselves to potentially profit from XRP's continued growth and success. As always, remember to consult with a qualified financial advisor before making any investment decisions. The potential for XRP to reach $3 offers a tantalizing glimpse of potential gains, but prudent analysis and risk mitigation are essential for navigating the volatile world of cryptocurrency.
HolderStat┆XRPUSD held the supportBINANCE:XRPUSDT on the 16h chart is showing strength above $2.05 after breaking out from consolidation. The path is clear toward $2.30 and $2.60 as buyers regain control. The bullish pattern sequence continues to develop.

XRP Price Soars Past $2.15: Next Stop $2.38? XRP Price Prediction: What’s Next After Breaking $2.15 Resistance?
Ripple’s XRP has been making waves in the cryptocurrency market, recently breaking above the critical $2.15 resistance level and surging nearly 8% in the last 24 hours to trade at $2.18. With a further 9% climb in recent sessions and open interest jumping to $3.77 billion, the coin is showing strong bullish momentum. Analysts are now eyeing targets of $2.33 and even $2.38 in the near term. But what lies ahead for XRP after this breakout? Is this the start of a sustained rally, or could resistance at higher levels cap the gains?
________________________________________
XRP Price Action: Breaking Key Resistance at $2.15
XRP’s recent price surge has caught the attention of traders and investors alike. After trading in a consolidation range for weeks, the cryptocurrency initiated a fresh increase from the $1.92 zone, gaining momentum as it approached the $2.00 level. A significant development came when XRP broke above a key bearish trend line with resistance at $2.00 on the hourly chart of the XRP/USD pair (data sourced from Kraken). This breakout was followed by a decisive move past the $2.15 resistance, a level that had previously capped upward movements.
Currently, XRP trades above $2.18, sitting comfortably above the 100-hourly Simple Moving Average (SMA), a widely watched indicator of short-term trend direction. The price action over the last 24 hours shows an 8.2% increase, with some sessions recording gains as high as 14%, particularly following geopolitical developments like the Iran-Israel ceasefire, which boosted risk assets across markets. This recovery from the $1.90 low demonstrates strong buying interest and renewed confidence in XRP’s potential.
The immediate question for traders is whether XRP can sustain this momentum. The next resistance zone lies between $2.20 and $2.33, with some analysts even targeting $2.38 based on rising open interest and market volume. A close above $2.18 in the coming hours could signal the start of another leg up, while failure to hold this level might see a pullback toward $2.10 or lower.
________________________________________
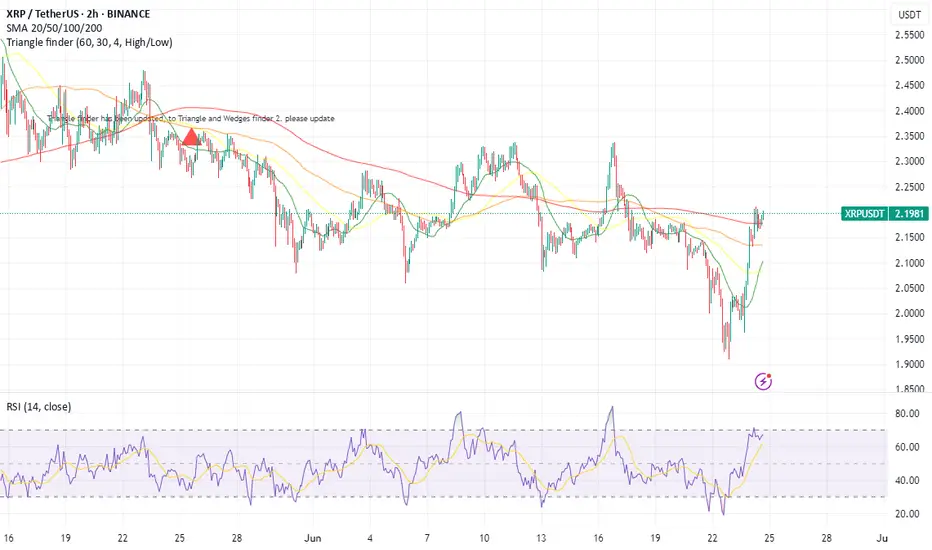
Technical Analysis: Bullish Indicators and Key Levels to Watch
To understand XRP’s potential trajectory, let’s dive into the technical indicators and key levels shaping its price action.
Support and Resistance Levels
• Support: The $2.10 level, previously a resistance, now acts as a near-term support alongside the 100-hourly SMA. A break below this could see XRP test the $2.05 zone, with further downside potential to $1.92 if bearish pressure mounts.
• Resistance: The immediate hurdle lies at $2.20, a psychological barrier that has historically posed challenges. Beyond this, $2.33 emerges as a critical target, as breaking this level could confirm a short-term bullish continuation. Analysts also highlight $2.38 as a feasible target if momentum persists.
Moving Averages and Trend Indicators
XRP’s position above the 100-hourly SMA is a bullish sign, indicating that buyers are in control of the short-term trend. Additionally, the price recently crossed above the 50-hourly SMA during its 14% surge, further reinforcing the bullish outlook. The convergence of these moving averages suggests that a golden cross—a bullish signal where a shorter-term average crosses above a longer-term average—could be forming on lower timeframes, potentially attracting more buyers.
Relative Strength Index (RSI)
The RSI on the hourly chart currently sits around 65, indicating that XRP is approaching overbought territory but still has room to run before reaching extreme levels (above 70). This suggests that the current rally could extend further, provided no major negative catalysts emerge.
Volume and Open Interest
One of the most encouraging signs for XRP bulls is the surge in trading volume and open interest. Open interest in XRP futures has jumped to $3.77 billion, reflecting growing speculative interest and confidence in further price gains. High volume accompanying the breakout above $2.15 adds credibility to the move, as it indicates genuine market participation rather than a low-liquidity pump.
Symmetrical Triangle Pattern
On the longer-term charts, XRP has been forming a 334-day symmetrical triangle, a consolidation pattern often preceding major breakouts. Analysts predict that this pattern could resolve between July and September 2025, with potential targets ranging from $2 to $5 depending on the direction of the breakout. The recent move above $2.15 could be an early indication of bullish intent, though confirmation of a full breakout from the triangle remains months away.
________________________________________
XRP Price Prediction: Short-Term Outlook (Next 24-48 Hours)
Given the current momentum, XRP appears poised for further gains in the immediate term. Analysts predict a potential 7% move toward $2.33 within the next 24 hours if the price maintains its position above $2.18. This target aligns with the upper boundary of the recent trading range and represents a key Fibonacci retracement level from the prior downtrend.
However, traders should remain cautious of the $2.20 resistance zone, where selling pressure could emerge. A failure to close above this level on the hourly or 4-hour charts might trigger profit-taking, leading to a pullback toward $2.10 or $2.05. On the flip side, a decisive break above $2.20 with strong volume could pave the way for a test of $2.33 and potentially $2.38 in the coming days.
________________________________________
What XRP Users Are Talking About This Week: Rumors, Predictions, and Debates
The XRP community has been abuzz with discussions this week, fueled by the coin’s impressive price action and broader market developments. Here are some of the key topics dominating conversations on platforms like Twitter, Reddit, and crypto forums:
1. Geopolitical Impact on XRP: The recent Iran-Israel ceasefire has been credited with boosting risk-on sentiment across markets, including cryptocurrencies. Many XRP holders believe this event contributed to the 14% surge that saw the price reclaim $2.00, with some speculating that further de-escalation could drive additional gains.
2. Regulatory Clarity for Ripple: Ongoing debates about Ripple’s legal battle with the U.S. Securities and Exchange Commission (SEC) continue to influence sentiment. While a resolution seems closer than ever, with rumors of a potential settlement circulating, uncertainty remains a key concern. A favorable outcome could act as a major catalyst for XRP, potentially pushing it toward new highs.
3. Adoption and Utility: XRP users are excited about Ripple’s continued partnerships with financial institutions for cross-border payments. Recent announcements of pilot programs in new regions have fueled speculation that increased adoption could drive organic demand for XRP, supporting long-term price appreciation.
4. Price Predictions: Community predictions range from conservative targets of $2.50 in the near term to more ambitious forecasts of $5 or higher by the end of 2025. Much of this optimism hinges on the symmetrical triangle breakout expected next year, as well as broader market trends like the Bitcoin halving in 2024.
These discussions highlight the mix of optimism and caution within the XRP community. While the recent breakout has bolstered confidence, many users remain wary of external factors like regulatory developments and macroeconomic conditions that could impact the coin’s trajectory.
________________________________________
XRP Climbs 9% as Open Interest Jumps to $3.77B: Eyes $2.38 Target
XRP’s 9% climb in a recent session, coupled with open interest soaring to $3.77 billion, underscores the growing interest from both retail and institutional traders. Open interest represents the total value of outstanding derivative contracts, and its sharp increase suggests that market participants are betting on continued price movement—likely to the upside given the current trend.
This surge in open interest aligns with XRP’s break above $2.15, reinforcing the notion that the rally has strong backing. Analysts now eye a $2.38 target, which corresponds to the 61.8% Fibonacci retracement level from the previous major swing high to low. Achieving this target would require sustained buying pressure and a break above the $2.33 resistance, but the current market dynamics suggest it’s within reach if no major sell-offs occur.
However, high open interest also introduces the risk of volatility. If the price fails to break higher and sentiment shifts, a wave of liquidations could amplify downside moves. Traders should monitor funding rates on futures platforms to gauge whether speculative positions are becoming overly leveraged, as this could signal an impending correction.
________________________________________
Ceasefire Boosts XRP Recovery: Bullish Continuation
Above $2.33?
The geopolitical landscape has played a surprising role in XRP’s recent recovery. Following a low of $1.90 amid broader market uncertainty, the announcement of a ceasefire between Iran and Israel injected optimism into risk assets, including cryptocurrencies. XRP responded with a 14% jump to reclaim the $2.00 level, a move that has since solidified with the break above $2.15.
This recovery highlights XRP’s sensitivity to external catalysts. While technical factors like resistance levels and chart patterns drive day-to-day price action, macro events can act as significant tailwinds or headwinds. If the ceasefire holds and global markets remain stable, XRP could see continued buying interest from investors seeking exposure to high-growth assets.
The key level to watch now is $2.33. A break above this resistance with strong volume could confirm a short-term bullish continuation, potentially targeting $2.38 or higher. Conversely, if geopolitical tensions resurface or broader market sentiment sours, XRP might struggle to maintain its gains, with $2.10 acting as the first line of defense.
________________________________________
When Will XRP Price Hit All-Time High? Timeline Revealed
XRP’s all-time high (ATH) of $3.84, reached during the 2017-2018 bull run, remains a distant target for many holders. However, recent technical developments and market trends provide clues about when the coin might approach or surpass this level.
Symmetrical Triangle Breakout: July–September 2025
As mentioned earlier, XRP has been forming a 334-day symmetrical triangle on the weekly chart, a pattern characterized by converging trendlines as price swings narrow over time. Such patterns often precede significant breakouts, with the direction determined by market sentiment at the time of resolution. Analysts predict that this triangle could break between July and September 2025, offering a window for a major price move.
If the breakout is bullish, targets range from $2 (a conservative estimate based on prior resistance) to $5 (a more optimistic projection based on the triangle’s height). A $5 target would represent a new ATH, surpassing the 2018 peak by over 30%. This scenario assumes favorable market conditions, including a broader crypto bull run potentially triggered by the Bitcoin halving in 2024.
Factors Influencing an ATH
Several factors could influence whether XRP reaches a new ATH within this timeline:
• Regulatory Resolution: A positive outcome in Ripple’s SEC lawsuit could remove a major overhang, unlocking significant upside potential.
• Market Cycles: Crypto markets often follow cyclical patterns, with bull runs occurring every 3-4 years. If 2025 aligns with the next cycle peak, XRP could ride the wave to new highs.
• Adoption Growth: Increased use of XRP for cross-border payments through RippleNet could drive organic demand, supporting a higher price floor.
• Macro Environment: Favorable economic conditions, such as low interest rates or stimulus measures, could boost risk assets like XRP.
While predicting an exact date for an ATH is impossible, the July–September 2025 window provides a reasonable timeframe for a potential breakout. Investors should remain attentive to technical confirmation and external catalysts as this period approaches.
________________________________________
XRP Price Reclaims Key Resistance: Are More Gains on the Horizon?
XRP’s reclaiming of the $2.10 and $2.15 levels marks a significant milestone in its recovery from the $1.92 low. This move above key resistance zones suggests that bullish momentum is building, with the potential for further gains if higher levels are breached.
The price is now trading above $2.18, and a close above $2.20 could signal the start of a fresh increase. However, the $2.20-$2.33 range remains a critical battleground. Bulls will need to defend recent gains while pushing for a decisive break above these levels to confirm the next leg up. If successful, targets of $2.38 and beyond come into play, aligning with analyst predictions and Fibonacci extensions.
On the downside, a failure to hold $2.10 could see XRP retest lower supports at $2.05 or $1.92. Such a pullback would not necessarily invalidate the bullish trend but could delay the anticipated rally toward higher targets. Traders should use stop-loss orders and monitor volume trends to manage risk during this volatile period.
________________________________________
Long-Term XRP Price Prediction: $2 to $5 by 2025?
Looking beyond the immediate term, XRP’s long-term outlook remains optimistic, contingent on several key developments. The symmetrical triangle pattern, if resolved bullishly, could propel XRP toward $2-$5 by the end of 2025. This range accounts for both conservative and aggressive scenarios, with the higher end assuming a full market cycle peak and positive catalysts like regulatory clarity.
Even in a more cautious scenario, XRP appears well-positioned to reclaim its prior highs above $3 if adoption continues to grow and broader crypto sentiment remains favorable. Key drivers include Ripple’s expansion into new markets, potential listings on major exchanges post-SEC resolution, and technological upgrades to the XRP Ledger that enhance scalability and utility.
However, risks remain. Regulatory setbacks, competition from other payment-focused cryptocurrencies, and macroeconomic downturns could cap XRP’s upside. Investors with a long-term horizon should diversify their portfolios and remain adaptable to changing market conditions.
________________________________________
Conclusion: XRP’s Path Forward After $2.15 Breakout
XRP’s recent breakout above the $2.15 resistance has ignited optimism among traders and investors, with the coin now trading at $2.18 after an 8.2% surge in 24 hours. Technical indicators like the 100-hourly SMA and rising open interest of $3.77 billion support a bullish near-term outlook, with targets of $2.33 and $2.38 in sight if momentum holds. The geopolitical boost from the Iran-Israel ceasefire and ongoing community discussions about adoption and regulation further fuel the narrative of potential gains.
In the short term, XRP must overcome resistance at $2.20 to confirm the next leg up, while holding support at $2.10 to avoid a pullback. Looking further ahead, the symmetrical triangle pattern suggests a major breakout window between July and September 2025, with price targets ranging from $2 to $5—potentially marking a new all-time high if conditions align.
While challenges like regulatory uncertainty and market volatility persist, XRP’s current trajectory indicates that more gains could be on the horizon. Traders and investors should stay vigilant, monitoring key levels, volume trends, and external catalysts to capitalize on this evolving opportunity. Whether XRP sustains its rally or faces a correction, one thing is clear: the cryptocurrency remains a focal point of excitement and speculation in the ever-dynamic crypto market.
XRP About to Break Out! 3.40 Target.Trading Fam,
It's really this simple. This is a bullish triangle. Three hits in the premium buy zone (bottom of the triangle) and we're done. Once we break, there will be some resistance at that VRVP PoC (2.39) and then we're gone. 3.40 is an easy target.
Stew

Xrpusd cup and handle targetIf xrp triggers the current bullflag its in on the daily chart it should take price ell above the neckline of the cup and handleshown here on this chart and trigger its breakout as well which has a breakout target around $6.70. *Not financial advice*

2 potential breakout targets for the symmetrical triangle on xrpDepends on if the green trendline is the more valid top trendline or the light blue one is. *not financial advice*
XRP road map (Daily)This could be the last chance for Ripple; if the triangle breaks downward, the price could enter a channel below $2.
Best regards CobraVanguard.💚

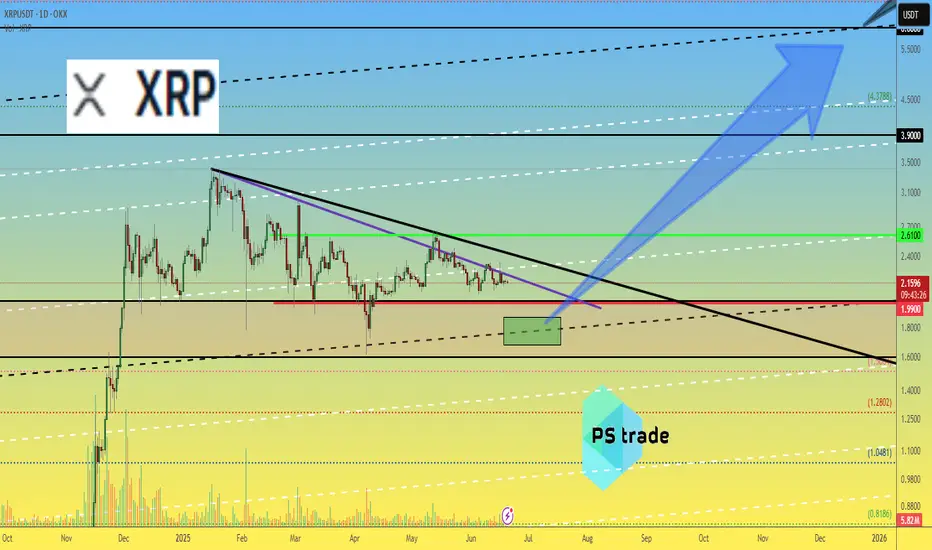
Ripple XRP price analysisCRYPTOCAP:XRP is another candidate that is predicted to launch an ETF in the foreseeable future.
The price of OKX:XRPUSDT is currently holding very well, and if this trend continues, it will be a very lucky thing if we can buy in the range of $1.68-1.88.
📊 And from there, the price should be heading for $6-6.25.
However, #Ripple is such a “specific coin” that first needs to be infused for 2-7 years before starting a good upward trend)
🧡 Do you hold it? Do you believe in continued growth? When is that CRYPTOCAP:XRP at $10?)
_____________________
Did you like our analysis? Leave a comment, like, and follow to get more
HolderStat┆XRPUSD correction from the trend lineOKX:XRPUSDT found footing at 2.09 and now grinds beneath descending resistance. Regaining 2.18 should unlock a glide toward 2.25-2.35 inside the larger bull channel, whereas failure to defend 2.05 risks a trip to 1.95 reload territory.

XRPUSDT Forming 2017-Style Flag — Major Breakout Loading! BINANCE:XRPUSDT is currently forming a classic bullish flag pattern, a setup that looks strikingly similar to what we saw back in 2017 before CRYPTOCAP:XRP went on a massive run. The price has been consolidating within a tight range, and this could be the calm before a powerful breakout.
Back in 2017, a similar flag formation led to a parabolic uptrend once the resistance was broken. While history doesn’t repeat exactly, this pattern suggests the potential for a significant upside move if the breakout confirms. Traders and investors should keep a close eye on this structure — a breakout from this flag could reignite bullish momentum and open the door for a sharp rally.
This is a buy and hold scenario for those who believe in XRP’s potential, but remember — risk management is key. Always use a stop loss below the flag support to protect your capital. Momentum could build quickly, so stay alert and watch for volume confirmation on the breakout.

XRP - Trade The Range!Hello TradingView Family / Fellow Traders. This is Richard, also known as theSignalyst.
📈XRP has been trading within a range between $2 and $2.35 in the shape of a flat rising broadening wedge pattern in red.
🏹 The highlighted blue circle is a strong area to look for buy setups as it is the intersection of the green support and lower red trendline acting as a non-horizontal support.
📚 As per my trading style:
As #XRP approaches the blue circle zone, I will be looking for bullish reversal setups (like a double bottom pattern, trendline break , and so on...)
📚 Always follow your trading plan regarding entry, risk management, and trade management.
Good luck!
All Strategies Are Good; If Managed Properly!
~Rich
