XRP HODL WE GOING TO THE MOON! XRP STANDARD)TECHNICAL ANALYSIS- FUNDAMENTAL ANALYSIS- NEWS- SIGNAL- FIB LEVELS- PRICE ACTION
*XpringKit provides a Swift based SDK for interacting with Xpring Platform (XRP/ILP)
Standing on the doorstep of a new year and a new decade, it is hard to believe that the first real public engagement with digital assets began only a few short years ago in 2017. Over that year and into the next, speculators and media coverage drove wild fluctuations in interest and price—contributing to a series of both spectacular rises and precipitous falls in each.
But that digital asset roller coaster ride smoothed out over the course of 2019 as speculation subsided and specialized use cases began to emerge. That utility helped demonstrate value in digital assets beyond trading and contributed to increased stability.
While skeptics and critics might still view digital assets as a giant game of Jenga, just waiting for a wrong move to send all the blocks tumbling down, we here at Ripple see the future of digital assets as more like a vast set of Legos. By carefully piecing them together, it’s possible to reimagine familiar worlds or create entirely new ones.
Looking ahead, we believe 2020 will reveal new technologies and applications for digital assets that can lead to meaningful, tangible change across a wide range of industries. In particular, we expect three major themes to develop in this first year of the new decade that will lead to a more mainstream embrace of digital assets.
Digital Assets Underpin Consumer Financial Products
XRP is a digital asset custom-designed to facilitate cross-border payments. A number of companies, including MoneyGram and goLance, and applications have endorsed this use case and we anticipate even more will join the adoption curve over the coming year. But our team expects other digital assets and use cases to find traction in the coming year and decade.
Ripple SVP of Product Asheesh Birla predicts that mobile wallets will enter the blockchain and crypto industries in a big way. Specifically, he believes that “adoption of digital assets and blockchain technology among mobile wallets and super-apps like Gojek, Grab and PayPal will become more mainstream as they look to expand their services to keep up with customer demand and compete with digital banks.”
According to Asheesh, that adoption will continue expanding to include new credit and loan products. He expects that these more mainstream use cases will first emerge in developing markets like Kenya, Nigeria and parts of Latin America where the need is most acute. These applications will be aided by friendlier regulations towards digital assets, which will also make them more attractive to tech companies seeking paths to expansion.
Similarly, Ripple SVP of Customer Success Marcus Treacher sees international and micropayments expanding to facilitate new consumer uses. In particular, he envisions purchase solutions for tourists and travelers that no longer rely on cards or card rails taking root in 2020.
“Imagine if a Japanese tourist visiting Thailand could buy goods using a mobile app or QR code, triggering an immediate cross-border payment from their Japanese yen account to a Thai baht merchant’s account. If more consumer purchase solutions start leveraging blockchain technology in the same way, the payoff will—quite literally—be huge!”
Marcus also predicts that big tech companies will continue to enter the payment space, hastening the growth of micro and wallet payments supporting immediate, low-value payment flows. This expansion of micropayments beyond traditional messaging apps like Telegram and Line to deep pocketed enterprises should create a resulting surge of developers flocking to digital assets.
Institutional Adoption of Digital Assets Accelerates
For digital assets and associated applications to have long-term staying power, institutional players must embrace the technology. We anticipate that just such a wave of institutional adoption will begin in 2020 with more traditional firms deploying digital asset and blockchain-based solutions.
Breanne Madigan, our Head of Global Institutional Markets, says this will be enabled by trusted custody brands such as State Street or Bank of New York becoming involved in digital assets. “The presence of recognized players will increase institutional confidence in the space and pave the way for greater institutional adoption next year,” explains Breanne.
CEO Brad Garlinghouse is even bolder, predicting that half of the top 20 biggest banks in the world will actively hold and trade digital assets in 2020. He is also one of many on the team that believes fiat currencies will go digital in the next year.
While SVP of Xpring Ethan Beard expects at least one central bank to launch a tokenized representation of their fiat currency in 2020, Brad forecasts at least one non-G20 currency—like the Argentine peso or similar—will become fully digitized within the next year. Xpring SDK provides the ability to work with PayID, using libraries provided in JavaScript, Java, and Swift
The weak rebound off the support line of the symmetrical triangle indicates a lack of buyers at higher levels. Currently, the bears are attempting to sink XRP below the triangle. The downsloping 20-day EMA ($0.197) and the relative strength index in the negative territory suggests an advantage to the bears.
XRPL Labs - the innovative Ripple-backed startup has recently announced the development of a revolutionary new banking app based on the XRP Ledger called Xign. The news was announced at the recent Bitrue event in Amsterdam that took place at the end of May.Xign is a mobile app that acts as a banking app without the use of banks. It allows users to check balances and transfer dollars, euros, XRP and other cryptocurrencies.
According to the founder of nodum. io and one of the lead developers at XRPL Wietse Wind, the new app is very easy to use so that even people who aren’t familiar with crypto wallets or digital ledgers will get used to it without any worries.
At the conference, Wind said that the mobile app is very easy to use and has stated that it delivers a user experience similar to traditional online banking i.e simple.
The app comes with an easy-to-use setup guide that enables users to take advantage of the app without any issues. On top of this, it will feature an account directory with look-up and social features to facilitate the non-technical transaction for its users.
The app will also be able to approve of deny payments to different individuals and firms.
Win has made it clear that XRP will be the app’s native asset. Other servies will be added later like a prepaid ILP Wallet.
QUOTED “So, what it will allow you to do is check your balance and send your funds in any currency, because the XRP Ledger can handle any given currency issued on the ledger… We’re not building a crypto wallet. We’re building a banking app. Except, without a bank. We’re building a banking app based on a digital ledger, based on the XRP Ledger and based on ILP (Interledger Protocol).”
Major distribution territories: $0.22, $0.24, $0.26
• Major accumulation territories: $0.18, $0.16, $0.14
BUY XRPUSD WE GOING TO THE MOON
ENTRY 1 $0.20580 & ENTRY 2 $0.18468 SL $0.16460
TP.1 $0.21468 --TP.2 $0.24580 --TP.3 $0.29468
TP.4 $0.34580--- TRAIL STOP LOSS FROM TP.3)
tp.5 $0.48468 tp.6 $0.68580 TP.7 $1.11
TP.8 $3.30--TP.9--$8.50--TP.10 $12.50
The market point between XRP and the US dollar yet continues trade around the same range trading territory of $0.20 mark as kept quite a while. Neither the base nor the counter has been able to make a significant move away from the range line.
All in all, XRP/USD buyers have been struggling to not to let down the crypto’s valuation goes below the previous low of $0.18 point. Meanwhile, bears have continued to press down the crypto’s price from a line a bit over the range trading area.
At the conference, Wind said that the mobile app is very easy to use and has stated that it delivers a user experience similar to traditional online banking i.e simple.
In this 2 Week chart of Ripple / United States dollar (XRP/ USD), there is a depreciating range from 0.5175 to 0.1105.
We can observe that the market then appreciated to the 0.206 level (identified by the yellow down arrow), just below the 23.6% retracement of the depreciating range at the 0.206552 level.
We can observe that XRP/USD then depreciated to the 0.1791 level, just below the 9-week Simple Moving Average .
We can also observe that the 0.1791 level was just below the 0.183462 level, representing the 23.6% retracement of the appreciating range from 0.1105 to 0.206.
If XRP/USD resumes its depreciation, price retracement levels below the current market include the 0.169519 ( 38.2% retracement ), 0.15825 ( 50% retracement ), 0.146891 ( 61.8% retracement ), and 0.130937 ( 78.6% retracement ) levels.
If XRP/USD resumes its appreciation, price retracement levels above the current market include the 0.265974 ( 38.2% retracement ), 0.314 ( 50% retracement ), 0.362026 ( 61.8% retracement ), and 0.430402 ( 78.6% retracement ) levels.
BUY XRPUSD WE GOING TO THE MOON
ENTRY 1 $0.20580 & ENTRY 2 $0.18468 SL $0.16460
TP.1 $0.21468 --TP.2 $0.24580 --TP.3 $0.29468
TP.4 $0.34580--- TRAIL STOP LOSS FROM TP.3)
tp.5 $0.48468 tp.6 $0.68580 TP.7 $1.11
TP.8 $3.30--TP.9--$8.50--TP.10 $12.50
Rippleanalysis


XRP to the Next MoveSelling Pressure everywhere right now. Bears are pushing down every markets.
XRP is recovering but it didn't break at all his Bearish Downtrend for now.
Monthly looks good but short term looks weak.
if we not bounce right now. i recommend a safe buy around 0.24$, sell back around 0.35$ and wait for strong breakout.
i will post a far view to make you understand where we are.
Remember that patience is the key.
Happy Tr4Ding !


Don't miss the great buy opportunity in XRPUSDTrading suggestion:
. There is a possibility of temporary retracement to suggested support line (0.2698). if so, traders can set orders based on Price Action and expect to reach short-term targets.
Technical analysis:
. XRP/U.S. Dollar is in a uptrend and the Continuation of uptrend is expected.
.The price is above the 21-Day WEMA which acts as a dynamic support.
. The RSI is at 58.
Take Profits:
TP1= @ 0.3400
TP2= @ 0.3790
TP3= @ 0.5095
SL= Break below S2

Ripple may be on the foot of the breakoutRipple forming head & shoulders patter. Volume is right neckline is descending. We wait for the formation of right shoulder to confirm reversal.

There is a possibility for the beginning of an uptrend in XRPUSDTechnical analysis:
. Ripple/Dollar is in a range bound and the beginning of uptrend is expected.
. The price is below the 21-Day WEMA which acts as a dynamic resistance.
. The RSI is at 42.
Trading suggestion:
. There is a possibility of temporary retracement to suggested support zone (0.18300 to 0.148). if so, traders can set orders based on Price Action and expect to reach short-term targets.
Beginning of entry zone (0.183)
Ending of entry zone (0.148)
Entry signal:
Signal to enter the market occurs when the price comes to " Buy zone " then forms one of the reversal patterns, whether " Bullish Engulfing ", " Hammer " or " Valley " in other words, NO entry signal when the price comes to the zone BUT after any of reversal patterns is formed in the zone. To learn more about " Entry signal " and the special version of our " Price Action " strategy FOLLOW our lessons :
Take Profits:
TP1= @ 0.2300
TP2= @ 0.2805
TP3= @ 0.3300
TP4= @ 0.3800
TP5= @ 0.4240
TP6= @ 0.4800
TP7= @ 0.5700
TP8= @ 0.7615
TP9= @ 0.9145
TP10= @ 1.37050
TP11= Free
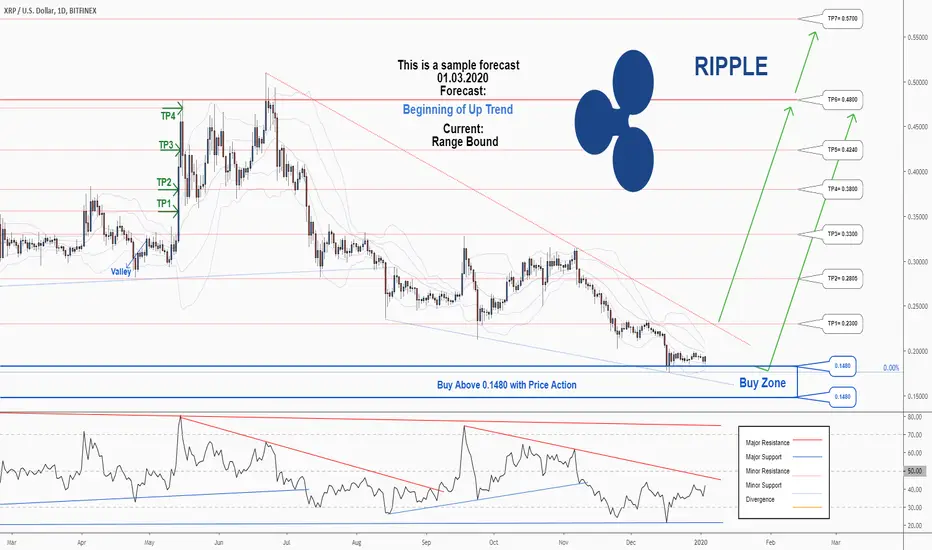
Don't miss the great buy opportunity in XRPUSDTrading suggestion:
. There is a possibility of temporary retracement to suggested support line (0.2236). if so, traders can set orders based on Price Action and expect to reach short-term targets.
Technical analysis:
. XRPUSD is in a range bound and the beginning of uptrend is expected.
. The price is below the 21-Day WEMA which acts as a dynamic resistance.
. The RSI is at 34.
Take Profits:
TP1= @ 0.2495
TP2= @ 0.3145
TP3= @ 0.3800
SL= Break below S2

XRP Technical Analysis:3 Things You Must KnowConclusion for today's Ripple Analysis: A close above ~$0.41 implies more bullish action in XRPUSD.
XRP technical analysis for today is carried out on the Daily timeframe using a log scale. Chart patterns are examined, as well as the 200 day moving average plotted to help in providing guidance for future price development.
Three (3) key points to keep in mind moving forward into the week of October 27, 2019 are the following:
(1) Bearish trendline: Peaks in XRPUSD on April 23, 2019, September 21, 2019 and June 22, 2019 are used to draw its bearish trendline that provides a point of reference for price and also context. A close above the bearish trendline can be employed as part of a very conservative strategy to enter long (buy) trades.
(2) 200 Day moving average: This also provides additional evidence for the current bearish swing in the price of Ripple (XRPUSD). The slope of the moving average flattening out (i.e. zero) implies indecision, and therefore requires monitoring for future development of price action.
A change from zero to positive slope is evidence of renewal of bullish strength in Ripple.
Therefore, price closing above the moving average is a good sign for continuation of bullish strength with the next challenge anticipated at the bearish trendline.
(3) Bottoming price action in XRP: August 15, 2019 and September 24, 2019 saw XRP fail to follow through with its bearish momentum and a lack of price close below ~0.22. The most recent test close to the 0.22 price level occurred on October 23, 2019 with price eventually resolving to the upside. A bullish swing in price is therefore implied, while price closing below ~0.24 diminishes the chances of higher prices.

XRPUSD (Ripple) At Support At the same time that Bitcoin just hitted a huge support lever XRPUSD is also at a triple bottom support level,
we might see XRP recover quite a bit after confirming that its actually going to go up, dont just jump in lets wait for the confirmation.
Check out my previous post on bitcoin where I described in full length how to look for the confirmation.
Be Patient...

xrp/btc is ready to go to moon! according to my analysis xrp/btc is will go up from this price because it is at strong support , descending channel broke , rsi super oversold , and got an engulfing candle so it may go to 61.8 level of fibonacci as shown above.
please like this post and share with your friends .
FOLLOW ME FOR FUTURE ANALYSIS ON OTHER PAIRS :)
disclaimer : I could be wrong please take trade at your own risk .

XRP. Time to buy! 0.28-0.32$In previous ideas, I predicted the correction of this coin, after its growth on September 20th.
At the moment, it seems to me that the crypt market correction is over. If we analyze the volumes of this coin, it is clear that the volumes became worse after the breakthrough of $ 0.38 ( for this level I published the idea on November 14 ):
Therefore, I conclude that the current price zone is interesting for buyers.
On horizontal volumes it is clear that in this zone there was a good consolidation and interest:
0.32 $ is the lower limit of this liquidity zone. Also at this price is the global wave Y = W (if not take into account the shadow of September 20) or, Y = 0.618 * W (if this shadow is taken into account):
If you take the wave Y, and divide it into a, b, c. it turns out that in the price of 0.32 and 0.28 $ there are also strong levels:
Therefore, the wave analysis only confirms that in this range should begin at least a rebound to 0.38-0.4 $. At this point, buyers should show what they are capable of. If this forecast is implemented, then I'm creating a new idea about the prospect of growth.
