XRP- Volatility alert (Volatility creates risk and opportunity)XRP has offered us tremendous opportunities to buy and sell and buy with amazing profits. One thing in common is we always study the chart and the first thing we need to identify is VOLATILITY.
After yesterday dip (which we bought nicely and had profits) we are now coming closer to a new round of expected volatility, thus find our updated new chart and beware:
THE 0.40 is as far away as the unchecked 0.40!
We still remain Bullyish and we keep currently a 62% buy 38% sell probability (and positions).
We have cashed profits again yesterday and took profits from 0.50 (we try to keep our best position(s) open and take profit on the second, third, fourth and so one. Yesterday alone we compounded and took profit on 18 positions in total but now is time to go back to keeping our balance and our sell positions are back to create the right equilibrium in our margin, exposure, risk management.
So be aware because there will be opportunities again, to buy or to sell nobody knows but most likely we think it will be a dip and then a time to buy again.
Rippleforecast


XRP - Our take profit levels (potential rise to monthly highs)Our take profit levels:
remember: we like to take profit gradually and now that the positions are in the money our stop loss is at entry so we risk only our profits!

XRP -Big chartXRP has stopped right on our calculated first support, a rebound is now possible but the possibility for the price to break down to the second or third levels is also valid.
We have been using a special strategy that we teach and are now closing some sell positions.
Contact us for more info.
Havign a chart is one thing, knowing how to trade it is a different matter.

XRP - Stopped on 1st supportXRP has stopped right on our calculated first support, a rebound is now possible but the possibility for the price to break down to the second or third levels is also valid.
We have been using a special strategy that we teach and are now closing some sell positions.
Contact us for more info

XRP-3h. The sellers had a chance to test $0.45.XRP made a fantastic price jump in November.
Looking at the trading volumes in December , buyers decided to rest.
The previous local sellers accumulation in the range of $0.62-0.63 resisted the attack of buyers. Now the main question is whether the mark of $0.575 will keep . Rest is important. The main thing is that sellers do not lower the price to $0.45 during this time.
________________________
We create both short-term ideas (for a local understanding of the market situation) and medium-term forecasts of price movements.
Subscribe to us and get daily concise analytics!

XRP - Time to try another BUY here tooBuying this small dip. Keep in mind our previous charts for details

XRP Next Legeverything mostly in Graph. as you can see with VP, we are in a good demand Zone. we bounced 1 time on EMA50, 1 more time on EMA100.
i used H4 TF for more visibility.
3 options :
1. We break this descending Triangle now, we could have a resistance around 0.7$, we could push 0.85ish and max 1$
2. We don't break the triangle now, we could retrace to 0.55$ (EMA100) and bounce again for a break to go to option 1 (but lower high).
3. We don't break the triangle now, we retrace to EMA100 0.55% and dip to to EMA200 0.45$.
imo the situation is bullish for now so i mostly like Option 1 and 2. Watch the King first and alts will do their way.
No matter where u take your positions but avoid to trade near triangle borders.. patience is a vertue.
Happy Tr4Ding !

XRP - Analysis broken down by checked levelsOur prognosis for Ripple remains positive :
We estimate that the price has 65% chance (2/3) to reach the resistance at 0.77 before it tests the support of 0.545 for the third time.
1. Support 4 at 0.25 has been untested, since the price flew on Nov 20- Nov 23rd.
2. Supports 2 and 3 have both been tested and checked.
Rejection at the 0.77 level on Nov 24th was strong, but given the price had risen for over 100% in 40 days (0.30 to 0.70 from Nov 20 to Nov 24) it makes sens .
IN THE SAME MANNER THE RISE FROM 0.78 TO NEXT LEVEL OF 1. 40 CAN BE AGAIN EXPLOSIVE!! But first the 0.78 level must be breached.

XRP - Big Chart for EOY prognosisOur prognosis for Ripple remains positive :
We estimate that the price has 65% chance (2/3) to reach the resistance at 0.77 before it tests the support of 0.545 for the third time.
1. Support 4 at 0.25 has been untested, since the price flew on Nov 20- Nov 23rd.
2. Supports 2 and 3 have both been tested and checked.
Rejection at the 0.77 level on Nov 24th was strong, but given the price had risen for over 100% in 40 days (0.30 to 0.70 from Nov 20 to Nov 24) it makes sens .
IN THE SAME MANNER THE RISE FROM 0.78 TO NEXT LEVEL OF 1. 40 CAN BE AGAIN EXPLOSIVE!! But first the 0.78 level must be breached.

RIPPLE - Intraday Update - 12/06/20 (Short-term)RIPPLE - Intraday Update - 12/06/20 (Short-term)
Bottom Line: Subdividing higher within wave iii of (iii)
Breaking above $0.7941 is the next upside objective for the bulls.
Outlook: A fifth wave rally is in its early stages.
Note: Prices can vary between exchanges, and consequently there may be differences in our chart prices due to different data sets.

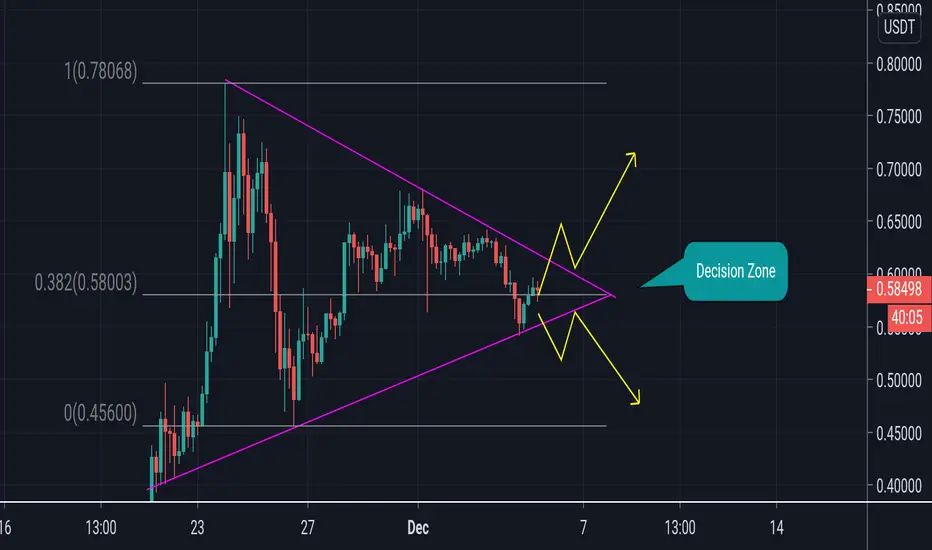
XRP (Ripple) decision zoneXRP / USDT
🌟 Techincal Analysis 🌟
Start to consolidate in the end of traingle pattern
And Testing 0.382 fib level
Big move expected soon
wait for clear Breakout before any entery
Good luck and happy trading 🌹
XRP - Support levels analytics (zoomed in)I usually share these kind of analysis with my clients only but here you go guys:
For sure many of you have been buying or trading Ripple and i try my best to help by sharing my ideas with you, a little bit more intensively on Ripple nowadays.
On this chart you will find 3 levels that they all have a big chance to make the price jump back up.
I told you, volatility was on on a simple chart
I even called when this volatility would start after a period that it was going sideways as i had prognosed
I also shared with you my prognosis for 0,77 0,97 and 1,5
I also posted on time when to buy the last dip and when to cash profit PERFECTLY
and i honestly hope i am right this time too.

XRP - Out of Ripple for now (unlike BTCUSD - it looks better)Unlike BTCUSD, which i am keeping, I am out of my Ripple trades (keeping 1 buy position form 6 that i have in total) for now.
The asset appears to be moving sideways in a channel that could equal go to 55 or 50 before it hits 68 and 75.
I prefer to focus on BTCUSD at this stage.

RIPPLE Short term minor fall back was expected towards 0.50000XRPUSD
*********
⏳30 Mins chart
🎲 Possible entry analysis
⛳️ Possible bull/bear target
📚Educational
—————-❇️——————-
Detailed analysis 💬
1️⃣ 0.80000 Acted as strong resistance-Key psychological level
2️⃣ Rising wedge pattern
3️⃣ positive risk sentiment, Vaccine news
4️⃣ 0.60000 Dynamic support and resistance
5️⃣ Strong demand for crypto's (Bircoin,Ripple,Tether,Etherium etc.,)
6️⃣ 50% Fibonacci around 0.62500
7️⃣ Technical support - short term bearish
8️⃣ 0.50000 will acted as key reversal-Bullish
9️⃣ Previous week low-Immediate resistance-Alternative bullish entry
🔟 Break and retest of the Rising wedge structure happened
#️⃣ Overall trend- bullish
—————-❇️——————-
📉 Technical bias-H4-Bearish
Price is below 50,100,200 Exponential moving average
50,200 Exponential moving average will act as support-Bear
Ichimoku cloud -cloud is still red-Middle line supports bearish trend
Bollinger band- Price reached around the lower band-Short term bullish correction towards middle band
Relative strength index - Felled below 50 - Bearish trend
MACD -Turned red and felled below the signal line, Oscillators pointing downward
Stochastic - Reached around 20- oversold condition will give a short term pull back expected
—————-✳️——————-
Key reversal area's
0.80000 psychological level
0.61675 Point of control area Volume analysis
0.79000 Nov month high
0.62480 50% Fibonacci retracement level
0.55450 Minor resistance level
0.60530 Possible entry- Bear
0.50000 Trendline resistance/Alternative bullish entry
—————-✳️——————-
Bearish entry #ripple #xrpusd
Entry price - 0.62540
Take profit 01 - 0.55450
Take profit 02 - 0.50200
🚫 Stop lose 0.63900
⬇️ 17.12% Drop expected
⤴️ Account growth 5.7: 17.1
✅ Risk reward ratio 1 : 3
—————-⚜️——————-
Push the like button , And cheer up if you found useful


XRP - Let's do it again! BUYING IT NOW ⭐⭐✅✅✅Time to get on RIPPLE BUY again
SL at 0.45
TP at 0.75, 1.25 and 1.75!

Ripple (XRP) - DUMP DUMP
670% movement per year
It is logical now to fix profit by market participants.
Now I am waiting for a false breakthrough. (in order to remove shorts from the market.
I was talking about false break out on video:
What do you think friend ?

XRPUSDt - Test PrerequisitesTest Prerequisites: Mirror level.
Trend line is punctured.
Accumulation under the trend line.
SELL STOP under the level
Dear followers, the best "Thank you" will be your likes and comments!
These ideas are not a channel with signals and I do not give recommendations on the entry/exit points.
In my reviews, I provide analytics - those data that help model potential options/scenarios for price movements
Thanks for your support!

XRP 1D. We expect $0.195Our previous XRP idea which was published almost a month ago, worked out pretty well.
The price was confidently trading in the falling channel.
It's time to correct our targets a little.
In the next few weeks, we expect the price to fall to the level $0.195. There we can buy in long with the hope of rebound.
Cancellation of this scenario means the price fixing above the level $0.256 . So far, buyers haven't been able to do it. After the buyers' efforts for 5 days, only false breakouts remained.
If you are trading XRPBTC pair - here are our thoughts:
Subscribe and like to keep abreast of ideas updates!

BUY XRPUSDXRPUSD looks like its on a long term uptrend. Buying it at this moment could bank in large potential profits. I placed my
targets based on previous levels of significance.

Ripple- back to 22?From the beginning of August, the trend for Ripple is clearly down...
Now the correction/consolidation seems to be over with a clear top at 26 zone.
I expect a continuation to the downside with a target of 22

Cup & Handle for XRPUSD From Handle min target of 0.30$
From Cup min target of 0.45$
Not financial advice
