Ripple will rise when 99% have folded.It's funny looking back at all the XRPBTC predictions. They were almost all entirely wrong.
I was one of the few who always said, forget a ripple rally before 2020.
This coin's dynamic is fascinating, because it offers extremely high potential ROI, but is also
by far the most frustrating.
That's why most people fail to make some nice gains with ripple.
They always chase after the new trendy coins which pump as early as possible.
Ripple makes most of my altcoin portfolio. But this is also the most brutal to invest.
All other coins will start rising, but Ripple? Nothing. Flat. BTC rising. Ripple? Flat. In USD
terms at least. All will start folding. Die hard ripple fans even sell their entire stashes and
pursue the new stars such as Link, etc.
Then, when XRPBTC hit rock bottom. When almost all other coins will have pumped, will XRP start.
And when it does, you better grab your seatbelts.
Only the ones with extreme psychological willpower will be rewarded by XRP.
XRPBTC will fall now, and start pumping later this year, early next year. First pump. Second pump then by mid 2021.
Target still remains 30-50 USD. Call me crazy, but you will see.
Rippleforecast

Ripple - The world’s most accessible global payments networkNo one goes into the market thinking they should buy at the high and sell at the low. The problem is that at the moment when faced with the ups and downs of the market, it’s hard to resist the urge to do those things.
Trading is all about spotting emotional excesses either to the downside or the upside.
You want to be on the right side of those emotional reactions and not the wrong.
#XRPBTC: I'm SHORT/ BEARISH position up until ( Black BOX ). I expect that $XRPUSD will rip down.
This would mean that RIPPLE will lose more 35% of its current value against BTC before it can recover.
Well, keep you updated as this timely issue evolves.
If you want to win in this market, you need to be COLD and CALCULIST .
#CRYPTO $XRPUSD #XRPBTC #XRP #RIPPLE #ALTSEASON2020
$BTC $BCH $BNB $XLM $EOS $ETH $ADA $LTC $TRX $XRP $IOTA $LINK $XTZ $BTT $XMR $NEO $BTT $MATIC $XMR $MRK $XEM $ONT $DASH $BAT $ZRX $LSK $NANO $REP
#altcoins #bitcointrading #BuyTheFear #BuyTheDip


XRP/USDT: Overextended Peak Analysis 1D (Aug. 08)X Force Global Analysis:
If you find our analyses to be helpful, make sure to support us by dropping a ‘like’
In this analysis, we take a look at XRP's daily chart to assess the bullish and bearish probabilities.
Analysis
- Similar to Ethereum, XRP has been on a parabolic rise without having had any real corrections
- Prices have overextended above the envelope indicator
- There has been a massive selloff in Aug. 02, and the volume has been decreasing dramatically since
- The Relative Strength Index (RSi) is at overbought levels, forming lower highs and lower lows
- The Moving Average Convergence Divergence (MACD) shows a potential death cross with decreasing bullish histograms
- The Stochastic Oscillator also shows a death cross, close to the overbought regions
- However, at the same time, bulls have managed to secure the 0.236 Fibonacci support
- Prices are trading above the Ichimoku Cloud, which currently shows convergence with the 0.5 Fibonacci support
What We Believe
In essence, there is no volume to support a continuation of this further uptrend, and technicals suggest a higher probability of a reversal. However, even if a corrective trend plays out, on the bigger picture, the overall bullish trend will remain valid.
Let us know what you think in the comment section below
Trade Safe.

XRP/USDT: Weekly Breakout Analysis 1W (Jul. 29)X Force Global Analysis:
If you find our analyses to be helpful, make sure to support us by dropping a ‘like’
In this analysis, we explore XRP's weekly chart through bullish reversal patterns and the Elliott Wave theory.
Analysis
- To begin with, it's important to note that XRP has been consolidating within a descending wedge for a very long time
- A bullish descending wedge during a downtrend is typically identified as a bullish reversal pattern
- XRP is currently testing the Ichimoku cloud resistance, and a break and close above for confirmation is necessary for further rally
- The Relative Strength Index (RSI) has broken out of a descending trend line resistance, reaching record high levels in months
- Nevertheless, the RSI remains at neutral levels
- The Moving Average Convergence Divergence (MACD) has formed a golden cross a while back, but seems as though the trend lacks momentum to drive prices forward to new highs
- Counting Elliott Impulse Waves (12345), we could expect this current uptrend as wave 3 playing out.
What We Believe
While XRP's setup remains extremely bullish, we have yet to witness an actual breakout through the descending trend line resistance and the Ichimoku cloud. Should confirmation be provided, we could expect a bullish rally leading to record high levels this year.
Let us know what you think in the comment section below
Trade Safe.

XRP/USDT: Bullish Elliott Wave Analysis 1D (Jul. 29)X Force Global Analysis:
If you find our analyses to be helpful, make sure to support us by dropping a ‘like’
In this analysis, we analyze XRP's daily chart through bullish patterns and Elliott Wave analysis.
Analysis
- To begin with, XRP has broken out of a bullish descending wedge
- After having formed Elliott Impulse Waves (12345), Prices started consolidating as it formed Elliott Triangle Waves (ABCDE)
- Since it has broken out, it seems as though prices are forming an impulse wave pattern once again
- Using Fibonacci retracement and pattern analysis, we could expect the breakout to lead to 0.265 USDT
- The Relative Strength Index (RSI) is at overbought territories, but shows tremendous trend strength
- The Moving Average Convergence Divergence (MACD) also shows increasing bullish histograms as a sign of strong momentum.
What We Believe
We believe that XRP is on its way to complete the breakout pattern from the descending wedge, and given that it provides further confirmation of a potential bullish rally on the longer time frames, we could even expect potential new highs.
Let us know what you think in the comment section below
Trade Safe.

XRP/USDT: Corrective Waves Above Strong Support 1H (Jul. 29)X Force Global Analysis:
If you find our analyses to be helpful, make sure to support us by dropping a ‘like’
In this analysis, we explore XRP's hourly chart, identifying key areas of interest by assessing significant support zones.
Analysis
- Just as many other altcoins on a rally, XRP is currently trading within an ascending parallel channel, forming higher lows and higher highs
- The Simple Moving Averages (SMA) are in bullish formation, with the 20 SMA at the very top, and the 50, 100, and 200 SMAs trading below as support
- Prices are also trading above the Ichimoku Cloud, as it has even bounced on the cloud before forming impulse waves
- From an Elliott Wave perspective, XRP has formed Elliott Impulse Waves (12345), and is now looking to complete an Elliott Correction Wave (ABC)
- Using the Fibonacci retracement, we could expect wave C to play down to the 0.382 Fibonacci support
What We Believe
While the overall trend remains bullish for XRP, it's important to wait for optimal entries to maximize one's position, by keeping an eye on significant support regions mentioned above.
Let us know what you think in the comment section below
Trade Safe.

XPRUSD with a solid breakout!Ripple breaking out of pennant, Short term PT 0.2364, 0.2750 very possible in around 3 months! Bellow 0.22 this chart gets invalidated.Keep your eyes on it!

Ripple Update - Cheapo - ReadJust take a step back
Incredibly cheap, think about it 0.20cents?
Fundamentals are so strong
I am long XRP
Psychological Shake
Fundamentals outshine TA
My most popular chart published :D ! Thanks everyone ^^

Ripple - $XRPBTC #XRP - To the moon is too close, go beyond!!! No one goes into the market thinking they should buy at the high and sell at the low. The problem is that at the moment when faced with the ups and downs of the market, it’s hard to resist the urge to do those things.
Trading is all about spotting emotional excesses either to the downside or the upside.
You want to be on the right side of those emotional reactions and not the wrong.
#XRPBTC : I'm SHORT/ BEARISH position up until (Black BOX). I expect that $XRPUSD will rip down.
This would mean that RIPPLE will lose more 30% of its current value against BTC before it can recover.
Well, keep you updated as this timely issue evolves.
If you want to win in this market, you need to be COLD and CALCULIST .
#CRYPTO $XRPUSD #XRPBTC #XRP #RIPPLE #ALTSEASON2020
$BTC $BCH $BNB $XLM $EOS $ETH $ADA $LTC $TRX $XRP $IOTA $LINK $XTZ $BTT $XMR $NEO $BTT $MATIC $XMR $MRK $XEM $ONT $DASH $BAT $ZRX $LSK $NANO $REP
#altcoins #bitcointrading #BuyTheFear #BuyTheDip

XRP Whats NextPrice looking to complete the rounded bottom that has formed on a strange angle
XRP has formed a giant rounded bottom, this is a long term bullish pattern
I see price falling in the short term (for traders)
TA long term holds massive promise.


XRP / U.S. DOLLAR XRPUSDIn this Weekly chart of Ripple / United States dollar (XRP/ USD), there is a depreciating range from 0.5175 to 0.1105.
We can observe that the market then appreciated to the 0.206 level (identified by the yellow down arrow), just below the 23.6% retracement of the depreciating range at the 0.206552 level.
We can observe that XRP/USD then depreciated to the 0.1791 level, just below the 9-week Simple Moving Average.
We can also observe that the 0.1791 level was just below the 0.183462 level, representing the 23.6% retracement of the appreciating range from 0.1105 to 0.206.
If XRP/USD resumes its depreciation, price retracement levels below the current market include the 0.169519 (38.2% retracement), 0.15825 (50% retracement), 0.146891 (61.8% retracement), and 0.130937 (78.6% retracement) levels.
If XRP/USD resumes its appreciation, price retracement levels above the current market include the 0.265974 (38.2% retracement), 0.314 (50% retracement), 0.362026 (61.8% retracement), and 0.430402 (78.6% retracement) levels.

XRP/USD - sell zone On the day timeframe, the triangle fell from (distribution ) downwards.
I plan to trade from the zone 0.208 - 0.21.
Indicators show the shorts in a better position.
Shorts from confirmation. Stop loss can be hidden by the level. Like I drew on the chart.
At the 4 o'clock timeframe, they're drawing a model from the bounce.
A rebound from the fall, or in other words, a correction.
Indicator AO and RSI show growth
Thanks for your support! Push like if you think this is a useful idea!

XRP Longs Short termBreak and retest of trend line. Price to try attack sell stops for liquidity before drop or break.

Ripple, Trading Plan. You will learn the best place where we can trade Ripple at low risk.
Write in the comments all your questions and instruments analysis of which you want to see.
Friends push the like button if you like the idea - that would be the best THANK YOU.
Thank you for your support, I Love it.
P.S. I personally will open entry if the price will show it according to my strategy.
Always make your analysis before a trade.

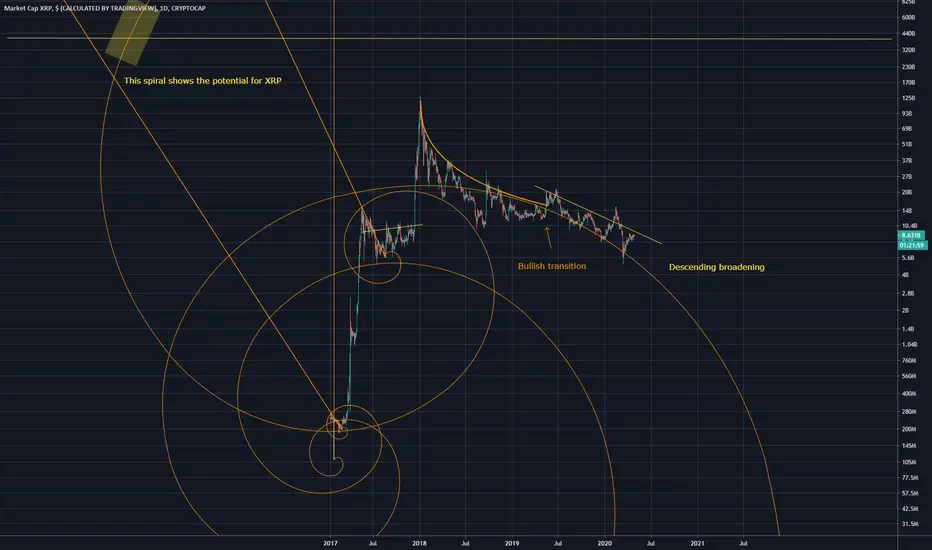
XRP cap spiralsXRP has formed a descending broadening wedge
included spirals showing the possible market cap futures highlighted in yellow rectangle
Mainly made this to show some harmonic patterns, Descending broadening wedge and the ascending wedge
Im long on this project
XRPBTC BULLPEN OPEN!!No oped on this one -- figured I'd keep it short & sweet. Head & Shoulders indicator coupled with massive volume surge led me to dig futher.
Green Horizontals represent TP1-3 with TP3 a midterm sweep.
Red horizontal worst-case stop.
Markt VOLATILITY: HIGH
Keeping this publication NEUTRAL as next move is contingent on BTC price volatility.
Risk/Reward: 25/75
BB / KC / VOL / Sqz & RSI all seem to bolster this bullish breakout (long overdue IMHO) as XRPBTC has been looming around trading sideways since the middle of last quarter.
Peace & Love all
@A1mtarabichi

XRP Current situation The bulls are finding it difficult to propel XRP above the 50-day SMA ($0.20). This indicates that the bears are unwilling to throw within the towel with out a fight. However, if the bulls can guard the guide on the 20-day EMA ($0.18), it'll signal demand at decrease stages.
If the XRP/USD pair breaks above $0.216, a rally to $0.25 is possible. The shifting averages are at the verge of a bullish crossover, which is likewise a wonderful sign.
Contrary to our assumption, if the pair turns down from the modern levels and dips below $0.16, it'll sign weakness. Therefore, the long positions can be included with a forestall loss of $0.155.

Ripple Price Stable At $0.15: Breakdown To $0.12 Still Possible?
Ripple price rejection from $0.1750 breaks triangle support, risking a return to $0.12.
XRP/USD hovers at $0.15; upside capped by the 50 SMA and the 38.2% Fibo at $0.1660.
Ripple price staged a formidable recovery last week from lows under $0.15 to highs at $0.1750. The bullish wave came as a result of Bitcoin (BTC) surge towards $7,000. Note that Ripple price just like most of the altcoins is still strongly correlated to BTC.
Following the rejection from the weekly high, XRP/USD spent the weekend searching for balance. $0.16 failed to stand as a support area although it was a huge resistance zone in last week’s recovery. Losses extended under $0.15 before support embraced at the 23.6% Fibonacci retracement level between the last drop from $0.25731 to $0.11 forced Ripple price into the ongoing recovery.
XRP/USD is up 1.94% on the day to trade at $0.1511 from $0.1477 (opening value). The immediate upside is capped by the 50 Simple Moving Average (SMA) in the 4-hour range. More resistance is expected at $0.1660 (38.2% Fibo) and $0.20 (61.8% Fibo). On the downside, the 23.6% Fibo is the next formidable support zone.
The retreat from the recent high at $0.1750 extended the bearish action under a symmetrical triangle. The negative impact of the triangle breakout still hovers and risks pushing XRP/USD below the support at $0.14; a move that could result in a breakdown at $0.12. Besides, the rejection of the uptrend confirms the bearish signals from technical indicators such as the MACD and the moving averages (the wide gap between the 50 SMA and the 100 SMA).
Ripple Key Levels
Spot rate: $0.1511
Relative change: 0.00323
Percentage change: 2.18%
Trend: Bearish
Volatility: Shrinking

XRP/USD - Level 0.12 broke the local bottom 2017 It's important how the day closes.
If it is above 0.15 cents, we can get the continuation of the movement to the resistance level 0.175.
Provided that the levels below are fixed, 0.148 and 0.135 are interesting to buy.
And at this level to decide on the future long.
The fall is finished on the paranormal volume. ( pointed arrow )

XRP BullflagXRP has formed a bullflag, this follows in conjunction with my xrpusd trend reset idea that i made a month or so ago, i will link. Possible upsides include the poo fib EMA possibly could even go higher looks like a pretty agressive bullflag.

XRPUSD still hanging in there after finding bottom at $0.20The last day of the workweek found XRP extending its gains. The major altcoin continued with its good performance and ended the day at $0.245, but not before touching the 61.80 Fibonacci level at $0.246 during intraday.
The weekend of March 7-8 started with a rejection around the above-mentioned level. The XRP/USD pair dropped down to $0.235 and erased 4 percent of its value.
On Sunday, it jumped off a cliff and fell all the way down to $0.203 loosing the stunning 14 percent in a single session. The "ripple" moved below the mid-term trendline and the 100-day EMA but managed to find its bottom at $0.20 in the morning session on Monday, March 9. It is currently trading at $0.204 at noon in Europe.
Downwards, I see $0.20 as a stable support for the moment and unless something really big happens in terms of fundamental news in the coming days, I do not expect any more double-digit catastrophes. The strength of this level is even more obvious on the 4h chart.
Still, the next levels down are $0.19 and $0.185 (last visited low from December 2019).
Up, it is $0.22 that we need to re-conquer first.
In terms of trading volumes, they remained stable between $2 -$2.3 billion from Wednesday to Sunday and then started to pick up on Monday reaching $3 billion by midday. Just like BTC, the Relative Strenght Indicator here is close to the oversold area.
