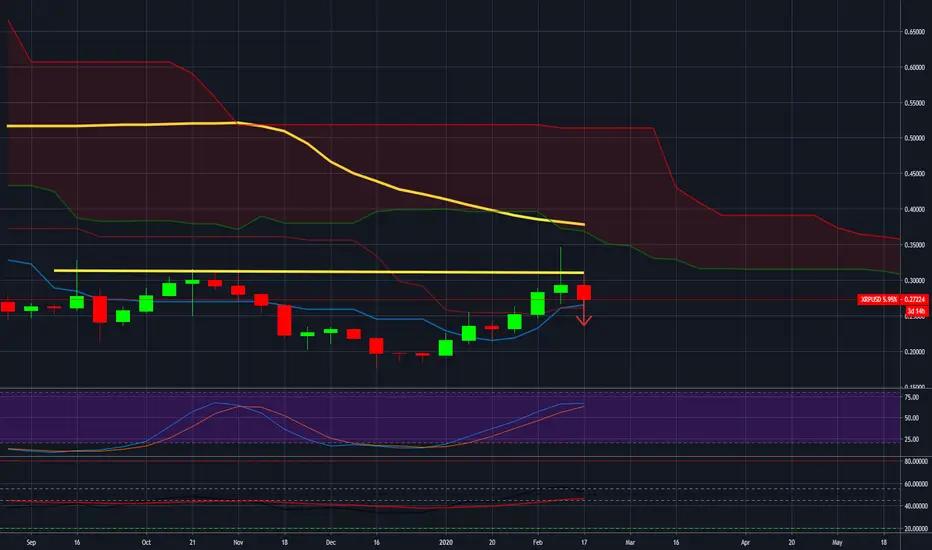
XRPUSD (RIPPLE) SELL UPDATEIF YOU DONT FOLLOW MY ANALYSIS YOU ARE MISSING OUT CHECK MY PREVIOUS XRPUSD ANALYSIS I TAGGED BELLOW TO UNDERSTAND AND SEE WHERE WE ARE COMING FROM
SO WE PLACE A SHORT SELL AND SEE EXPECT A BUY AFTER THIS
FOLLOW ME FOR MORE UPDATE
Rippleforecast

XRPUSD end of week analysis Yesterday the XRP coin found its support in the $0.22-$0.23 area where the the mid-term uptrend line (started on December 18 when we bottomed at $0.172) was meeting the horizontal support. This zone is quite intensive when it comes to trading activity and bulls took advantage of it.
The XRP/USD pair moved up to $0.238 and even peaked at $0.248 during intraday session or right above the Fibb 61.80 line.
The last day of the workweek started with an identical candle on the daily chart, but in the opposite direction. The "ripple" was once again testing the already-mentioned support.
From now, the direction of trading very much depends on the overall state of the crypto market and 24-h volumes (which btw dropped from $3 billion on Wednesday to $2.5 billion today for XRP).
We need to avoid a drop below $0.23 and aim for retaking positions above $0.25 and then $0.265.

XRP - RIPPLE --ADEM AND EVE DOUBLE BOTTOM- ITS MOON TIME FOR XRP MartyBoots here , 13+ years later and I'm still trading the markets
Please give the THUMBS UP to support my work . Thank You
XRP - RIPPLE --ADEM AND EVE DOUBLE BOTTOM- ITS MOON TIME FOR XRP
Do bot miss this , my last XRP alert made 40% profits
Enjoy the video and please Like and follow for future videos

XRPUSD midweek analysisThe Ripple company token is looking quite ugly at the moment. It’s 31 percent down since it peaked at $0.337 on February 14. As of the time of writing, the XRP/USD pair is trading at $0.229, right below the previously stable support line at $0.23. It is of critical importance for bulls to return back into the $0.25-$0.23 zone, otherwise, I fear we might be up for a heavy drop to $0.18 - the lowest point reached since November 17.
Yesterday, we saw the coin breaking below the 50.00 percent Fibonacci level at $0.265, which was successfully repelling the high-pressuring bear traders since February 5. The 50 and 200-day EMAs were also left behind.
My personal feeling is that price will rebound from the area around $0.22-$0.23 as its combining horizontal support with mid-term trendline and it worked quite good as a support zone till now.
In terms of trading volumes, they remained stable in the $2.2 - $2.5 billion zone on Monday and Tuesday, then started to pick up on Wednesday and peaked at $3.2 billion midday.

Is the XRP/USD pair already on its way to recovery ?Is the XRP/USD pair already on its way to recovery or we are in for even more painful days?
We saw the XRP token moving below the 20-day moving average and on Thursday, February 20 it lost more ground by stopping at $0.271. The coin was trading in the $0.261 - $0.281 zone during intraday.
The last day of the workweek came with the formation of a fresh green candle on the daily chart. The “ripple” avoided further decline and moved up to $0.274.
The weekend started with a low volatility session as the XRP is currently hovering around the above-mentioned area during midday trading.
We are still looking at $0.28 and $0.265 as the next major support zones, also corresponding to the Fibonacci 38.20 and 50.00 lines. Surprisingly or not, the "ripple" is finding stability around $0.269 in recent days.
If bulls manage to initiate a reversal and regain position above $0.30 (and then the recent high at $0.335), then the most obvious targets will be $0.37 and $0.40.
Negative scenario: we fall down to the $0.23-$0.25 rectangle (on the chart), which, if broken, will open the door for $0.18.
24-hour trading volumes remained stable in the $3.8 billion zone on Monday then started to decrease on Tuesday and Wednesday reaching the $3 billion mark. We registered another peak to $3.6 billion on Thursday and again a drop to $2.6 billion on Friday.
Please hit a LIKE and follow me to receive all of my ideas.

#XRPUSD#RIPPLE, Back to normal or will we have a surprise?As we will see in the current review, there are some technical issues to continue the ups.
The Ripple failed to rise above the 200 moving average line and instead returned to decline.
The one last candle was closed in the form of a Doji and the candle that came immediately after the Doji is red which is a confirmation for a bear model.
The XRPUSD is still in decline if you look at all the technical data.
A short-term goal: 0.25 (We have not yet fully eulogized)
XRP (XRPUSD) hard drop to sub-$0.28The last day of the workweek for XRP came with a highly volatile session during which the popular altcoin was trading in the $0.339 - $0.310 range, ending the day at $0.336.
The weekend started with a significant price correction on Saturday, February 15. The XRP/USD pair followed BTC and the rest of the top coins and fell all the way down to $0.307, erasing 8.6 percent of its price. On Sunday, it continued to slide. The freefall stopped at $0.292. The "ripple", however, was still 3.5 percent up on a weekly basis.
In the early hours of trading on Monday, February 17 we lost the $0.28 support zone, so I'm looking into the following zones:
Fibb 38.20 - $0.28
Fibb 61.80 - $0.23 - $0.25
I also think we might refer to the 20-day MA for a potential buy point, but I don't like the volumes to be honest for all major pairs.
24-hour trading volumes were stable around $2.2 billion on the first two days of the week then started to increase on Wednesday and $6.5 billion on Friday. During the weekend we saw them moving steadily in the $4-$4.4 zone.

XRP Is Very Close To Hit The Key Level Resistance $0.31Taking Bounce From The Support Of Wedge:
On week chart the Ripple is moving in a falling wedge . The formation of this chart pattern was started in Aug 2018 and now after Aug 2018 the price action has hit the support of this wedge in Dec 2019 and with hitting at support of wedge the priceline has also hit the lower band of Bollinger bands and now it is bounced from the support of wedge at this time it has reached at middle of wedge
The Volume Profile Showing More Bullish Trend Continuation:
I have placed volume profile on complete price action of this wedge that is showing that trader's interest is very low at the support of the wedge and high upto $0.49 we have also POC of this volume profile at $0.31.
Oscillators And Indicators Are Turned Strong Bullish:
Previously on week chart the moving average convergence divergence (MACD) was turning bullish by giving weak bearish signals and relative strength index (RSI) was also oversold and stochastic had given bull cross from oversold zone.
Now the stochastic and RSI are still strong bullish and reached almost half the body of stochastic and RSI if this strong trend will be continued then we can see RSI and stochastic visiting over bought zone soon.
The MACD is now turned strong bullish as we can see the histogram is changed green from red and the moving averages of MACD has also given bull cross.
Directions And Momentum Are Shifted To Bulls From Bears And Bearish Zone Is Finally Chopped:
On week chart in directional movement the +DI and –DI has formed bull cross, the momentum is being shifted from bearish to bullish and soon we can witness the green bar in momentum indicator.
The chop zone was strong bearish since July 2019 and finally it has turned weak bearish, when last time in May 2019 it was turned bullish then the XRP surged more than 73%.
Exponential Moving Averages Are Giving Up Trend Signals:
On 4 day chart after hitting $0.51 in Jun 2019 the exponential moving average 10 crossed down the EMA 20 and formed bear cross since then the candle sticks are being closed below these EMAs once in Nov 2019 the candle sticks were likely to close above the EMA 10 and EMA 20 but at that time we did not receive a bull cross between these two EMAs therefore the attempt to close above these EMAs was unsuccessful and price action again pulled down to $0.17600 that is the lowest price since Jan 2018 up till now.
Now finally we have received a bull cross between EMA 10 and EMA 20 on current 4 day candle stick which is started on 6th Feb 2019 this can be the decision maker priceline coz so far the candle stick is not closed and still continue if it will be closed above these EMAs and we will still have bull cross between EMA 10 and 20 then it will be a proper trend reversal signal indicating towards bullish trend.
An Alligator Opened Mouth A Very Strong Bullish Signal:
On daily chart If we see the movement of simple moving averages with time period of 25, 50, 100 and 200 then 25 SMA has crossed up 50 and 100 SMAs and moving up to cross up 200 SMA now and the 50 SMA is also moving up behind the 25 SMA to cross up the 100 SMA and soon it will cross up the 200 SMA as well and this golden cross can produce a very strong bullish wave because golden cross between 50 simple moving average with 200 SMA is one of the most favorite among the professional traders and it attracts them to buy.
Once we have the order of moving averages from down to top as below:
200 SMA then 100 SMA then 50 SMA and then 25 SMA above all
Then a complete alligator’s mouth will be opened then the most powerful rally can be started.
Like when the alligator’s mouth was opened in Jun 2019 it leaded the price upto $0.51 that was around 80% big move.
Ichimoku Cloud:
Upto 2 day chart the ichimoku cloud is giving bullish signals the Lagging span has crossed up the price action and attempting to cross up the cloud, the price action has also crossed up the cloud and conversion line has formed bull cross with base line after these bullish indications we can expect that the bullish trend with be continued.
Moving Towards Key Level Resistance At $0.31:
Now after hitting the support of falling wedge pattern Ripple has surged 63% and now it is very close to the key level resistance of $0.31.
This resistance is very strong as the price action of XRP has tried three times to breakout this level but failed to do so, the 1st attempt was in Sep 2019, second in Oct 2019 and third attempt has been made on Nov 2019.
A Bullish Trend Continuation Pattern Cup & Handle Is Likely To Be Formed:
This time we can expect the breakout from this key level resistance of $0.31 because on day chart a Cup & Handle pattern is likely to be formed.
The wave down and wave up are moved very softly without any hard corners or V shape and forming a proper round shaped body of cup and this is a fact as much the shape of cup will be round shaped as much the pattern will be confirmed now there are strong chances of pull back after hitting the resistance at $0.31 and this pull back will form the handle of this cup then we can see a down channel formation or pennant or bull flag but this pull back can be a temporary bear move coz finally the price action takes bullish divergence from the handle and this bullish divergence always leads the price action to breakout the resistance of cup which is at $0.31.
Conclusion:
This time the Ripple is moving with Bitcoin which is positive on the contrary previous trend of Jun 2019 when the BTC was moving up and Ripple was moving down. There is a pullback expected before any breakout but we shouldn’t be worried coz all indicators are in favor of bullish trend rather than bearish trend. Overall green trend will be continued.
Regards,
Atif Akbar (moon333)

Ripple: Buying Trade Setup.Ripple: Buying Trade Setup.
Note: This is only for Educational purposes; this is not investment advice.

Ripple may be on the foot of the breakoutRipple forming head & shoulders patter. Volume is right neckline is descending. We wait for the formation of right shoulder to confirm reversal.

Ripple XRPUSD Looking for consolidation in the $0.25 -$0.26 areaOn Thursday, January 30, the popular altcoin formed another green candle and moved up to $0.243 pushing price 3.8 percent higher.
The last day of the workweek once again proofed that neither bulls nor bears were strong enough to take over control of the situation. The coin fell down to $0.238 after trading as low as $0.233 during intraday.
The XRP closed the month of January with an increase of 25 percent.
The weekend of February 1-2 started positively as the “ripple” moved up to $0.24. On Sunday, February 2 it smashed through the $0.25 support line and peaked at $0.262, just to close the week at $0.251.
XRP set a new year-to-date high - $0.261
$0.25 to serve as a support while the $0.25-0.26 will be important for the mid-term consolidation
Trading volumes were stable around $2 billion for the whole week, then peaked to $2.8 billion on Sunday, February 03.
For more details, check my previous ideas (I publish every two days) and subscribe, so you can follow my updates.

XRP is on time correlates to 2017 patternsLooking at the current patterns, it does have a correlation pattern with 2017, it looks like there is still one last dip on the (daily) XRPUSD Poloniex chart.
Also, looking at the daily Stoch's momentum, it's possible we might see a minor dip back down near the 21's cents on the daily before it takes off.
My previous post was on the (weekly) patterns & indicators analysis. To re-cap; the weekly still have a strong potential strength and momentum (stoch and RSI) to go up.
I wouldn't be surprised if XRP jumps Feb~Apr 2020 during tax season and history repeats itself.
disclaimer: This is not a financial advice. This is my opinion that's reflected from the chart patterns and indicators.
Control your money responsively at your own will.

#XRPUSD#RIPPLE, A good time to buy?The Ripple has not really been following the rise of Bitcoin which means there is still potential for increase.
You can see that the XRP / USD broke the average moving line 200 but still not far enough away from the dangerous area.
The candles are placed above the Ichimoku cloud and in addition, a positive green cloud accompanies us on the daily graph.
Target: $ 0.26

Ripple's XRP returns to the support zoneThe weekend of January 25-26 started with another drop on Saturday for the "ripple". The XRP token fell down to $0.218 in its fourth straight losing session.
On Sunday, January 26 the coin skyrocketed to $0.23 in one of its best sessions for the last two weeks. It successfully rebounded from the $0.215 support line and returned to the $0.23 -$0.25 zone, which we already marked as critical for the mid-term recovery more than once.
The XRP/USD pair stabilized around the mentioned level and experienced no significant changes in price during the trading day on Monday, January 27.
If XRP buyers manage to push the price back into the uptrend channel and consolidate successfully above $0.25, then $0.30 is at play. Otherwise, they risk losing momentum and falling back to the $0.215 -$0.23 zone.
The $0.23 to serve as support as already discussed.
XRP bulls will have to move back into the uptrend channel and confirm their position above $0.25 to be in a position to attack $0.30
We are still below the 100-day EMA
Trading volumes are steadily increasing since last week when they were mainly seen in the $1.5 - $1.7 billion zone. We registered a 25 percent increase from Sunday, January 26 to Tuesday, January 28 or up to $2 billion.
For more details, check my previous ideas (I publish every two days) and subscribe, so you can follow my updates.

Ripple (XRPUSD) still to consolidate in the $0.23 -$0.25 zoneOn Thursday, January 16, the XRP token fell further to $0.228 after touching $0.221 during intraday.
The last day of the workweek came with a quick rebound for bulls as the “ripple” regained its positions above $0.23. It moved 4.3 percent up and stopped at $0.239.
The weekend of January 18-19 started positively on Saturday. The XRP peaked at $0.254 before closing at $0.242 later in the day.
On Sunday, it managed to peak above $0.25 for the first time since November 2019, still, it the coin closed the day with a loss to $0.235.
XRP to stabilize in the $0.23-$0.25 zone in order to prepare for an attack of $0.30. It peaked above $0.25 on both January 18 and January 19 trading sessions, still, without being able to hold that level
XRP moved below the slow 100-day EMA on Saturday, January 18.
Trading volumes more than doubled from $1.4 billion to $3 billion from Monday to Wednesday, then stabilized in the $2.3 - $2.2 zone for the rest of the week.

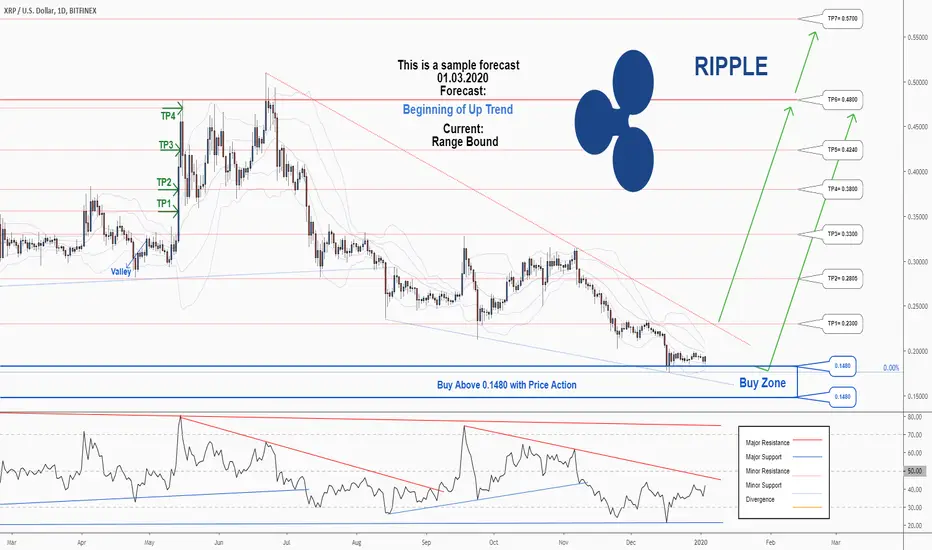
There is a possibility for the beginning of an uptrend in XRPUSDTechnical analysis:
. Ripple/Dollar is in a range bound and the beginning of uptrend is expected.
. The price is below the 21-Day WEMA which acts as a dynamic resistance.
. The RSI is at 42.
Trading suggestion:
. There is a possibility of temporary retracement to suggested support zone (0.18300 to 0.148). if so, traders can set orders based on Price Action and expect to reach short-term targets.
Beginning of entry zone (0.183)
Ending of entry zone (0.148)
Entry signal:
Signal to enter the market occurs when the price comes to " Buy zone " then forms one of the reversal patterns, whether " Bullish Engulfing ", " Hammer " or " Valley " in other words, NO entry signal when the price comes to the zone BUT after any of reversal patterns is formed in the zone. To learn more about " Entry signal " and the special version of our " Price Action " strategy FOLLOW our lessons :
Take Profits:
TP1= @ 0.2300
TP2= @ 0.2805
TP3= @ 0.3300
TP4= @ 0.3800
TP5= @ 0.4240
TP6= @ 0.4800
TP7= @ 0.5700
TP8= @ 0.7615
TP9= @ 0.9145
TP10= @ 1.37050
TP11= Free
Ripple (XRP/USD) analysis, December 30The Ripple company token XRP moved up to $0.197 on Sunday, December 22 and ended the week 8.7 percent lower compared to the previous trading period.
It opened the new trading session on Monday with a heavy loss, which resulted in a 4 percent decline to $0.189. The cryptocurrency was not able to break above the downtrend channel by escaping the $0.20 -$0.19 trading range.
On Tuesday, December 24 it managed to avoid further losses and found support at $0.19 closing with a small gain to $0.1904 after peaking at $0.194 during intraday.
The mid-week session on Christmas saw low-volatility in the crypto market. The XRP/USD pair dropped to $0.188.
The move was followed by a green session on Thursday, December 26, during which the “ripple” once again reached $0.194 and erased the losses from the previous day by closing at $0.189.The current target for bulls was to restore positions in the already-mentioned zone and prepare for an attack of the levels around $0.217-$0.218.
The popular altcoin resumed its good performance on Friday and successfully climbed up to the lower end of the support area.The weekend of December 28-29 started with the formation of a third consecutive green candle on the daily chart. The XRP/USD pair moved to $0.192 on Saturday after breaking the downtrend channel for the first time since December 9.
On the last day of the week climbed up to $0.196 ending the week flat.
The XRP/USD broke the downtrend on December 28. The move started on December 9, so the break is a good sign.
The "ripple" successfully returned to the $0.19-$0.20 support zone and will be looking to confirm the uptrend there. The next level will be $0.217-$0.218

RIPPLE is Below Key level, Where to SELL???...RIPPLE Sell
The Price is in a Downtrend and Below a Key level, the price is rejected many times from the level, If price show another rejection of the level, look for Sell opportunity..
For Entry:
Wait for the formation of Bearish Candlestick Pattern to close on 1hr timeframe...
Push LIKE & SUPPORT the Idea....

RIPPLE is near SELL Zone, Sell trade opportunityRIPPLE Sell
For Entry:
Wait for the small correction or retest of the support turn resistance level and Wait for a Bearish Signal for confirmation..
Push Like & Support the Idea...

Ripple XRP analysis 23.12.2019On Thursday, December 19, we could not see a continuation of the good performance by the XRP and the coin once again corrected its price, this time to $0.187.
The last day of the workweek brought another positive session for buyers as neither they nor bears were able to establish a trend. The XRP/USD pair closed at $0.194, right in the middle of the $0.20 -$0.19 support zone.
The weekend of December 21-22 started with a small correction to $0.192 on Saturday, which was followed by a winning session on Sunday. The XRP moved up to $0.197 and ended the week 8.7 percent lowered compared to the previous trading period.
The XRP/USD pair initiated a reversal after touching $0.174.
The "ripple" successfully returned to the $0.19-$0.20 support zone and will be looking to confirm the uptrend there. The next level will be $0.217-$0.218

Ripple (XRP) analysis 16.12.2019The trading session on Thursday was quite volatile and the coin was moving in the wide range between $0.223 and $0.213. It finally stopped at the previously mentioned support of $0.218.
Sellers made another attempt to break towards $0.214 on Friday, December 13 but without success. The XRP token ended the workweek with a green candle to $0.22.
The weekend of December 14-15, however, had a bad start for bulls as the popular altcoin could not extend gains and dropped to $0.215 instead, losing 2.3 percent of its value.
It rebounded from the lower end of the support corridor (or $0.214) on Sunday, December 15 and climbed up to $0.216.
Looking at $0.214 as the current support and it looks ok for the time being. Still, the general crypto market trend will play a role. If broken, we will go towards $0.20

Ripple makes a new low. Will we see a rebound?Ripple is falling back in the red territory and XRP made a new lifetime low of $0.19638, which is a bearish sign. The straight fall from $0.31519 has plunged the RSI into deeply oversold territory. The crypto asset’s value has been gravitating on a daily chart within a descending channel since June. The channel has been tested severally on both sides. Additionally, the price is trading below the 50-day and 100-day moving averages on H4 chart.
Ripple price recovery will not come easy as long as the RSI stays close to or below 30 (on daily chart). The gradual slope of the RSI hints that the path of the least hurdles is to the south. But at the same time, this could indicates that the selling pressure has been overdone and a relief rally is likely. But to be on the safe side, Ripple must correct above $0.23 and focus of levels above $0.25. 0.2500 area is a psychological key resistance and was used three times recently. If the daily candle closes anywhere near or above it then the bulls could get excited and to continue towards $0.30.
Failure to move back through to $0.22 levels could see Ripple’s XRP fall for a 3rd consecutive day. A fall back through the morning low $0.2135 would bring the first major support level at $0.2050 into play.
Barring a crypto meltdown, however, Ripple’s XRP should continue to steer clear of sub-$0.20 levels.

Ripple (XRP) analysisThe XRP/USD pair peaked at $0.232 on December 8, but could not confirm its position in the middle of the $0.23-$0.235 zone. The "ripple" was rejected around $0.231 on December 9, which led to a break below the short-term uptrend channel.
Looking at $0.218 as next point of support before $0.214 - a level that triggered the last upward movement
