RIPPLE XRP VIDEO - Time to short?Further to our previous idea, here is the video with more explanation as well as what happened the last time the price hit this level
Rippleusd

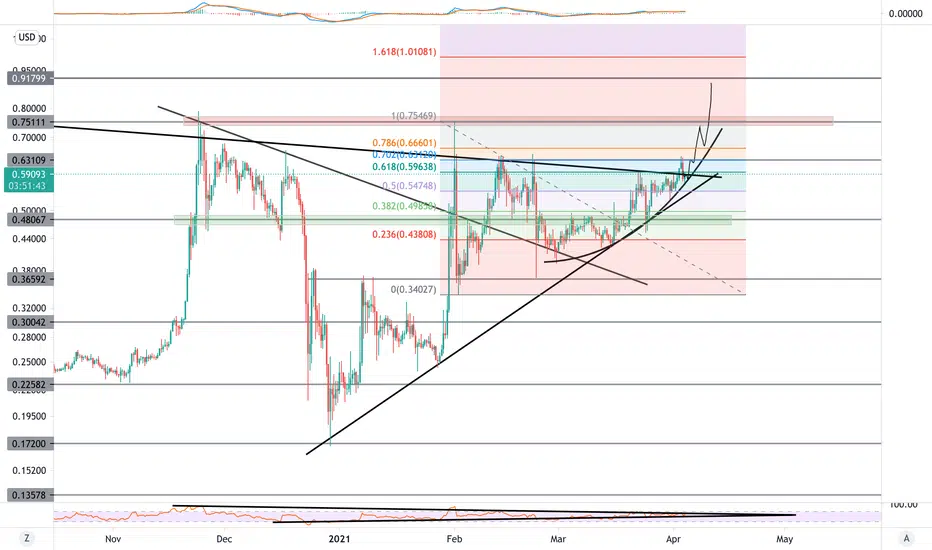
RIPPLE - At the biggest resistanceOur chart shows that Ripple is at all time trend line resistance. Most likely will be a hard level to break but IF it manages to break over it we could expect a new flight now.
A video will follow with further analysis

XRP on growing now!!! tp is 1.69$!!!wow!By price action, it seems tp is 1.69$ or fibo 50%.
enjoy profit and good luck.

XRP demolishing the 6 month resistance?We got this long disputed crypto and its upcoming juridical courts which i personally am optimistic to the outcome.
alright, as you see the candles are rising slowly making foothold at each step, despite the usual spike moves. it says i am going to break the resistance! not gonna demonstrate long-term big targets but i expect this pattern to happen before 2022 or early 2022 ... the final target could be 4.3$ with spikes to 5.2$ . i dont believe in assuming stoploss for cryptos but anyway it can be 0.478 for some investors.
2.7-3.3$ is a bit rough resistance zone but it'll kneel.
depending on court results , this can happen sharply or slowly, and again the targets may be updated after reaching the current ones.
btw watchout for confirmation of breaking out from top channel. or we wanna fix upon 0.7$

Break Resistance Like XRP Hi, I updated you yesterday about the backtest of both trendline and the support level that we have done. I told you we are going to break the resistance $0.635-0.64 and we have done that too. We are now on our way to the multiple years resistance $0.75-0.78. We have not reached there yet, but I expect if we get rejected from the resistance $0.75, then we are going to see a pullback to backtest the support level $0.64. The RSI is already above 70 and that tells us we have a bullish structure, but we have also resistance in RSI around 76. I have good news too ;) For the first time in 2.5 years we closed a weekly candle above $0.625. If we break the resistance $0.75 then we are ready for $1 ;) So be prepared and don't PANIC.

XRP / USD - ARE YOUR SPACESUITS READY? - CryptoManiac101XRP / USD TA
We are looking at a classic ascending triangular pattern which 70% of the time results in a bullish push, which in this case would take us over $1.00

XRP Weekly Cup and HandleThe Gaussian Channel has turned green!
I expect ripple to perform this bull run
I am holding Ripple
Lets break this channel!

Ripple (XRP) about to blow your bubbles :)))XRP preparing for new all time highs.... From Monday, i hope to see a breakout of the retest zone on my ripple analysis. Here's my technical analytical idea. Let me know what you think about it.

XRP - Backtest doneHi, I updated you yesterday about a pullback in XRP. I mentioned that if we get rejected from the resistance $0.635-0.64, then we are going to backtest both the trendline and the support level $0.565-0.575 and we have DONE it. So now I expect that we are going to break the resistance $0.635-0.64 once for all and after that we are ready for $0.75-0.78. So be prepared and don't PANIC ;)
XRP - We Broke The Trendline Hi, this is my new update for XRP. I updated you yesterday about this beautiful triangle and we got a breakout both in RSI and the chart couple hours ago. We have now tested the resistance $0.63-0.64 and we got rejected. I think now we are going to backtest the trendline and the support level $0.565-0.575 to check if it holds or not. Once we backtest the trendline, then we are ready to takeoff and we are going to break the resistance $0.63-0.64 and after that we are going to test the resistance $0.75-0.78. So be patient and don't PANIC ;)

[35%] XRP / USDTAnalysis :
- Above the Kumo, Tenkan, Kijun
- Above the last resistance : 0.566$
- EMA 50 / 100 strong support
- Target : 0.6$, 0.65$, 0.74$, 0.78$

XRP - Waiting For The Biggest Breakout In The History Hi, I updated you 2-3 days ago about this beautiful triangle. It is getting very tight here and I think we are going to see a breakout from this triangle in the next hours or days. We see also a triangle in the RSI chart, so once we get a breakout then we are ready to takeoff. In the last week the SMA50 has been tested multiple times and that showed us we have good support between $0.47-0.55. The next resistances are $0.63-0.64 and $0.75-0.78. So be prepared and don't PANIC ;)

Cardano in 2021 vs Ripple in 2017Yet another long term chart.
Heres why I think ADA in this bull market can be what XRP was in the last cycle:
1. ADA IS , like XRP WAS, a top 5 coin
2. ADA has a lot of believers and a lot of haters. XRP was probably the most hated coin in 2017.
3. People who hate ADA are convinced it is useless (similar to XRP). Now XRP has been proved to be useless. With ADA, we don’t know.
4. XRP has seen two mega cycles, ADA has seen one.
A comparison of price action over the long time period shows ADA’s bull target should be somewhere between 7-15 USD. If you think this valuation is ridiculous, guess what? Back when ripple was worth 3 cents, a forecasted value of 30 cents was deemed to be ridiculous. XRP eventually went close to 3.4 USD.
Now you might argue that using that logic, ADA could do a 100x to 100 USD: That is highly unlikely because of the market maturing as a whole. Also there are a lot more alts that will suck liquidity.
I will not be shocked if ADA goes to 6-7 USD this year, comparing XRP’s performance in 2017, this is a conservative estimate. 15 USD is also possible. Both these levels were obtained by comparing fib levels between ADA and XRP.
Good luck!

XRP ATH IS COMING THIS SUMMER - GOLDEN CROSS - CryptoManiac101XRP / USD TA
We are on a cusp of a major bull run which will affect XRP the most this season. The only asset 'lagging' behind is about to explode!

XRP - Bullrun Starts Next WeekHi, right now we are in a beautiful triangle and in the next couple of days we are going to see a breakout and I hope it is going to be above $0,60. Last week we backtested the BIG support level $0.47-0.48 and it held very well. Once we get big news like exchanges relisting XRP, then we know it is time for big breakout. The next resistances for XRP are $0,65 and the big one $0,75. So be prepared and don't PANIC ;)

$$$ XRP $$$ Hi Guys ! With this breaking news of SEC defeated in a attempt to block #xrp HOLDERS ' Motion to intervene Judge Torres Approves Motion !
Possibly Taking off #Xrp soon to bullish mode if it breaks $0.64 mark and would be hard to figure out where it going to land next !
Cheers
Happy Trading !!!

XRP - THE ROCKET RIDE YOU'LL WANT TO WEAR YOUR SPACESUIT FORXRP / USD TA
Bullish head and shoulders within a bull pennant is one of a kind moments you won't want to miss out on.

XRP/USD personal technical analysisi think it will go over one of three lines that and in daily time frame exit from triangle from up

XRP BULLISH LONG 20X BTCAfter the XRP case is concluded well, the stock exchanges that delist XRP will open XRP to buy and sell options.
While BTC is $ 20K, XRP at the level of $ 3 should be a minimum of $ 6.
After the next altcoin rally and the result of the lawsuit, I expect 20x return in dollar terms.

XRP bullish comeback meets acute resistance, delaying recovery
Ripple faces resistance at the descending trendline and $0.6.
Declines may come into the picture if the 50 SMA support in the 4-hour chart breaks.
Ripple struggles to hold above the short-term support at $0.55 following a failed attempt to touch $0.6. A descending trendline has capped the immediate upside on the 4-hour chart. XRP is doddering at $0.56 at the time of writing.
The bearish momentum appears to be building while declines beckon toward $0.5. Note that the 50 Simple Moving Average (SMA) is in line to offer support and prevent losses eyeing $0.5 and $0.45, respectively.
In the meantime, the Moving Average Convergence Divergence (MACD) shows a consolidation move could take precedence in the near term. The MACD is horizontal within the positive region, hence the bullish inclination. Ripple will remain in the no-trade zone if technical levels remain unchanged.
On the upside, a break above the descending trendline would see bulls shift the focus to $0.6. Similarly, the price action above this level could be massive due to speculation bound to rise. Recently, XRP tested the seller congestion at $0.65, which, if broken, may elevate the cross-border token toward $0.75.
On the downside, losses will extend to the support highlighted by the 100 SMA at $0.5 but may stretch to $0.45. It is essential to wait for a confirmed breakout or breakout before increase or decreasing your XRP position. In other words, trades must be aware of the ongoing sideways trading.
Ripple intraday levels
Spot rate: $0.56
Trend: Sideways trading
Volatility: Low
Support: 50 SMA on the 4-hour chart, $0.5 and $0.45
Resistance: $0.6 and $0.65

Ripple where to buy ?Good morning people 👍
𝙒𝙤𝙪𝙡𝙙 𝙮𝙤𝙪 𝙡𝙞𝙠𝙚 𝙩𝙤 𝙠𝙣𝙤𝙬 𝙖𝙩 𝙬𝙝𝙖𝙩 𝙥𝙤𝙞𝙣𝙩 𝙩𝙤 𝙗𝙪𝙮 $XRP ?🤑🤑
I teach you easily with a graph , the only thing you have to memorize are the 4 areas drawn with 🟢Green / 🟡Yellow / 🔴Red /⚫Black.
🟩Best entry : 0.18 USD
🟨A good entry : 0.33 USD
🟥Risky entry : 0.59 USD
⬛Danger zone : 0.14 USD
PD : Black zone is dangerous if the price crossdown this level, it could go down much more. $BTC $ETHEREUM $LTC $ADA $XRP $BNB $XLM $MIOTA
PD2 : "Risky Entry" means that it is a more dangerous entry compared to the other 2 colors. But it is a valid entry anyway.
PD3 : Leave me in the comments, what do you want to analyze next. (any crypto/stock/indices )
𝙄𝙛 𝙮𝙤𝙪 𝙡𝙞𝙠𝙚𝙙 𝙞𝙩 𝙤𝙧 𝙞𝙩 𝙝𝙖𝙨 𝙗𝙚𝙚𝙣 𝙝𝙚𝙡𝙥𝙛𝙪𝙡, 𝙮𝙤𝙪 𝙘𝙤𝙪𝙡𝙙 𝙨𝙝𝙖𝙧𝙚 𝙩𝙝𝙚 𝙥𝙤𝙨𝙩 / 𝙘𝙤𝙢𝙢𝙚𝙣𝙩 / 𝙡𝙞𝙠𝙚.
The post would have more visibility so that more people can see it.✅
Check my profile @vbirnoschi

XRP explodes toward $0.6, leading crypto market recovery
Ripple heads back to $0.6 upon finding support at $0.4.
The resistance at $0.54 must come down to validate the upswing to $0.6.
Losses under $0.5 may revisit the support at $0.4 and perhaps extend to $0.35.
Ripple and THETA are the best performing cryptocurrencies in the top ten list. As discussed, THETA has rallied more than 32% in the last 24 hours but seems to have hit a wall at $14. On the other hand, XRP is up nearly 12% to exchange hands at $0.53.
The recovery commenced in the wake of the mid-week losses from highs around $0.6 to the support at $0.4. Price action above the 200 Simple Moving Average (SMA) and the 100 SMA on the 4-hour chart confirmed to the investors that the path least resistance path is north.
Consequently, the bullish grip strengthened when XRP stepped above the 50 SMA on the same 4-hour chart. A real break past $0.5 has opened the door for gains targeting $0.6.
Meanwhile, the Moving Average Convergence Divergence has a bullish impulse. It also about to present a call to buy the dip as speculation mounts for the cross-border cryptocurrency to lift above $0.6.
Massive gains are expected to come into play when the MACD line (blue) crosses above the signal line. Besides, bulls will have cemented their presence in the market if the indicator enters the positive region.
Ripple has stepped above the 61.8% Fibonacci level resistance. However, the token is not out of the woods until higher support is established, preferably above $0.54.
On the flip side, the former resistance between $0.5 and $0.52 must transform into formidable support to prevent losses from extending into the $0.4 range. Note that another dip toward $0.4 could pave the way for losses as far as $0.35 and $0.3, respectively.
Ripple intraday levels
Spot rate: $0.53
Trend: Bullish
Volatility: Low
Key support: $0.5 - $0.52
Key resistance: $0.54 and $0.6

XRP JUST CONFIRMED BULLISH TREND ON 1D TMFA new Bullish Trend, the price failed to trade under the green line/MA. That's the fastest MA which mostly defines trends in short terms. However, on a 1D Timeframe, the fastest MA means a lot as it helps to analyze the behaviors of the trend and the market.
