XRP/USDT: Hidden Bullish Divergence Analysis 4H (Aug. 08)X Force Global Analysis:
If you find our analyses to be helpful, make sure to support us by dropping a ‘like’
In this post, we analyze XRP's hourly chart, assessing its probable bullish and bearish scenarios for the short term.
Analysis
- To begin with, XRP has been consolidating within a bullish pennant pattern
- Prices have been creating lower highs and higher lows
- While bears have attempted to break the structure, bulls have managed to secure significant trend line support
- There is a hidden bullish divergence in play, with higher lows on the price, and lower lows on the indicator
- The Relative Strength Index (RSI) is at neutral zones, showing potentiality for a breakout
- The Moving Average Convergence Divergence (MACD) has shown increasing bearish histograms, but seems to lack momentum for a golden cross formation
- The Stochastic Oscillator has recently formed a golden cross at neutral levels as well, but is looking to get negated as there is a lack of momentum in the trend.
- The Simple Moving Averages (SMAs) are all aligned in the order of: 20, 50, and 100 SMA
- Prices have tested the lower bollinger band support
- Prices have managed to bounce on the Ichimoku cloud support
- For XRP to retest its new lower high, it must first break and close above the 0.618 Fibonacci resistance, providing confirmation
What We Believe
We believe that XRP's short term technicals demonstrate potentiality for a small breakout, possibly leading to a formation of a new lower high. However, for for further continuation, XRP would have to break and close above the bullish pennant structure.
Let us know what you think in the comment section below
Trade Safe.
Rippleusdt

Ripple Bearish Bat Possibility ??Bearish Bat >> It is not an Investment Advice. It is for Tracking Purposes
Good Luck :))

XRP 3 Wave?Gonna be looking at this as a maybe a 3 Wave. looks like a ABC took place. support hold and off to the next high

XRP/USD ready to 0.10$Hello Trader,
On this quick analyses for XRP charts, we can see that we are inside a long-term downtrend channel, and we failed to broke above the key level, so we can be heading up to test the support of this channel, but for now the primal trend still bearish, so be careful with long positions.
Please press the like button and follow us on the trading view.

When will the scallop/rounded bottom end? XRPXRP Idea
I feel the demand for XRP is high even though price action is low
just my opinion though
Included some key levels

Ripple Got a Mean Curve. 🤣 (XRP)🤷♂️ Don't need to say much. If rejection holds here, then it will drop hard!
Overrated coin with an overrated market cap.
🚮🗑🚮🗑🚮🗑
🥇MLT | MAJOR LEAGUE TRADER

XRPUSD has broken down the channelHi friends hope you are doing well and welcome to the new update on Ripple. Today we will have the detailed technical analysis on XRP with USD pair and at the end of this article I would like to show you a very big bullish harmonic pattern that the XRP has formed with Bitcoin pair.
Up channel , moon phases and EMAs:
Since after the strong there is rally of March 2020 the price action of XRP has started the formation of an up channel. Even though the Ripple is not showing as that much bullish move like the other top altcoins are showing, but it was moving within this channel above the exponential moving averages EMA 10 and 20 very well. After 11th May the price action broke down the exponential moving averages then we can see a bear cross between the exponential moving averages and finally the price action also broke down the channel.
I've also placed the moon phase indicator on this chart. On the up side you can watch the full moon and on the downside you can see the dark moon. The distance between one moon to another moon is called synodic cycle and that is 29.5 days long. The recent full moon was appeared below the previous full moon and it was below the resistance of the channel. And the most recent dark moon was appeared below the previous dark moon and that was at very big distance below the support of the channel. That was very clear indication that the price action may move down up to the next recent dark moon and finally the price action followed the signals of moon phases indicator and at this time after breaking down the channel support it is moving down towards the dark moon.
RSI and Stochastic pulled the price action down:
On the same daily chart if we watch the movement of the price action then it was almost sideways but if we watch the relative strength index (RSI) then it was completely in downtrend since April 29 2020. On 3rd June the Stochastic oscillator also gave bear cross from the oversold zone that was another bearish signal. And now finally the price action has followed the signals and broke down the channel’s support:
Simple moving averages support is likely to be broken down:
On below chart I have placed simple moving averages with the time period of 25 50 100 and 200. After the bullish rally that was started in the mid of March 2020 the price action could not break out the 200 simple moving average even after making several attempts. Finally the price action moved down and broke down 50 and 25 simple moving averages. At this time the priceline of XRP is at the 100 simple moving average support. If it will be broken down then we will see a further downside rally.
Formation of down channel:
Now after breaking down the support of up channel the price action of Ripple has formed a down channel. Therefore the price action needs to break out this down channel as soon as possible otherwise if it will be moving in this channel for the long time then this channel will lead the price action towards very low price.
Head & Shoulder pattern:
On the other side on the same daily chart we can watch the Head and Shoulder pattern formation with the continuation. First pattern was completed in the middle of March and after that the second Head and Shoulder pattern was started. And now it has been completed. Even though if the price action has reached the neckline of the Head & Shoulder pattern then the pattern is completed, however there is still possibility that the price action may move more down like It did in the previous pattern.
Long term support and resistance levels:
If we observe the long-term support and resistance levels on the weekly chart then we have a very strong support at $0.175. And this support is never broken down since 2017.
On the upside we have a very strong resistance level at $0.31. This level has been working sometime as support and sometime as resistance very well since 2017. At this time It is working as very strong resistance as the price action is never able to break out this resistance level since after it was broken down in July 2019. Therefore this resistance is became a very powerful and key level resistance for the priceline. Once it will be broken out then the price action may start a very long term strong bullish rally.
XRP with BTC pair analysis:
Now let's switch to the XRPwith Bitcoin pair and here the price action of Ripple has formed a very positive bullish move as it has completed the formation of a very big bullish butterfly on the long-term weekly chart. At this time the price action is entered in the potential reversal zone of this bullish Butterfly and as per Fibonacci sequence it should be moved up from this level up to the Fibonacci projection between 0.382 to 0.786 level and this is the Fibonacci projection of A to D leg. As per bullish butterfly the buying and sell targets can be as below:
Buy between: 0.00002028 to 0.00001548 sats
Sell between: 0.00002400 to 0.00003300 sats
Conclusion:
Ripple is showing very weak moves with USD pair. Even it is turning more and more bearish. But if we watch its move against the Bitcoin pair then it has formed a very positive bullish harmonic pattern. And from this move we can get a clue that if the price action will turn bullish from the potential reversal zone of this harmonic pattern then definitely it will also turn bullish against the US dollar pair as well.

Will XRP Breakout This Key Level Resistance To Achieve $5Hi friends hope you are doing well and welcome to the new update on Ripple even though this coin is less bullish comparatively to other top cryptocurrencies however it is giving some bullish signals let’s talk about them.
Finally priceline is showing bullish bounce:
On the daily chart the priceline of XRP is moving within an up channel since Mar2020. Recently on 25th May XRP was reached at the support and got bounced from there. Now we can see a sequence of bullish candlesticks is being prepared. Even though these candlesticks are not as that much bullish as they should be after this bounce. However the continuation of green candlesticks is a bullish signal more over we can see that buying volume is being appeared with the continuation that can lead the priceline to the resistance of this channel.
Indicators are turning bullish:
If we notice the different indicators and oscillators on the daily chart then all are turning bullish. For example if we watch the moving average convergence divergence (MACD) then it was strong bearish and now it has turned weak bearish. The stochastic is already strong bullish and the relative strength index RSI was in downtrend since 29th April 2020 and now it is breaking out the down trend line that is a bullish signal. Because sofar the price action was following the trend of RSI. If RSI will be turned bullish then definitely price action will also follow the trend of relative strength index.
SMAs on daily chart:
If we observe the position of the simple moving averages on the daily chart with the time period of 25, 50, 100 and 200 then it can be clearly seen that 50 SMA has moved up and formed golden cross with 100 simple moving average, if it will move further more upwards then it can form another golden cross with 200 simple moving average as well. And that is considered a very strong buying signal among the traders community. That can be a big invitation to many traders to buy XRP. However the 25 simple moving average is likely to move down and can form bear cross with 50 and 100 SMAs. But it doesn't matter because the 25 SMA is already moving sideways with these tow simple moving averages. If 25 SMA would be coming down form some distance then this death cross would produce some bearish rally.
EMAs on daily chart:
The exponential moving averages with the time period of 10 and 21 are very important to determine the bullish or bearish trend of any asset. On the daily chart of Ripple the EMA 10 and 21 are in bear cross since 13th May 2020. And the priceline is moving sideways with these two moving averages. Now the exponential moving average 10 is moving up and at this time it is very close to EMA 21 and the price action is likely to cross up these two EMAs. We need the closing of the candlesticks above these two EMAs as soon as possible in order to breakout the channel’s resistnace.
Falling wedge on long term chart:
Now let's switch to the long-term weekly chart. And here we can notice that the price action of XRP is moving in a falling wedge since August 2018. And so far priceline is not able to break out the resistance of this wedge even after several attempts. In my previous article we have seen that the bollinger bands was below the resistance of the wedge, therefore the Ripple had the bollinger bands hurdle before the wedge’s resistance. That could stop the price action to reach up to the resistance. This time the upper bands of the bollinger bands has moved up above the resistance of the falling wedge and this is a bullish signal for the breakout. Because now it can be easy for the price action to cross up the resistance of the wedge.
Indicators on long term chart:
If we watch the different indicators on the long-term weekly chart then Stochastic has turned strong from the oversold zone. And the relative strength index is moving sideways and the moving average convergence divergence is also strong bullish. As the stochastic in MACD are strong bullish therefore we can expect that RSI will also follow these bullish signals and it will be changed to bullish soon. As visiting the overbought zone after coming out from oversold by the RSI indicator is already due.
Key level resistance at $0.31:
Now I would like to recall a major key level resistance and support level for the priceline of Ripple. And that strong resistance and support level is at $0.31. If we see on the chart then it would be revealed that since the XRP was come to existance this $0.31 level has been working as powerful resistance and support level. First we can see that it has been working as a strong resistance from May 2017 to December 2017. But once this resistance was broken in December 2017 then within one month upto January 2018 price action started very powerful bullish rally that produced more than 1476% gains. And achieved more than $3 price level. Then from January 2018 to August 2019 it has been working as strong support for the priceline. But once in August 2019 this support has been broken down since then priceline could not breakout this resistance again. Therefore we can expect that once this resistance will be broken out then it can repeat the same move of Dec 2017 to Jan 2018 and produce more powerful bullish rally than the rally of 2017 to 2018. And this powerful bullish divergence can lead the XRP to reach $5 price level that will be all time high price. But if the priceline will be moved down from here then we have a strong support of $0.175 and the price action is already moving very close to this support.
Conclusion:
Even though the Ripple is turning bullish on short term and midterm but it is still less bullish comparatively to other top cryptocurrencies. However once the XRP will be able to cross up $0.31 resistance level then it can turn more bullish than other coins.

#XRP/USDT (May 30)XRP is quite good to start accumulating. Buy it close to 0.2$ as possible for 0.3$ or even 0.35$ target
It will drop sharply to 0.15$ if lose the 0.19x$ zone

XRP/USD - sell zone On the day timeframe, the triangle fell from (distribution ) downwards.
I plan to trade from the zone 0.208 - 0.21.
Indicators show the shorts in a better position.
Shorts from confirmation. Stop loss can be hidden by the level. Like I drew on the chart.
At the 4 o'clock timeframe, they're drawing a model from the bounce.
A rebound from the fall, or in other words, a correction.
Indicator AO and RSI show growth
Thanks for your support! Push like if you think this is a useful idea!

#XRP/USDT (May 08)Market : Binance
Buy : 0.213 - 0.215
Sell : 0.225 - 0.235 - 0.245 - 0.26 - 0.28
Stop : 0.1975

Ripple (XRP) Needs This Break Out Then Next Destination Is $5Falling wedge:
The price action of Ripple is moving in a falling wedge pattern since August 2018. Recently after the strong bearish trend in the month of March 2020 the priceline of XRP again has hit at the support of this falling wedge pattern. Here I was waiting for two indicators to give bullish signals. One from stochastic to give bull cross and second for the momentum indicator to turn weak bearish from strong bearish after these two signals I was expecting that the priceline will again move up to make another attempt to break out the resistance of this falling wedge pattern.
Finally on 6th of April the stochastic gave bull cross and on 27th of April the momentum indicator turned weak bearish from strong bearish and then the priceline of Ripple turned bullish and sofar it has reached almost at the half of the wedge pattern.
Here we can observe one more thing that the relative strength index (RSI) indicator 1st went in oversold in January 2020 and in the month of March it went again very close to the oversold zone and now it has turned bullish. And if we see the priceaction of XRP then it can be easily seen that the priceline has also formed a double bottom as well that is another very powerful bullish sign.
Indicators are turning bullish:
falling wedge:
Volume profile and Bollinger bands are giving bearish signals:
If we see the two more signals on this weekly chart then the situation is little bit disappointed. If we see the volume profile of the complete price action moving within the pattern then it can be easily witnessed that the trader’s interest is very weak below $0.17. And if we move up then we find that the interest of the traders is very low above $0.33, this is almost the same level where we have the resistance of the falling wedge pattern. Therefore in order to have a break out from the wedge we need the interest of the traders should be developed above the level of resistance, moreover if we see the Bollinger bands then it can be easily observed that the upper band of Bollinger bands is below the resistance of this falling wedge pattern. Therefore it can play a role of resistance or hurdle for the priceline that can stop the XRP to break out the resistan. Therefore in order to achieve a successful breakout from this pattern we need the Bollinger bands to move above the resistance of Wedge. However if exceptional we will have a powerful buying volume then the Ripple can ignore these signals and breakout the resistance.
Simple moving averages and bearish signal on daily chart:
Now if we switch to the short-term daily chart and place simple moving averages with the time period of 25, 50,100, and 200 then we can see that since 14 March to 29th of April the priceline was moving up with a strong bullish rally and first the price action broke out the 25 SMA after that priceline faced a little bit resistance but finally broke out the 50 simple moving average. And during this the we can also watch the golden cross formation between 25 and 50 simple moving averages. Then on 29th of April the price action of Ripple broke out the 100 SMA but since then the price action is not able to break out the 200 simple moving average. And it is being consolidated between 100 and 200 simple moving averages. And now there is bearish signal appeared and that is on 30th April a powerful bearish engulfing candlestick is appeared that is a bearish signal. This candlestick has completely in engulfed the bullish candlestick of 29th April. Therefore in order to break out the 200 simple moving average we need another powerful bullish engulfing candlestick that should engulf the bearish engulfing candlestick of 30th April or at least it should be equal to this bearish candlestick. Then this bearish candlestick will be cancelled. But unfortunately sofar after that bearish engulfing candlestick we have a two weak bullish candle sticks and and today we can see a weak bearish candlestick as well.
Up channel:
On the same daily chart the priceline of Ripple is moving within an up channel since 17th of March. At this time the price action has reached at the resistance of this channel but could not break out this resistance even after powerful bullish candlesticks with long spikes and now we have few weak bullish candles moving sideways. Here I am watching for two more indicators one is stochastic indicator another one is the momentum indicator.The stochastic indicator has already visited the overbought zone and it has given bear cross. Now if with this bear cross of stochastic indicator the momentum will be turned weak bearish from strong bearish then we can expect that the priceline may re-test the support of this channel and that is at $0.20. I am not expecting as that much powerful bearish move that the priceline would re-test the support of the falling wedge that has been formed on the long term weekly chart. Therefore after retesting the support of this channel the priceline may again move up to make another attempt to break out the resistance of this channel.
Up channel:
Stochastic and momentum:
Key level resistance at $0.31:
Now I would like to discuss a major key level resistance and support level for the priceline of Ripple. And that strong resistance and support level is at $0.31. If we seen on the chat then we can easily observe that since the XRP born this $0.31 has been very powerfull resistance and support level in the history of XRP. First we can see that it has been working as a strong resistance from May 2017 to December 2017. But once this resistance was broken in December 2017 then within one month upto January 2018 price action started very powerful bullish rally that produced more than 1476% gains. And reached more than $3. Then from January 2018 to August 2019 it has been working as a a strong support for the priceline but once in August 2019 this support has been broken down since then priceline could not breakout this resistance again. Therefore we can expect that once this resistance will be broken out then it can repeat the same move of Dec 2017 to Jan 2018 and produce more powerful bullish rally than bullish rally of 2017 to 2018. And this powerful bullish divergence can lead the XRP to reach $5 that will be all time high price.
Conclusion:
On short term the Ripple is giving bearish signals therefore we can expect bearish rally on the daily chart but on the long term the XRP is bullish and once the key level resistance of $0.31 will be broken out then XRP can achieve the all time high price.
Note: This idea is education purpose only and not intended to be investment advice, please seek a duly licensed professional and do you own research before any investment.

XRP Small scythe - HourlyA scythe has formed on the hourly chart for XRP
This is a bullish continuation pattern
here is my idea on the scythe pattern
enjoy and gl

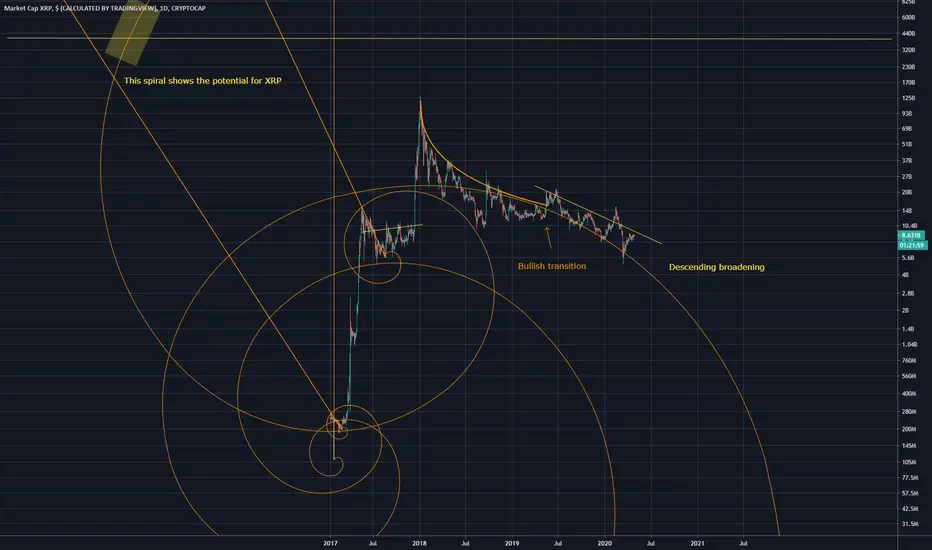
XRP cap spiralsXRP has formed a descending broadening wedge
included spirals showing the possible market cap futures highlighted in yellow rectangle
Mainly made this to show some harmonic patterns, Descending broadening wedge and the ascending wedge
Im long on this project
🖤DID YOU FOLLOW RIPPLE?🖤❤Hi, people!😚 Are U in a good mood, like me?🧐I hope so❤
⚡⚡⚡RIPPLE RIPPLE RIPPLE⚡⚡⚡
A few years ago, ripple was very popular on the market.🖤💣But unfortunately now it mercilessly falls down.😪
☝🏻Recently, its price has reached the price of 2017 year. Will it be even lower?⚠ Maybe...
On the chart,📊 I indicated with a red marker ❤ a possible price drop, but I expect a rebound to the resistance levels - they are marked in green 💚.
Do you keep ripples?🧐 What are your predictions?
Write me about it in the comments✍🏿👇
Subscribe and like me 💪🏿
Your Rocket Bomb 🚀💣

XRP Possible Inverse Cup and Handle? What do you think? Hey Crypto fam,
I was just trying to look at XRPUSD on a 1HR chart, and came across an interesting possible inverse cup and handle that maybe forming.
First, I was like nah its not possible, but then I was like why not just put it out and get some thoughts on it from people who are looking at XRP. With BTC looking a little bearish currently, I feel there is a slight possibility that this can happen.
THIS IS NOT A CONFIRMED CALL, just a viewpoint. It can also break that trend line and make this post invalid, but hey whats the harm in putting it out there right? Worst thing, it won't happen.
It'll be good to know what y'all think and we can have a discussion going :)
Stay home safe and trade safely fellas.


XRPXRPUSD showing positive momentum through a falling wedge, also within a descending broadening wedge which is a bullish reversal pattern. Another falling wedge is present above the one price is currently trading within. Is this simply a big shake? Fractal composite ribbon can be seen to show signs of an inverse H&S (let me know if im using this wrong, I've never used it before, always room to learn). Calling bottoms is difficult prob impossible, and shouldn't be done, but XRP is setting up a very 'hidden' bullish setup with these wedges it has formed. Best to go long like me :)

XRP ANALYSIS: SHORT THE RESISTANCEXRP ANALYSIS:
XRP looks to be forming a rising wedge as it also coming to the hourly resistance block near .16 up to .1650. I am expecting a break down inside the hourly resistance. There may be a short lived pump out of the wedge into the resistance block, followed by a wick back down. Any stop loss should be above previous wick of .1650. Otherwise, look for short opportunities here down to bottom of wedge T1 at .1520. If the wedge does break down, look for T2 at .14687 which lines up properly with 50/100MA cross. RSI has tapped out on the hourly and a downward move looks promising. Last T3 at .1410. Take profit, look for a flip to long inside triple bottom support!

Mega XRP short ideaRipple (XRP) is not a public blockchain, it is a private chain. Therefore, it should not even be trading on CMC.
This year we will see all the Alt(shit) Coins collapse. This is only just the beginning.
We can see a descending trend-line where the price has been rejected 5 times.
Short with responsible leverage as most cryptocurrencies are very manipulated.

XRP ANALYSIS: BUY UNDER $.20!XRP ANALYSIS:
XRP has broken below 200MA and was rejected upon an attempt towards it. This is a clear sign 200MA is now the major resistance band. With that being said, XRP is inching upon the support zone where we have previously seen a major increase in buy volume and bulls step in to play. Any dip below .20 should be bought up quickly. I recommend to stagger bids just below .20 inside the buy zone of .1820-.2000. There will be another attempt at the new resistance line. Given that, the take profit targets are listed as T1 at .2216, T2 at .2320, and T3 at .2425. This would allow XRP so attempt the 200MA again in which we can see if bulls are able to break it!
Possible Entries: .1820-.2000

XRP Moonshot Pt.2$10 is the target for me.. Hopefully will be reached by EOY for longs. As you can see there are two falling wedges - one smaller one within a larger one - this can be seen using this indicator "trend lines" which provides a great outlook of your chart. This is seemingly hidden and ultra bullish. It just will take some time for the wedges to complete. Included possible pathing routes for inside the wedges however this is difficult to determine.

XRP Daily Bullish DivergenceXRP has produced a daily bullish divergence, it is hard to see the lower low on the RSI, but trust me ITS THERE! This is the classic example of a oscillator , price bullish divergence.
