Rise is still in downtrend, has 2 strong FIB supports below itRISE isnt a coin I got in unfortunately at the 4k mark when I heard about it but one i definitely will add as medium-long term hold when the price is right. Its currently in a downtrend since hitting a top around 16k in its current trend and is down to almost half that. It doesnt show any short term bullish signs of breaking that downtrend but does have strong support lines at around 7800 and 5700 at around the FIBS. I think it might hit the first 7800 FIB but dont think itll break, if it does then low 6000s are definitely possible.
This is the 4th elliot wave so it is a expected downturn but I would definitely wait for a break in the downtrend line before I buy and/or put some buy orders around the fib lines. OBV is showing steady volume so that means people are buying it, indicating the first sign of a bullish reversal would be that it starts trading sideways and the bleeding stops.
Short term - bearish
Long term - very bullish hold
RISE

RISE Price MovementsRISE was a great buy for myself at around 0.00007, and I'm looking to reenter again after selling some profits near the top. After its recent run up, RISE's price has retraced back to the 0.000088 level. Currently it's looking like it's in the final wave of a 5 wave elliot wave cycle. If this is correct, I can see it bouncing off the following areas for the listed reasons
~0.000064: Based on basic elliot wave theory/fib retracement, this would be a key spot for it to bounce from. This is supported by a support area based off of 3 points which are; a couple of failed breakouts on September 3, a bounce on the 10th, and a failed breakout and bounce on the 15th. For me this is the most likely outcome
~0.000053: Same reasoning as before, a common bounce area based on elliot wave/fib retracement. Was also the approximate area where the two failed breakouts previously mentioned bounced
~0.000043: In my opinion the least likely outcome. This is based on the previous major successfully breakout

RISEBTC Falling WedgeSo, generally what we observe is falling wedge pattern + upward movement in Stoch RSI indicator. In my opinion we may get 20-50% from this coin in 1 week. Put your buy orders between 94-95 and stop-loss at 90. Good luck )

RISE/BTC RISE's Forecast?Well, I started Hitting targets on old charts so I started making forecasts so I have a playbook for the month(S) to come. I think this is , BITTREX:RISEBTC

RISE, maybe looks like ripple in the spring.In my additional analysis other than this simple view,
It would go up just like ripple in the spring.
RISE seems to draw cup-handle pattern,
maybe not typical, accumulating energy to go up.
Because i love 'trending trade', it would be nice not to close our own spot until it is broken in the daily view.
**news
: plz refer to tags.

RISE Future MovementsRise has started to create a nice little flag pattern for itself, and if we look back at the price history, we can see that it likes to drag out these flag patterns (around a week or so). In saying this, I believe that there could be a possible two likely scenarios in play. The first, is a continuation of that history, and we see the price move in this descending channel until the price hits support, lining up with the 0.5 Fib retracement level. This could potentially cause it to drastically bounce, looking to hit the hidden resistance in line with the ATH. The second scenario, is where we see a more true flag pattern play out, and the price moves upwards as much as the previous movement. For this to occur in line with the hidden resistance, it would break around this time tomorrow. We would then potentially see a retracement and a new flag pattern emerge, causing the price to go up in a staircase like pattern.
I'm currently holding some RISE, but will look to buy some more if it either, breaks upwards from this flag, or bounces from support

RISE about to "RISE"! Next target: Moon! 60-100% profitA clear bullish APEX is forming. This bullish form cannot be more clear. Good luck.
P.S. Same pattern on my previous post turned to be exactly as predicted.

RISEBTC setting up for intraday breakoutRise held up nicely last couple days with good momentum on its daily chart. Intraday on 15minute chart it is setting up for a flat top breakout. You have your moving averages curling up underneath providing it support and once we get past this supply zone overhead we should be able to speed up. I took the BTC pair on bittrex . if your looking at it in USD the .45-46 zone is the breakout spot.

rise ......will it continue to rise ??YES is my answer looking at the bigger picture in relation to Elliot waves and Fibonacci here is my prediction for this coin
possible we gunna see 300 or more
Happy trading


Flag Breakout RISEUSD OR RISEBTCIntraday flag on $riseusd on 15minute flag. I'm using the btc pair. stop goes under base of flag.

$RISEBTC RISE FALLING WEDGE PATTERNPattern speaks for itself. Wait for bullish confirmation before buy orders are placed


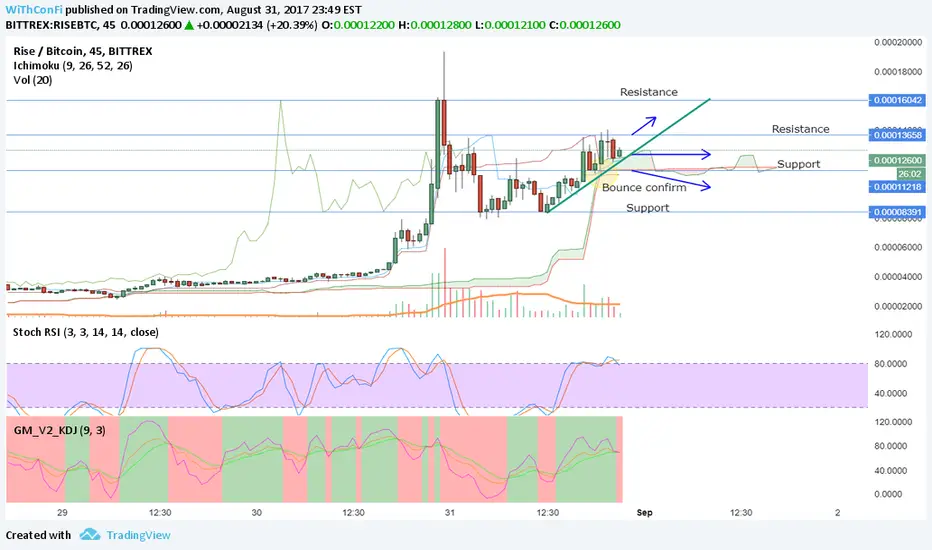
Rise Possible uptrend if it breaks resistance lineRise possible uptrend if it breaks resistance line. Los Angeles 9:47 pm.
Odds are mostly in Neutral or Sell favor but there is always that unpredictable uptrend.
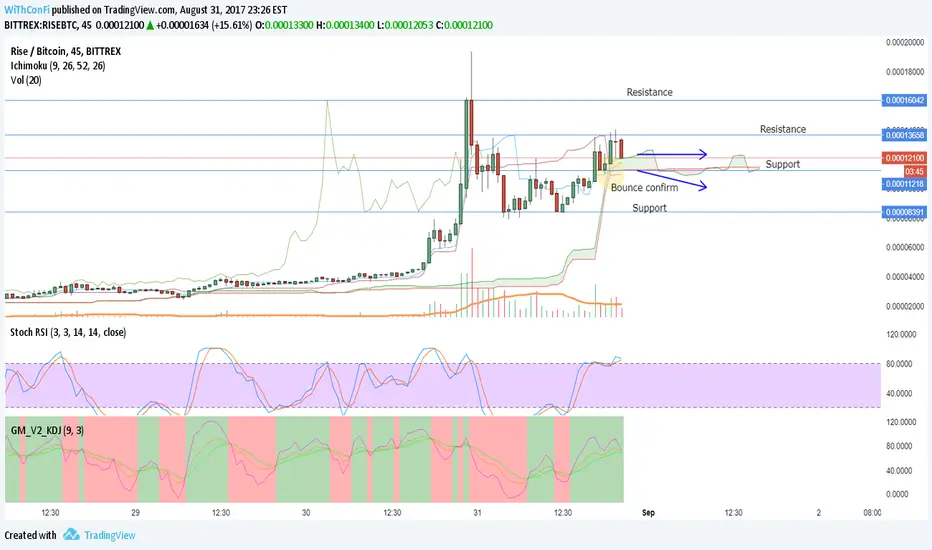
RISE 45 MINTIME FRAME Losing HopeRise 45 MIN time frame. Los Angeles 9:24pm.
Rise is losing momentum and most likely going to enter the cloud kumo and become Neutral.
The candles look bearish 4 reds in a row which can also be a signal to a downtrend. -If price action breaks underneath clouds it means downtrend.
$RISE FORMING HEAD & SHOULDERS,LONG OPPORTUNITY —WAIT TO CONFIRMH&S pattern, showing bullish signs. Consider buying after confirming bullish reversal

2/08/2017 EUR/USD AnalysisBullish tren continuation. "The U.S. dollar hit its lowest level against the euro in more than 2-1/2 years on Wednesday on doubts about another Federal Reserve interest rate increase this year and expectations for European Central Bank hawkishness". www.reuters.com


BTC/USD Profit cloudsHello again, a little research and now i want to tell you one more thing about price incoming. Take a look at the picture below and think, what can happen next.
Lets have a little patience and look at the outcome of all this.
Buy: 2220 for 100% sure
Stop loss: 2070
