RISE - Cup and Handle FormationIn the Crypto space, I believe it's always a great idea to hedge your funds in different altcoins in order to maximise profits. When doing so, it's important to notice the relationship of the altcoins price to Bitcoin's price.
We can see a Cup and Handle formation here. The price is following the blue trend line and looks like we have just bounced off the bottom of the handle. The MACD also confirms that this is a good entry point as the faster moving average crosses above the slower one.
Our initial target is the top of the cup and if it can break above there then we will target the 1.618 Fib line. If Bitcoin breaks $20K then the 1.618 target will be a lot more likely.
Good luck!
RISE

RISE 1D Timeframe 10 December 2017Then we have $RISE, which has retraced big time as well.
As we see on this chart, the RSI has been on the rock bottom since beginning october (with some small jumps, but not breaking 50 --> turning bullish). I'm expecting that RISE is done retracing for now and will make some giant moves within the next few months coming, indicating that we might see altcoin season.
Will update weekly.


6/11/2017 BTC/USD Analysis"Bitcoin received a boost after Friday’s announcement by the main U.S. derivatives regulator that it would allow CME Group Inc and CBOE Global Markets to list bitcoin futures contracts." www.reuters.com

RISE is cooking something> RSI slowly making upward move.
> MACD histogram supports upward move.
> Likely to be a breakout,i guess.

BTCUSD May See Resistance Around 12000BTCUSD is trading in a bullish impulse of a higher degree, labeled as black wave V. We see four of fives bullish waves completed from 11th of November, which indicate that a top can be near. Current rally that is now underway can be final wave 5 of V, that can see limited upside near the upper Elliott wave channel and near the Fibonacci ratios of 2.618 or 1.0 ; all three elements have a common thing, they offer resistance so be aware of a three-wave bearish reversal.
Disclosure: Please be informed that information we provide is NOT a trading recommendation or investment advice. All our work is for educational purposes only.

Rise $RISE, rise! bullish flag: chance for a good tradeAnd to finish with my DPOS coins, I also own RISE, another coin that brings me 20% yearly income, the difference to LSK and ARK is that RISE is still very cheap, currently at around 50 ct, so the entry treshhold is very good.
Since yesterday, RISE started a nice rally, there are good fundamental news coming, roadmap update and airdrop at the yers' end.
In the 4 hour chart, that is a potential bull flag forming, that is a bullish sign, so you can get a good entry at the two levels shown, with a nice potential target and profit.
Enjoy. Thanks, if questions, let me know!

first target achieved, perspectives for trend continuation. Breakout with good volume, first target achieved, perspectives for trend continuation, in new trendline.

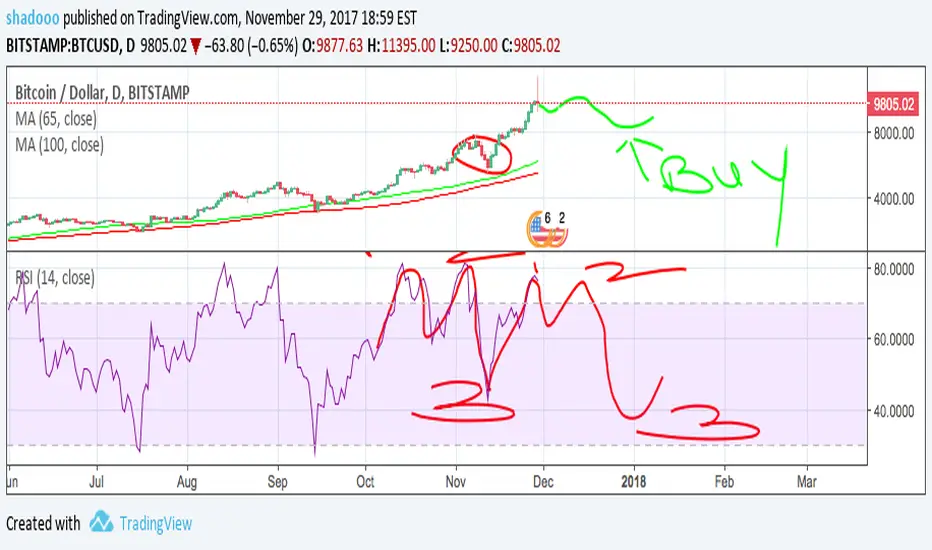
BTC/USD big drop end december: BUY moment! LONG END DECEMBER! I looked at the RSI of previous year around the month november and december. And there is a pattern seen.
Expectations:
- Drop 4-6 days (till 1-2 december)
- Little uptrend (till mid december)
- Big drop end december with a rise begin 2018.
Please notice, this is what I think. I am not responsible for your financial advisory. I hope you can see other analysis and find similarities, this will guarantee you a better decision.
AUDUSD trading In A Three-wave Setback; More Gains Can FollowAUDUSD did not move much recently, so our view remains unchanged; we still see pair making a corrective set-back in wave B which is now trading into some interesting Fib. Support zone with sub-wave c, here at 0.7579 area. We think bounce may occur from here, but keep in mind that wave C leg may occur only if price crosses above 0.7620, which would be a confirmation of a completed c wave.
Disclosure: Please be informed that information we provide is NOT a trading recommendation or investment advice. All our work is for educational purposes only.

RISE BULLISH AS LONG AS BTC IS BULLISHRise bullish divergence from Macd and RSI. Daily chart Los Angeles 8:47AM.
When I look for places to invest I look for the absolute bottom so that I can make the most out of my investment. I try to stay away from coins that already ran a lot from this weekend.
What to look for:
Cloud will be resistance for Rise prices.
Slow growth to the top as long as more money is flowing in.
RSI stays above 40+.
RSI breaks black dotted support line I would consider selling.
Consolidation in the price action and Rise found support only way is up with the bullish market sentiment.
RiseUSD is showing bullish divergence on macd and rsi.
Macd is above 50, headed for 60 where it will find some resistance.
Price action is consolidating in Bollinger bands very nicely.

OMG/USDT ready to rise!OMG looks like it is breaking out of a symmetrical triangle. If this will happen, the price will go up very fast, like it usually happens with symmetrical triangles, probably to 8$ in the short term. MACD also looks to be turning bullish, and the RSI is showing signs of consolidation (it is making lower lows as the market price makes lower lows). This is an indication that the move is gaining momentum and therefore the break should effectively continue.
Any comment is appreciated.

21/11/2017 US Oil Analysis"Oil rises, but capped as caution sets in ahead of OPEC meeting" www.reuters.com

I Made The Right $RISE With YouJohnny Lydo n famously sings in the PIL song RISE "I made the wrong rise with you" ; but not for me this time. Like most altcoins, they are being dragged by BTC actions, however, we are finally seeing some fatigue in 'all in on btc only' meme. Yes, more money comes in daily on BTC fomo and we are glad for it as it moves the market cap up, but now I see the hints of altcoins moving up along with BTC.
BUT, like I say, the alt cryptocurrency coins get dragged like a rag doll by BTC and you can see it in the RISE chart -a 'rise' and then Altcoin Interruptus™ . Yes, I see cup and handles everywhere, I may need to seek professional help for that one. Is there a cryptoptometrist avaialble?

DASHBTC Rising from the bottomDASHBTC passed very hard time last month its dropped from its high @0.096 on 22 September to the bottom @ 0.044 21 October
(by 42 degrees) trendline, this decline came as a reaction of double top pattern which formed on 26 August
Now targets of the pattern is complete and the rising era finally came - we should watch carefully RSI indicator when reaching overbought zone -
Targets as always are marked by green lines
Thank you
------------------------------------------------------------
Don't read and leave .. Like, Comment and Follow ...... its so easy

RISE 4 HOUR TIME FRAME BULLISH DIVERGENCERISE 4 HOUR TIME FRAME BULLISH DIVERGENCE. Los Angeles 2:23 PM.
RSI is above 50 and needs to break 60 to break through the clouds.
Chikou span is about to cross over the Kiju sen to confirm uptrend.
Bullish divergence shown on Macd since 10/09 - 10/23.
Only thing that needs to happen is have people notice to bring in the volume.
Market cap is low $25 million.
*Adjust the Macd to see the divergence better.


12/10/2017 BTC/USD Analysis"Bitcoin Hits $5,400 on Hopes China Will Reverse Exchange Ban" www.investing.com

Will RISE rise again. your thoughts please!Rise is back at breakout level support;
We've observed 3 previous breakouts from this level.
Can it rally up once again?

Can Rise rise to new highs?!Rise is another blockchain platform coin, which has an interesting proposition for its coin hodlers :)
For every project that the Rise dev-team assists, coinholders receive 20% of the new projects coins. Currently they say to have 4 projects lined up, of which two are openly announced (interlet an Airbnb competitor and Chipz an online casino).
From a technical perspective we have broken a falling resistance line and shifted to a more horizontal modus. Also notice the RSI that has broken upward out of a descending triangle. Also RSI has given us flat bottems when price bottems were still dropping, so we also have some form of bullish divergence!
Trade plan: wait for Rise to overcome horizontal resistance around 0.000091, then buckle up and enjoy the ride :) This coin is barely in the top 100 market cap, so plenty potential !

Buy spot for RISEWhales have been suppressing price on RISE. Bounce off support from daily chart at 7600 sats. Sell wall getting pushed up. Volume returning (indicative on 1hr chart). Sharp upturn on RSI 4hr.
Popular mid-cap coin.
Suggest 50% entry under 8000 sats, with targets as specified. Currently 7800 sats.
Set 50% entry at 6500 sats at base of buy zone.
Anything sub 6000 is a stop-loss.

RISE Breakout - Bullish Divergence, Strong MACD, Breakout!RISE breaking out. Let's see further confirmation before entering a trade around 8400-8450.
Bullish divergence is strong, MACD is strong, and a 1hr candle was closed above downtrend.
Watch for further confirmation, price target of the first resistance!
For calls like this and more, as well as overall crypto discussion: check out Sippycup Trading!
Discord Chat: discord.gg
Website: www.sippycuptrading.com

