audcad long setup price is in a triangle pattern looking neutral, no breakouts so can't really tell long term trend but short term trend is bullish due to falling wedge and support zone being tested.
Rising

audgbp longprice hit resistance and made lh's and ll's than price decided to create new hh's and hl's.


amzn rising wedgeamazon out of bollinger band on daily breaking rising wedge
at min pullback or stall

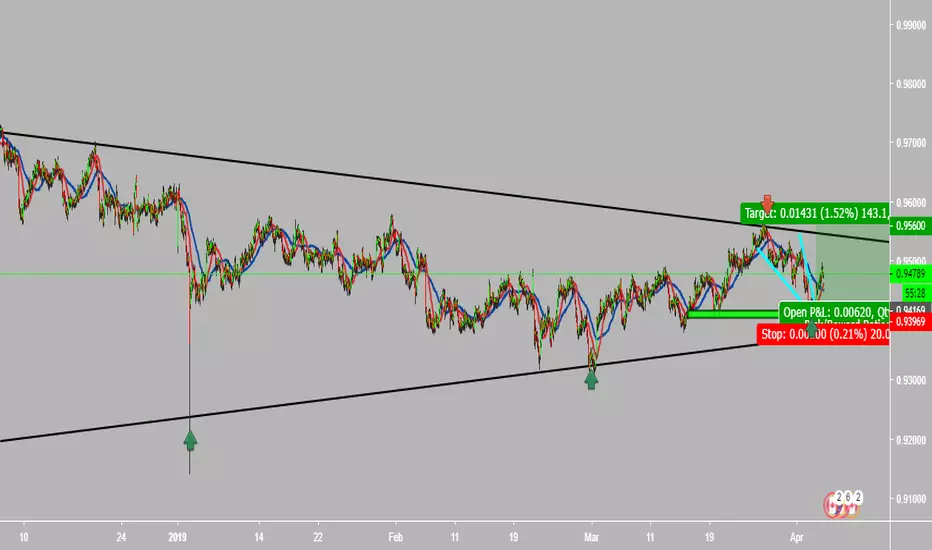
AUDNZD Rising Wedge breakoutI've been looking at this wedge last week and thought it would take longer to break so waited before posting.
Now it looks like it's already making an attempt to break the resistance of the wedge.
Trading it directly as shown on the chart.
Good risk reward ratio and tight stop in case of a false breakout.
Looks very bullish at the lower timeframe so this is a good moment to go long.
Thanks for reading, I hope you like my view.
Feedback is welcome.
Wesley

NZDJPY Rising Wedge On the 1hour chart I'm looking at a rising wedge that gives us a short opportunity.
When zooming out a bit it's a very clear picture of a longer downtrend that conforms a short fits in.
To trade this I'm going to enter as shown with a great RR of 3.58 (yes, including premature entering instead of breakout).
I've chosen for this approach because I probably won't be looking at the chart at breakout. The tight stop will cut the losses pretty quick if things don't workout but still higher than the previous high.
To everyone noticing that this wedge has a possibility for a bigger drop. That's right! But because the long term downtrend is not at this level but a bit higher my thoughts are there could pop up some buyers we want to be in front.
Thanks for reading this analysis and hope you traders have a great trading week ahead.
I would appreciate a like or a follow if you like my view.
Wesley

Make American stock market rise again Something is moving
American index are still in this uptrend that we have exploited in past sessions by positioning ourselves on a long trade. So far, the SP500 price is reaching its resistance area around 2820 points: from here it is very likely that an important retracement can start if the price does not breach this key level and confirm its breakdown.
Toward the highest (?)
If the static resistance does not yield, SP500 will try to retest the dynamic support identified by the EMA20 on weekly periods, passing around the area near the 2715 points; if the rise in the indexes should continue, the target that SP500 will point will be in the 2936 area, toward the highest historical price. In any case we will wait to reach the 2820 points before entering the market.


AUD/USD - All eyes on SHORT!Hello traders,
We are looking at AUD/USD 4HR chart, where we can see price just broke out of a Rising Wedge Pattern.
Overall the trend is still Bearish so looking for continuation and for a sell opportunity on the Wedge Re-Test.
Wait for Re-test and then a Bearish Candle confirmation and we can enter this trade with great risk-reward.
I will update this trade soon, when we reach 5 comments!
If you like my work be sure to leave a LIKE or comment below!!
See you soon,
Rodrigo FAC TEAM

GBPUSD nearing Strong resistance level before falling downwards.The price is making a very sharp move towards last years resistance forming a " Rising Wedge ". My prediction is it will test the resistance before falling down. Take profit at the first level where the wedge trend line is formed. This is valid in all the hourly time frames, might be a long term short position.

BTCUSD Triangles, TrendlinesSome patterns i'm seeing on the chart. A sloppy falling wedge, possibly currently forming a rising wedge which leads me to believe it price will not break the upper trend-line of the triangle. With price action forming a rising wedge, with the trendline there and a rejection already, i don't believe the wedge will complete but still gives the same signal with the triangle's trendline right there, that we're gonna move down. Most likely to test the lower trendline of the triangle, but we will see what price action looks like before determining that. We can also see a failed pat bullish flag in the past that lead to us testing the lower trendline. Also notice the falling wedge that had a false (very weak) breakout with a large red candle back down to test the trendline of the falling wedge, and recovered to continue the breakout.
These charts are mostly for personal use so do not take this as trading advice, more of a public journal of what i'm practicing. Please feel free to leave any feedback!

All that glitters IS goldThis chart is screaming for a breakout
The SPY is screaming for a retrace down
We are waiting for a confirmation breakout above the upper yellow resistance line at which point we will enter a long towards the targets set forth on the chart.
Best of luck traders

USDJPY Possible Rising Wedge - Continuation to further down!After the bad annoucnment from Apple that caused the US Dollar, I can see it drop a lot further down.

ETH RISING WEDGEETH is setting up a short opportunity. The price action and volume indicate a rising wedge is forming. Ideal entry is $165. Waiting for the pattern to continue to develop before I enter.

Let the Sell-off continue! Swing-Setup: WK-46 Nr#5Hey tradomaniacs,
welcome to another signal my friends!
Important: Wait for the retracement back to the range!
Type: Swingtrade
Sell-Limit:: 5,46
Stop-Loss: 5,52073
Target 1: 5,37220
Target 2: 5,35
Targt 3: 15,27613
Peace and good trades
Irasor
Trading2ez
Wanna see more? Don`t forget to follow me.
Any questions? PM me. :-)

GBPAUD SHORT POSITIONRISING WEDGE FORMED ON H1 & H4
REACHED TOP OF PREVIOUS RESISTANCE TREND. MIGHT BE A GOOD SHORT IF THE PRICE STAYS BELOW RESISTANCE LINE
STOCHASTIC SHOWING OVERSOLD

BTC possible breakout 1/11/2018We maintain over 50 rsi line , next stop ,if we don't go down will be another up hit into 70 area , we have 1 resistance tested up and one down

USD/CHF Almost at the top of rising wedgeStoploss at the top of the wedge should be good, hopefully we break through the downside!

#NZDJPYIdentifed rising flag after a breakout, although this is a sign of a reversal, looking for price to reach red line(0.5 Fib Retracement) before potentially making its way down. Wait for price to enter demand zone before setting a buy stop @73.598. Stop loss goes below previous low, and target is 30 pips for a risk/reward of 3.

USD/JPY Confirmed bounce from the rising wedgeAs we can see on the daily chart we have bounced from the support of the lower part of the wedge. This makes the perfect opportunity for low risk high reward trade. I have entered with big lot size, because of the risk-reward ratio. Good luck to everyone.
-This is not a financial advise, but only my opinion. Trade at your own risk!

Rising Wedge? Or 3 Green Soldiers? Bear/Bull cases for btcShown here on the 4hr chart is a potential rising wedge we may be in. Those tend to break downward....the potential bear flag we were in we seem to have broken upward from but with the current lack of bull volume to go with that break up we now how to explore other patterns. One is this current rising wedge we are seeing on the 4hr which tend to break bearish. However, we also seem to be forming a 3 green soldier pattern on the daily chart which tends to signify a trend reversal and would be bullish, I'm optimistically bullish for now but am keeping the rising wedge breakdown possibility on the table just in case my bullish bias doesn't pan out. I will post a daily chart snapshot below this so you can see the bull pattern as well. Thanks for reading!

