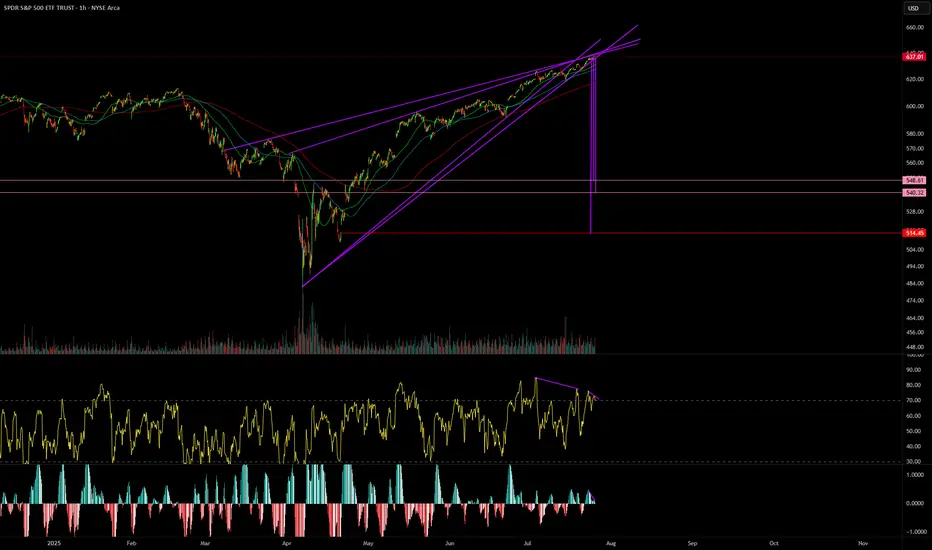
SPY Imagine the SmellImagine the smell from the Bulls if the $514 gap is filled.
Bearish divergence galore.
Not a matter of if this wedge breaks.
Its when.
Rising Wedge
Trading Divergences With Wedges in ForexTrading Divergences With Wedges in Forex
Divergence trading in forex is a powerful technique for analysing market movements, as is observing rising and falling wedges. This article explores the synergy between divergence trading and wedges in forex, offering insights into how traders can leverage these signals. From the basics to advanced strategies, learn how you could utilise this approach effectively, potentially enhancing your trading skills in the dynamic forex market.
Understanding Divergences
In forex trading, the concept of divergence plays a pivotal role in identifying potential market shifts. A divergence in forex, meaning a situation where price action and a technical indicator like the Relative Strength Index (RSI) or Moving Average Convergence Divergence (MACD) move in opposite directions, often signals a weakening trend. This discrepancy is a valuable tool in divergence chart trading, as it may indicate a possible reversal or continuation of the current trend.
There are two primary types of divergence in forex—regular and hidden. Regular divergence occurs when the price makes higher highs or lower lows while the indicator does the opposite, often signalling a reversal. Hidden divergence, on the other hand, happens when the price makes lower highs or higher lows while the indicator shows higher highs or lower lows, typically suggesting a continuation of the current trend.
Trading Rising and Falling Wedges
Rising and falling wedges are significant patterns in forex trading, often signalling potential trend reversals. A rising wedge, formed by converging upward trendlines, often indicates a bearish reversal if it appears in an uptrend. Conversely, a falling wedge, characterised by converging downward trendlines, typically reflects a bullish reversal if it occurs in a downtrend.
Traders often look for a breakout from these patterns as a signal to enter trades. For rising wedges, a downward breakout can be seen as a sell signal, while an upward breakout from a falling wedge is often interpreted as a buy signal. When combined with divergences, this chart pattern can add confirmation and precede strong movements.
Best Practices for Trading Divergences
Trading divergence patterns in forex requires a keen eye for detail and a disciplined, holistic approach. Here are key practices for effective trading:
- Comprehensive Analysis: Before trading on divergence and wedges, be sure to analyse overall market conditions.
- Selecting the Right Indicator: Choose a forex divergence indicator that suits your trading style. Common choices include RSI, MACD, and Stochastic.
- Confirmation Is Key: It’s best to watch for additional confirmation from price action or other technical tools before entering a trade.
- Risk Management: Traders always set stop-loss orders to manage risk effectively. Divergence trading isn't foolproof; protecting your capital is crucial.
- Patience in Entry and Exit: Be patient as the divergence develops and confirm with your chosen indicators before entering or exiting a trade.
Strategy 1: RSI and Wedge Divergence
Traders focus on regular divergence patterns when the RSI is above 70 (overbought) or below 30 (oversold), combined with a rising or falling wedge pattern. The strategy hinges on identifying highs or lows within these RSI extremes. It's not crucial if the RSI remains consistently overbought or oversold, or if it fluctuates in and out of these zones.
Entry
- Traders may observe a regular divergence where both the price highs/lows and RSI readings are above 70 or below 30.
- After the formation of a lower high (in an overbought zone) or a higher low (in an oversold zone) in the RSI, traders typically watch as the RSI crosses back below 70 or above 30. This is accompanied by a breakout from a rising or falling wedge, acting as a potential signal to enter.
Stop Loss
- Stop losses might be set just beyond the high or low of the wedge.
Take Profit
- Profit targets may be established at suitable support/resistance levels.
- Another potential approach is to exit when the RSI crosses back into the opposite overbought/oversold territory.
Strategy 2: MACD and Wedge Divergence
Regarded as one of the best divergence trading strategies, MACD divergence focuses on the discrepancy between price action and the MACD histogram. The strategy is particularly potent when combined with a rising or falling wedge pattern in price.
Entry
- Traders typically observe for the MACD histogram to diverge from the price. This divergence manifests as the price reaching new highs or lows while the MACD histogram fails to do the same.
- The strategy involves waiting for the MACD signal line to cross over the MACD line in the direction of the anticipated reversal. This crossover should coincide with a breakout from the rising or falling wedge.
- After these conditions are met, traders may consider entering a trade in anticipation of a trend reversal.
Stop Loss
- Stop losses may be set beyond the high or low of the wedge, which may help traders manage risk by identifying a clear exit point if the anticipated reversal does not materialise.
Take Profit
- Profit targets might be established at nearby support or resistance levels, allowing traders to capitalise on the expected move while managing potential downside.
Strategy 3: Stochastic and Wedge Divergence
Stochastic divergence is a key technique for divergence day trading in forex, especially useful for identifying potential trend reversals. This strategy typically employs the Stochastic Oscillator with settings of 14, 3, 3.
Entry
- Traders may look for divergence scenarios where the Stochastic readings are above 80 or below 20, mirroring the RSI approach.
- This divergence is observed in conjunction with price action, forming a rising or falling wedge.
- Entry may be considered following a breakout from the wedge, which signals a potential shift in market direction.
Stop Loss
- Setting stop losses just beyond the high or low of the wedge might be an effective approach.
Take Profit
- Profit targets may be set at key support/resistance levels.
The Bottom Line
Divergence trading, coupled with the analysis of rising and falling wedges, offers a comprehensive approach to navigating the forex market. By integrating the discussed strategies with sound risk management and market analysis, traders may potentially enhance their ability to make informed decisions in the dynamic world of forex.
This article represents the opinion of the Companies operating under the FXOpen brand only. It is not to be construed as an offer, solicitation, or recommendation with respect to products and services provided by the Companies operating under the FXOpen brand, nor is it to be considered financial advice.

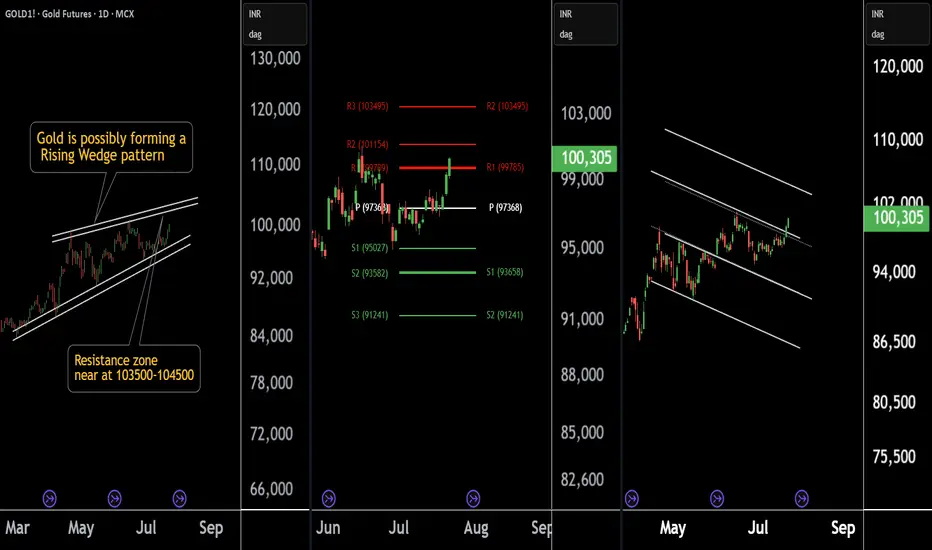
Gold at a Crossroad: Long or Short? Key Levels in FocusThere are three chart of Gold .
Gold1! is forming a Rising Wedge pattern, with resistance positioned between 103500-104000 levels.
Gold1! is facing Pivot Point resistance around the 103500 level, indicating potential supply pressure.
Gold1! is approaching the parallel channel resistance, and the upside move is nearly complete in percentage terms, with resistance around 103800-104000.
if this level sustain then we may see first of all higher prices then again fall in gold1!
Thank You !!
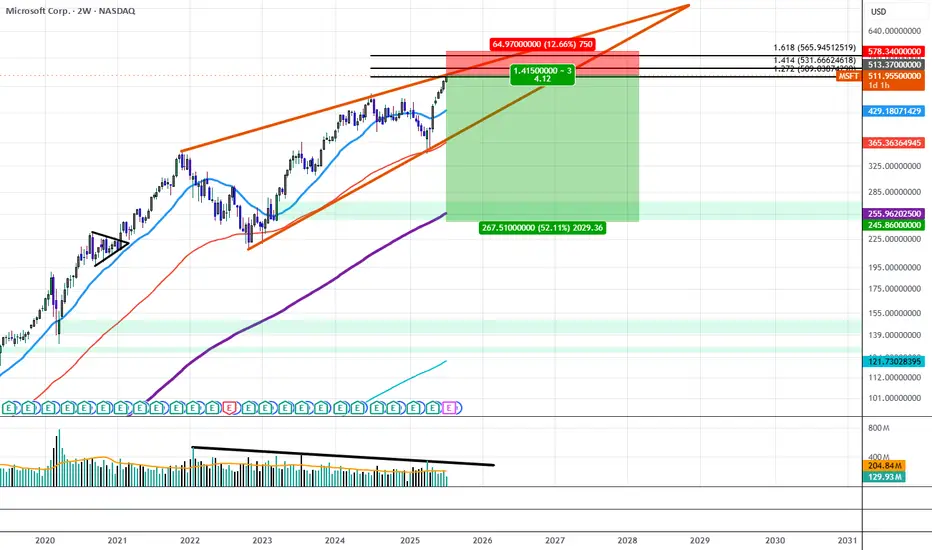
Microsoft Sees Declining Trading Volume Despite All Time HighsSince December of 2021, MSFT traded within a Rising Wedge structure that has gradually resulted in lower and lower highs in volume, at the same time IV on the Options Chain has begun to price down the strikes above $515 while Shorter Term Downside IV has begun to price up all the way out to $240.00. If this trend continues we will likely see the $515 area act as strong resistance as liquid interest above it begins to dry out.
This could be the beginning of a move to break down the wedge and trade down to the lower strikes first targeting the $365 price level and resolving around $240 near the 200 Period SMA.
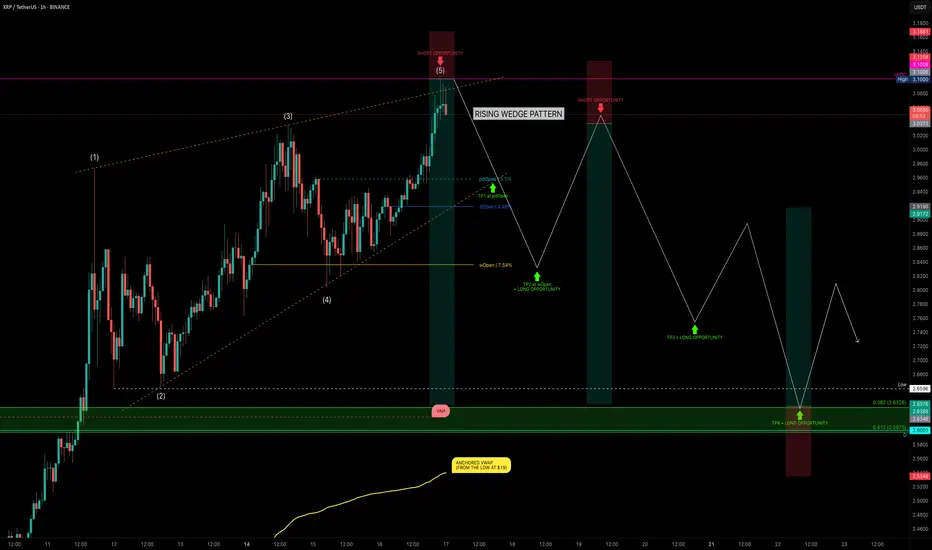
XRP Hits $3.10 — Rising Wedge or Ready to Fly?XRP has been on a strong run over the past 24 days, rallying from $1.90 → $3.10 — a +62% price increase. But after hitting key resistance, is XRP about to correct, or will it break out further? Let’s dive into the technicals.
🧩 Market Structure
Rising Wedge Pattern:
The current market structure resembles a rising wedge, with XRP likely completing wave 5.
Rejection Zone Hit:
Price tapped the nPOC at $3.10 and rejected — providing a clean short opportunity.
📉 Key Support Levels & Confluences
Taking the full 24-day bullish move:
0.382 Fib Retracement: $2.6326 — aligns with liquidity pool below the $2.6596 swing low.
226-day Trading Range VAH: ~$2.62 (red dashed line) — adds confluence.
Daily Level: $2.60 — further support.
Anchored VWAP from $1.90 Low: ~$2.54 (rising over time).
✅ Conclusion: The $2.66–$2.60 zone is a critical support area and offers a solid long opportunity.
Trade Setups
🔴 Short Setup (After Breakdown Confirmation):
Wait for a sell-off & breakdown of the wedge.
Ideal entry: retest of the lower wedge edge, ideal short entry would be between 0.618–0.786 fib retracement.
🟢 Long Setup:
Entry Zone: $2.66–$2.60
SL: below VWAP line
Target: Fib 0.618 as TP
🧠 Educational Insight: Rising Wedges Explained
A rising wedge is a bearish pattern, often signalling weakening momentum as price climbs within narrowing highs and lows.
Key points:
➡️ Volume typically declines as the wedge matures.
➡️ Breakdown below the lower wedge edge often triggers stronger sell-offs.
➡️ Retests of the broken wedge support turn into ideal short entries.
Pro tip: Combine wedge patterns with fib retracement zones and VWAP levels for higher-confidence setups.
Watch for wedge breakdown confirmation before shorting.
_________________________________
💬 If you found this helpful, drop a like and comment!
Want breakdowns of other charts? Leave your requests below.
SPY (SP-500) - Rising WedgeYesterday we had a breakdown of the rising wedge on SPY. I draw out some important levels to look out for coming days/weeks. The trendline since april has also been broken. ICEUS:DXY is breaking out to which is increasing the risks for a "Risk off" scenario in tech stocks and crypto.
Nothing here should be interpreted as financial advise. Always do your own research and decisions.

NVDA Daily Chart – Rising Wedge Alert!Just analyzed this NVDA setup. We’re seeing a clear rising wedge forming near the top of a strong run-up — typically a bearish reversal pattern. Price tagged $167.89 and pulled back slightly, closing at $164.92.
If this breaks down, watch the $148.67 - 151.31 area, and below that $125 as a key level. Bulls want to see a strong hold and breakout above $168 to invalidate the wedge.
#NVDA #NVIDIA

Titan at Best Support Zone !! This is the 4 hour chart of Titan Company.
Titan having a good support zone near 3400-3460 level.
If this level is sustain , then we may see higher prices in Titan company.
Thank You !!

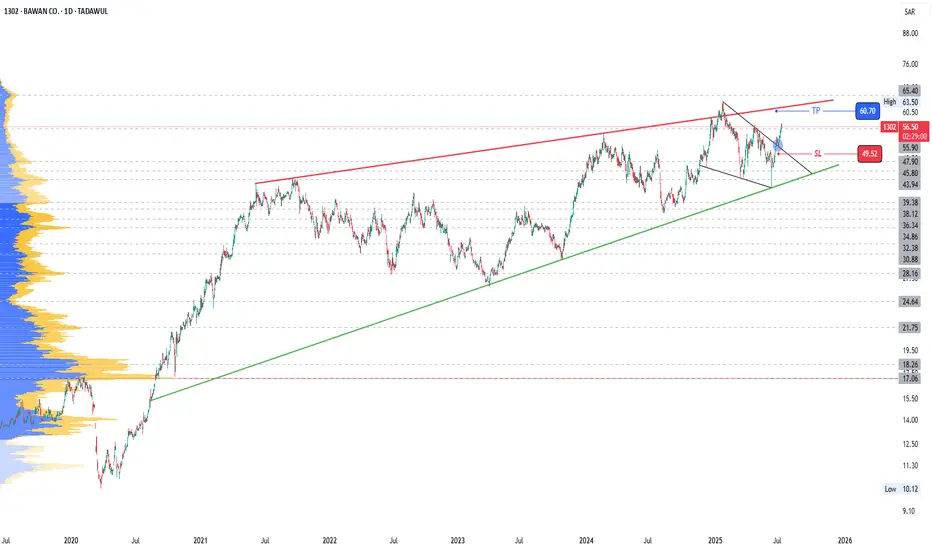
1302: Breakout of trendline resistance1302
Moving within a Rising Wedge
Price has just broken a short term resistance.
Short trade up to the top of rising wedge can be taken
Levels are marked
Trail SL accordingly.
Do proper risk management.
Watch for breakout of Rising Wedge top (Resistance)
BF UTILITIES LTD 'S KEY LEVEL || BREAKDOWN OR BREAKOUT ??These are two charts of BF Utilities – one on the daily timeframe and the other on the weekly timeframe.
In the first chart : BF Utilities is sustaining near its Law of Polarity (LOP), which is acting as a resistance zone around the 880–890 range.
In the second chart : BF Utilities is forming a Rising Wedge pattern, with the resistance also lying in the 870–880 zone.
If this level is sustain ,then we may see lower price in BF Utilities.If this level is broken, the stock may move towards the upper boundary of the channel.
Thank you !!

SHORT ON GBP/JPYGJ currently has broken a strong low of a rising wedge pattern (which is a bearish reversal pattern.
I am waiting for price to hit the supply zone before entering for a sell.
So a sell limit order will need to placed at the supply zone to take advantage of this opportunity.

HINDUSTAN ZINC LTD at Best Support !!There are two charts of Hindustan Zinc — one on the 4-hour time frame, and the second on weekly time frame.
Chart 1 (4-Hour Timeframe):
The stock is moving in a Higher High, Higher Low (HH-HL) structure, indicating a bullish trend.
Support zone is observed near the 400–410 range.
Chart 2 (Weekly Timeframe):
On the weekly chart:
the stock is approaching a major support zone in the range of ₹375 – ₹390, which has historically held strong.
If this level is sustain then we may see higher prices in HINDZINC.
Thank You !!

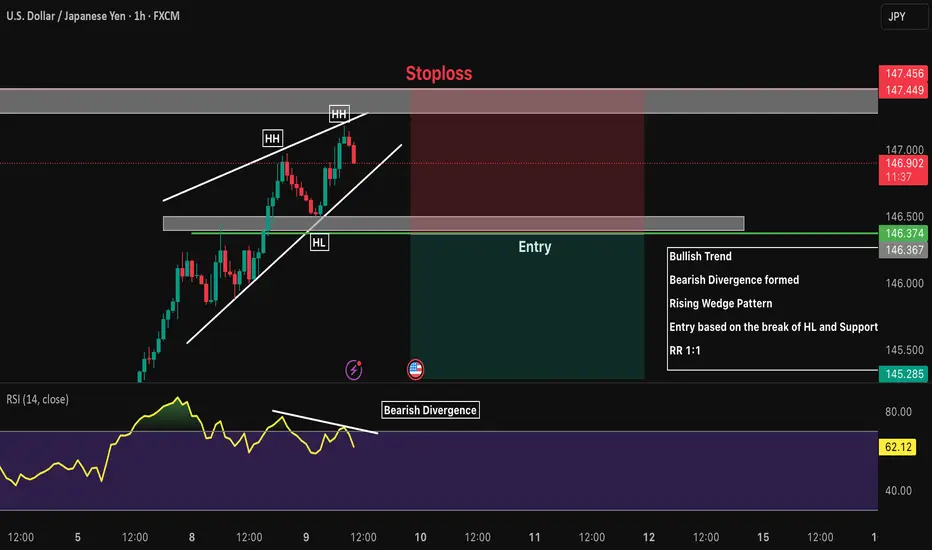
USDJPY 1H Short Bullish Trend
Bearish Divergence formed
Rising Wedge Pattern
Entry based on the break of HL and Support
RR 1:1
NZD/JPY: Bearish Wedge Before RBNZ CatalystThis is a high-conviction trade idea for NZD/JPY , where a perfect storm of technical and fundamental factors is aligning for a significant short opportunity. The setup is clean, the reasoning is strong, and we have a clear catalyst on the horizon. 🚀
Fundamental Analysis 🌪️
The macro picture is the primary driver here, creating a powerful bearish case.
1️⃣ Monetary Policy Divergence (🇳🇿 vs 🇯🇵): This is the core engine of the trade. The Reserve Bank of New Zealand (RBNZ) is dovish, signaling rate cuts amid a fragile domestic economy. In stark contrast, the Bank of Japan (BoJ) is hawkish, having started a historic policy normalization to combat persistent inflation. This fundamental clash is strongly bearish for NZD/JPY.
2️⃣ Risk-Off Catalyst (🇺🇸): The market is nervous ahead of the July 9th US tariff deadline . This uncertainty is creating a classic "risk-off" environment, which typically strengthens the safe-haven JPY and weakens risk-sensitive currencies like the NZD.
3️⃣ The RBNZ Decision (🏦): The main event on July 9. The market expects a "dovish hold," meaning even if rates are unchanged, the forward guidance will likely be very cautious, highlighting economic risks and signaling future cuts. This is the catalyst that could trigger the sell-off.
Technical Analysis 📉
The 4H chart provides crystal-clear confirmation of the fundamental weakness.
1️⃣ Bearish Rising Wedge: Price is being squeezed into a classic bearish reversal pattern. This shows that buying pressure is exhausted, and the market is preparing for a move to the downside.
2️⃣ Key Resistance Zone: The wedge is pushing directly into a heavy supply zone between 87.80 and 88.00 . This area has acted as a firm brick wall 🧱, rejecting multiple attempts to move higher.
3️⃣ RSI Momentum: The RSI below the chart confirms the weakening momentum. It's failing to show strong bullish power, which supports the price action and signals that the uptrend is running out of steam. 💨
The Trade Plan 🎯
Based on this analysis, the plan is to enter with a limit order to get an optimal entry price on a potential final spike into resistance.
Direction: Short (Sell) 📉
Order Type: Limit Sell
Entry: 87.80 📍
Stop Loss: 88.40 🛡️
Take Profit: 86.00 💰
Risk/Reward Ratio: 1:3 ⭐⭐⭐
This setup presents a rare confluence of fundamental divergence, technical weakness, and a clear catalyst.
Trade safe and manage your risk.

BTC Dominance – History Repeating? Altseason 2025 Loading? Hey Traders!
If you’re finding value in this analysis, smash that 👍 and hit Follow for high-accuracy trade setups that actually deliver!
This chart is SCREAMING for attention 👀
We’re at a critical inflection point on the weekly BTC Dominance chart — and if history has taught us anything, it’s that altseasons are born when dominance collapses from resistance.
🧠 Key Observations:
🔺 Macro Resistance Trendline:
Rejected in 2017 → Altseason 🔥
Rejected in 2021 → Altseason 🔥
Now (2025?) — BTC.D is again touching this same red trendline...
🟢 Support Trendline:
BTC.D formed a clean long-term support from which previous dominance drops have bounced — currently lining up around 42–45%.
📉 Previous drops after rejection:
2017: –50.79%
2021: –45.10%
2025 projection? –36.91% (which would bring us to the same support zone again)
🟡 What It Means:
If BTC.D gets rejected from this resistance again, it could mark the start of the long-awaited Altseason 2025. A breakdown from this wedge would likely result in capital rotation from BTC into altcoins — just like in previous cycles.
🔍 What to Watch:
A confirmed rejection from this red resistance line
Drop below the yellow wedge support
BTC sideways / ETHBTC strength = green light for ALTS
💥 This could be the altcoin opportunity of the next couple of years.
Conclusion:
All eyes on BTC Dominance — because when it falls, altcoins usually FLY.
📊 Stay updated, stay ready.

AUD/JPY# AUD/JPY: Two High-Probability Bearish Setups 🎯
## Overview
AUD/JPY continues to respect its macro downtrend structure, offering two compelling bearish opportunities as price approaches critical resistance levels. Currently trading at 94.398, the pair sits at an inflection point between key support and resistance zones.
---
## 📊 Setup 1: Resistance Zone Rejection (Primary)
### Key Level: 95.289 (Major Resistance)
This level has proven its significance multiple times:
- ✅ Strong resistance throughout recent months
- ✅ Clear seller dominance at this zone
- ✅ Confluence with descending channel structure
### Entry Strategy:
1. **Wait** for price to approach 95.289
2. **Identify** bearish rejection patterns:
- Pin bars / Shooting stars
- Bearish engulfing candles
- Multiple wick rejections
3. **Enter** short on confirmed rejection
4. **Stop Loss**: 95.50-95.60 (above resistance)
5. **Targets**:
- TP1: 93.240 (1:2 RR)
- TP2: 92.271 (1:3.5 RR)
---
## 📊 Setup 2: Rising Wedge Breakdown (Secondary)
### Pattern Recognition:
A textbook rising wedge has formed since the May lows - a bearish reversal pattern within the larger downtrend context.
### Entry Strategy:
1. **Monitor** the lower wedge trendline
2. **Wait** for decisive breakdown with volume
3. **Enter** short on retest of broken support
4. **Stop Loss**: Above recent swing high
5. **Target**: 93.240 support zone
---
## 📈 Market Structure Analysis
### Macro Trend: BEARISH 📉
- Consistent lower highs and lower lows from 102+ levels
- Currently in corrective bounce phase
- Respecting descending channel boundaries
### Current Position:
Price trapped between:
- **Resistance**: 95.289
- **Support**: 93.240
- **Deep Support**: 92.271
---
## ⚠️ Risk Management
**Patience is key!** Current price offers poor risk/reward. Wait for:
1. **Scenario A**: Test of 95.289 resistance → Short opportunity
2. **Scenario B**: Break below wedge support → Short opportunity
3. **Scenario C**: Break above 95.289 → Invalidation, stay flat
### Position Sizing:
- Risk per trade: 1-2% of account
- Adjust position size based on stop distance
---
## 🎯 Trade Summary
**Bias**: BEARISH 🐻
**Preferred Setup**: Resistance rejection at 95.289
**Risk/Reward**: Minimum 1:2
**Timeframe**: Daily
---
*Remember: The best trades come to those who wait. Let price come to your levels, don't chase!*
**What's your view? Drop a comment below! 👇**
*Disclaimer: This is not financial advice. Always do your own research and manage risk appropriately.*
---

NZDJPY Technical + Fundamental Short Alignment = Short SetupToday, I want to review the NZDJPY ( OANDA:NZDJPY ) pair short position from a fundamental and technical perspective . It seems to be in a good zone for a short position.
Do you agree with me?
----------------------------------------
First, let's look at the fundamentals of NZDJPY.
New Zealand (RBNZ):
The Reserve Bank of New Zealand cut the OCR by 25bps in May and hinted at further easing if inflation continues to cool. Recent CPI data has shown clear disinflation trends, increasing the likelihood of more rate cuts in the second half of 2025. Consumer confidence is also declining, and retail sales have been weaker than expected.
Japan (BoJ):
The Bank of Japan is under growing pressure to tighten monetary policy. Inflation remains above 2%, and market expectations for a rate hike later this year are building. Any shift from ultra-loose policy supports JPY strength, especially against weaker yielders like NZD.
Macro Summary:
Diverging monetary policies: RBNZ easing, BoJ possibly tightening.
NZD weakened by soft data, JPY strengthened by policy expectations.
Risk sentiment is currently neutral-to-negative, favoring safe-haven JPY.
Conclusion:
Short NZDJPY is fundamentally justified. The pair aligns with macro forces: NZD is pressured by rate cuts and weak growth, while JPY is poised to strengthen with upcoming policy shifts.
----------------------------------------
Now let's take a look at the NZDJPY chart on the 4-hour time frame .
NZDJPY is currently trading near the Potential Reversal Zone(PRZ) .
In terms of classic technical analysis , it appears that NZDJPY has successfully formed a Rising Wedge Pattern .
Also, we can see the Regular Divergence(RD-) between Consecutive Peaks.
Based on the above explanation , I expect NZDJPY to drop to at least 87.159 JPY if the lower line of the Rising Wedge Pattern and the Support zone(86.50 JPY-87.00 JPY) are broken, the second target could be 86.043 JPY .
Note: Stop Loss(SL): 88.378 JPY
Please respect each other's ideas and express them politely if you agree or disagree.
New Zealand Dollar/ Japanese Yen Analyze (NZDJPY), 4-hour time frame.
Be sure to follow the updated ideas.
Do not forget to put a Stop loss for your positions (For every position you want to open).
Please follow your strategy and updates; this is just my Idea, and I will gladly see your ideas in this post.
Please do not forget the ✅' like '✅ button 🙏😊 & Share it with your friends; thanks, and Trade safe.

Gold Correction = Bearish Divergence + Wedge + Zigzag CompleteGold ( OANDA:XAUUSD ) attacked the Resistance zone($3,387-$3,357) today after the release of the US CPI indices . Although the figures seemed to be in gold's favor, traders still seem to be determined to continue the price correction.
In terms of Elliott Wave theory , it seems that Gold has managed to complete the Zigzag Correction. We should wait for the next 5 down waves .
Also, we can see the Regular Divergence(RD-) between Consecutive Peaks .
In terms of Classic Technical Analysis , Gold appears to have successfully formed a Rising Wedge Pattern .
I expect Gold to drop to at least $3,296 AFTER breaking the lower line of the Rising Wedge Pattern .
Note: Stop Loss(SL)= $3,380
Gold Analyze ( XAUUSD ), 1-hour time frame.
Be sure to follow the updated ideas.
Do not forget to put a Stop loss for your positions (For every position you want to open).
Please follow your strategy; this is just my idea, and I will gladly see your ideas in this post.
Please do not forget the ✅' like '✅ button 🙏😊 & Share it with your friends; thanks, and Trade safe.

AUDCHF → Hunting for liquidity. Fall from resistanceFX:AUDCHF is emerging from local consolidation and entering a distribution phase. Potentially, against the backdrop of a downtrend, the market may be interested in the liquidity zone at 0.5356
Globally, we have a strong downtrend and a countertrend correction that is facing pressure in the 0.545 zone. The decline is resuming, but at some point the market formed an EQH liquidity pool at 0.5356, which is most likely acting as a magnet pulling the price towards it...
Based on the technical situation, we can conclude that if the price continues to form a distribution towards the target, the market is quite capable of stopping the price and returning to the downtrend phase.
Resistance levels: 0.535, 0.5356
Support levels: 0.5327, 0.5314
Thus, a breakout of the resistance level of 0.5356 without the possibility of continuing growth and a return of the price below the resistance level with subsequent price consolidation in the sales zone (below 0.5356) may trigger a resumption of the downward trend.
Best regards, R. Lind

What is a Bearish Breakaway and How To Spot One!This Educational Idea consists of:
- What a Bearish Breakaway Candlestick Pattern is
- How its Formed
- Added Confirmations
The example comes to us from EURGBP over the evening hours!
Since I was late to turn it into a Trade Idea, perfect opportunity for a Learning Curve!
Hope you enjoy and find value!

EURUSD Forms Rising Wedge + Evening Star_ Bearish SetupAs I expected in the previous idea , the EURUSD ( FX:EURUSD ) started to rise after breaking the upper line of the descending channel and hit the Long Position target with Risk-To-Reward: 1.46 .
The EURUSD is trading near the Resistance zone($1.149-$1.142) .
From a Classic Technical perspective, EURUSD appears to be completing a Rising Wedge Reversal Pattern . Also, a good sign for a EURUSD reversal is the formation of an Evening Star Candlestick Pattern near the upper line of the rising wedge pattern.
Also, we can see the Regular Divergence(RD-) between Consecutive Peaks .
In terms of Elliott Wave theory , I think the EURUSD corrective waves are NOT over yet, and it seems that EURUSD has completed the main wave X inside the rising wedge pattern.
I expect EURUSD to decline to at least $1.126 AFTER breaking the lower line of the wedge pattern.
Note: If EURUSD touches $1.14903 , we can expect more pump.
Please respect each other's ideas and express them politely if you agree or disagree.
Euro/U.S. Dollar Analyze (EURUSD), 4-hour time frame.
Be sure to follow the updated ideas.
Do not forget to put a Stop loss for your positions (For every position you want to open).
Please follow your strategy and updates; this is just my Idea, and I will gladly see your ideas in this post.
Please do not forget the ✅' like '✅ button 🙏😊 & Share it with your friends; thanks, and Trade safe.

Flying into the sun or about to get burnt?Market is about to reach all-time highs again. Many trade deals must have been made. Interest rates must have been cut. Wars must have been resolved. Personal debt must have come under control. Corporate debt must have been resolved.
Wait, nothing has changed? Things are worse? Well why is the index about to hit new all-time highs? My take is a major fake out. We are about to set a double top as we complete a rising wedge pattern.
The rising wedge.
What began at the market bottom on 7 April, has remained bound in a channel. If the first pump up was an A followed by the declaration of the channel bottom as B, wave C has last over a month upward. We have wave 3 signals identifying wave 3 of C ending with the high on 19 May. Last week's dip was wave 4 and now we fly high this week. It is unclear if we actually make a new all-time high or fall just short. The below chart has 138.197% extension around 610.63. Inside wave C, my wave 1 was nine days long, and wave 3 was only 8. This points to wave 5 lasting less than 8 days. A common wave 1-3-5 duration in relation to wave 3 is around 114% for 1 and 50% for wave 5.
The height of the rising wedge covers 66.82 points. This same distance should provide the first target bottom once we exit the channel, possibly as early as next week. Once the bottom falls, we then examine the double top pattern. Although the neckline stretches far backwards, the bottom is established at the 7 April low. The distance from the neckline to the all-time high in February provides the next possible minimum target bottom by taking this 131.43 drop and subtracting it from the neckline of 481.80. This puts the initial low around 350.37 sometime later this year or early next.
There is a perfect storm of calamity brewing with zero resolutions in place or even planned. Do we finally drop or keep rising into the sun?

EUR/USD - Is the uptrend about to end?The EUR/USD currency pair has demonstrated a consistent uptrend on the 4-hour chart for approximately two weeks. This sustained bullish momentum has captured the attention of traders and analysts alike, who are now questioning whether the pair can maintain its upward trajectory or if a retracement is imminent as it approaches significant resistance levels.
Rising wedge
A closer examination of the price action reveals that EUR/USD has been advancing within a rising wedge formation. This technical pattern is generally considered bearish, as it often precedes a reversal or a breakdown rather than a continued rally. Rising wedges are characterized by converging trendlines, with price making higher highs and higher lows at a diminishing rate, which typically signals waning bullish momentum and a potential for sellers to regain control.
Strong resistance
Recently, the pair encountered a notable resistance zone around the 1.141 level. Upon reaching this area, EUR/USD faced a rejection, resulting in a pullback from its recent highs. While there is a possibility that the pair could make another attempt to test this resistance, the initial rejection suggests that the upward move may be losing steam. As a result, the likelihood of a retracement has increased, especially given the bearish implications of the rising wedge pattern.
Support/target zone
If the pair does indeed correct lower, a logical target for a cooldown would be the green support zone near 1.127. This level has previously acted as a strong support area, and it could serve as a foundation for buyers to step in once more, potentially setting the stage for another move higher. Until the resistance at 1.141 is decisively broken, caution is warranted, and a period of consolidation or a pullback towards support appears increasingly probable.
Thanks for your support.
- Make sure to follow me so you don't miss out on the next analysis!
- Drop a like and leave a comment!
