BTC Daily Rising WedgeThis shape is generally a bearish pattern, with the likelihood of a breakdown to the next major support area.
The rising wedge pattern is one of the numerous tools in technical analysis, often signaling a potential move in the asset or broader market. Recognizing this pattern involves identifying a narrowing range of prices enclosed by two upward-sloping trendlines that converge over time.
Price is stalling at a major resistance. This is likely to be an area for traders taking profit who bought in the range of 16,000 to 30,000.
The RSI is above 70, which often signals a reversal for BTC.
The next major support coincides with the area between the .5 and the .618 fib retracement level around 31,000.
NFA
Do your own DD
Thanks for looking at my idea!
Rising Wedge

GBP/JPY Sell Trade Setup ⬇️Hello Traders 🙋🏽♂️
🟠 EP 182.765
🔴 SL 186.050
🟢 TP1 179.530
🟢 TP2 175.930
🟢 TP3 172.535
Please support us with like & comment & Follow
Disclaimer
---------------
Trading is risky we all take loses
your responsibility is to not take more than 1% to 2% loss per trade and double your profits.

Why Bitcoin may move down to 12.5k1.) The 50/200 day EMA are about to complete a death cross (the 50/200 day MA have already done so, not shown above)
2.) The weekly price action has formed a rising wedge
3.) Price stalled out at the first area of resistance, failing to reach as high as the candle close from July of 2021
4.) Weekly RSI has printed a head and shoulders pattern and looks like it wants to move down. Note that there could be an interim re-test of the neckline that provides a small rally before breaking down.
5.) 12.5k is the next area of support after losing 16.5k.
6.) Volume has gone down as price corrected, indicating weakness.
For Bitcoin to return to bullish, it needs to get back above the 50/200 day EMA and MA, and we should see a strong reaction following the death crosses that quickly cross back over.

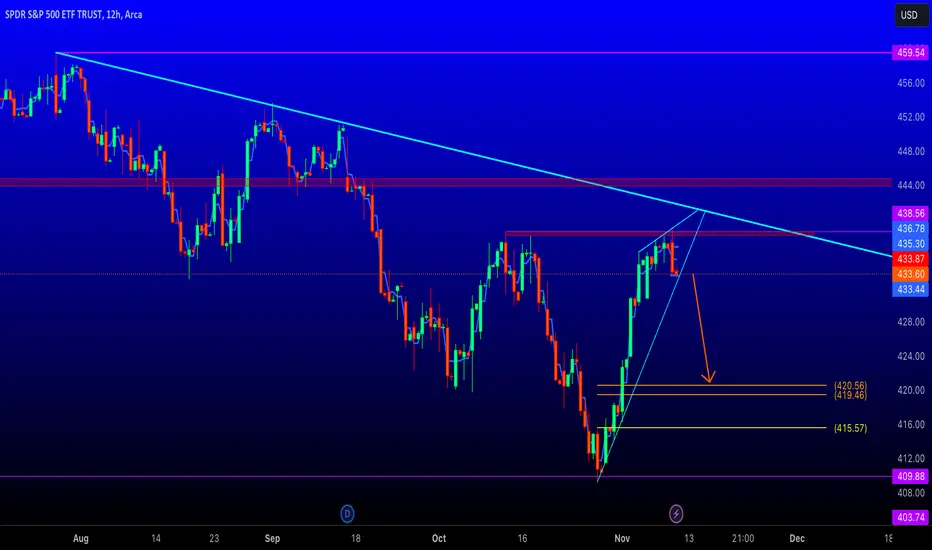
SCARED?!?! SPY LOOKS VERY BEARIS HERE!SPY has reached the range highs and has shown signs of weakness not being able to breakthrough the highs. It has been rejected and is now at a vital dynamic support. If this break (which i think it will), a move to the golden pocket (orange lines) could follow.
Calculate Your Risk/Reward so you don't lose more than 1% of your account per trade.
Every day the charts provide new information. You have to adjust or get REKT.
Love it or hate it, hit that thumbs up and share your thoughts below!
This is not financial advice. This is for educational purposes only.
BTCUSD (SHORT): Navigating the Rising Wedge A Strategic ShortTo tell you how much I was devastated when I posted my last idea and it did not play out.
I admit my mistakes and that's how we all grow. I am no perfect guy and I am just here to take time and look at the charts. Sometimes looking at it for too long makes everything a bit emotional. It reaches to the point where my own opinion are not being followed and had no time to update everyone. So... here it is...
In the intricate dance of supply and demand... Bitcoin currently presents a choreography that technical analysts might recognize as a rising wedge (that's the market sentiment now). This pattern typically heralds a bearish sentiment and is often seen as a precursor to a price descent. Here’s why the current formation could spell a retreat to the $31,000 region, strengthening the thesis for a potential short position:
1 The Rising Wedge Formation: Historically, the rising wedge is a bearish pattern formed by a price consolidation that results in a tightening range with a slight uptrend. This pattern indicates exhaustion in buying pressure and, upon completion, often leads to a sharp reversal to the downside.
2 Trading the Break: A classic approach suggests entering a short position after a clear and impulsive close below the lower trendline of the wedge. In our current BTCUSD scenario, this would indicate a rejection of higher prices and could validate the bearish outlook, eyeing the $34,800 level as an initial target.
3 Retest for Confirmation: A retest of the lower trendline post-breakout offers a second entry point. This method capitalizes on a smaller stop loss placement, providing a refined risk management strategy. An impulsive rejection after the retest would further confirm the bearish momentum.
4 The Upper Edge Strategy: My preferred method involves initiating a short near the upper trendline upon identification of a compelling sell signal. This offers an attractive entry point with a tight stop loss and a high potential reward, anticipating the inevitable downside breach.
Given the confluence of these strategies and the looming wedge pattern on Bitcoin’s chart, the outlook is tilted towards a bearish bias. The ideal short entry at the $34,100 level aligns with the upper trendline touch strategy, providing a compelling risk-reward scenario.
Conclusion:
Bitcoin’s dance with the rising wedge presents a compelling case for a strategic short. The confluence of the wedge's bearish implication with the outlined entry strategies fortifies our thesis of a retracement to $30,000, providing a prime opportunity for short-sellers to capitalize on the anticipated reversal.
Next Steps:
Monitor for a clear impulsive close below the lower trendline or a retest rejection. Be vigilant for sell signals near the upper trendline for an optimal short entry. Patience and precision in entry will be key to navigating the potential downturn.

ZRX FORMING A RISING WEDGE BINANCE:ZRXUSDT is forming a rising wedge, or a bearish wedge potentially could see a reversal from a day trading standpoint.
In my technical analysis, the price has reached an essential key resistance level of $0.2720 or the .618 Fib retracement as shown in the chart below on a daily timeframe.
RSI indicator is showing a bearish divergence wherein it forms a lower high and the price forms a higher high.
Currently the price forms another higher high, the next resistance would be at $0.2967 if the price would push upwards based on the Fib retracement extension of 2.236. I could determine the next trendline as valid utilizing the back test process.
If you're looking to trade this coin NOW, use this diagonal support as guide. It also formed divergence as well.
If a breakdown confirmation happens, set partial take profits on the common support lines.
I will try to update on that :)
Always PLAN your trades and happy Halloween 🎃

BTC bearish BTC forming a rising Wedge pattern which is bearish if the pattern playouts then we can expect a down movement in price.
.
.
.DYOR!!!!

FNGD retrace to $8.50 before target of $10.51, coil/fakeout/pumpFNGD to go back down to $8.50 before target of $10.51 Nxt
I'm expecting a little retracement back to $8.51 with buy limits set from 8.88 down to 8.51
Take Profits at $10.17 and $10.51
Expect to retrace again and coil up. People will be talking about bears taking over, but the Santa rally will cheer bulls up and give them hope... meanwhile we are playing both sides.
Into 2024:
Due to everything going on and how much this market has tripped everyone up and out, I expect a double fakey to occur. FNGD will appear to be pumping (bears winning on FNGU and S&P) then the bulls will appear to take control and the descending triangle on the S&P will appear to have a breakout to the upside only to fail.
People will say its due to a news event, but the Operator/Fed is planning this. Equities will retreat to safety of Bonds. S&P will Fall, and lay off employees, people will beg for the Fed to cut rates and when they do Bonds will explode then Gold then after Equities and Crypto Capitulation we will rebuild on the scorched earth.
BUY BUY BUY WHEN THERE IS BLOOD IN THE STREETS IN MARCH/APRIL 2024!

Rising Wedge breakdown in BHARTIARTLBHARTI AIRTEL LTD
Key highlights: 💡⚡
✅On 1Hour Time Frame Stock Showing Breakdown of Rising Wedge Pattern .
✅ Strong bearish Candlestick Form on this timeframe.
✅It can give movement up to the Breakdown target of 894-.
✅Can Go short in this stock by placing a stop loss above 953+.

Rising Wedge breakdown in TRENTTRENT LTD
Key highlights: 💡⚡
✅On 1Hour Time Frame Stock Showing Breakdown of Rising Wedge Pattern .
✅ Strong bearish Candlestick Form on this timeframe.
✅It can give movement up to the Breakdown target of 2017-.
✅Can Go short in this stock by placing a stop loss above 2115+.

Coin Watch: Ethereum (ETH)Let's start on the weekly and daily charts:
The weekly shows an ascending wedge.
A rising wedge is often considered a bearish chart pattern that indicates a potential breakout to the downside.
Trading volume and RSI are also decreasing.
=> The sentiment is bearish on the weekly timeframe.
On the daily, we are seeing consolidation areas. The current area might be broken to either side, knowing the previous one broke down. It's important to remember that we are at the support level of the rising wedge on the weekly chart, so we could bounce off it, or break it down.
The RSI is rising however and making higher lows which is a bullish sign.
Moving on to the 4 hours chart:
We basically zoomed in that consolidation area. The market is clearly ranging, meaning people are buying at support areas and selling at resistances.
The RSI is also ranging but showing a bullish divergence although already being in overbought areas.
Another chart I think is important to look at when analysing Ethereum is the ETH/BTC one.
The weekly chart clearly shows us that BTC is gaining power against ETH through the year and is showing no sign of stopping! That, to me, is a strong bearish signal for ETH.
Stay tuned!

CADJPY_28.09.2023_Potential to develop triangle & double topCADJPY analysis:
1. Time frame daily & weekly, currently price in a strong resistance area, but the upward movement in prices is starting to slow down.
2. Time frame daily, price has the potential to develop double top pattern which is a reversal pattern.
3. Time frame H-4, price has the potential to develop rising wedge pattern.
Double top & rising wedge patterns have potential to form in a strong resistance area, so we can make this momentum to find a good position to have a selling position.
Notes:
- This is a personal analysis, please adjust it to the existing conditions.
- This is not a buy/sell recommendation. This is just my personal analysis.
- Please analyze again, because you are responsible for your decision. Your losses are your responsibility, your profits are yours.
- Still in the learning process, let's learn together :)
Thank You

NZDUSD Rising Wedge Pattern BreakoutThe pair is already in a strong downtrend on higher time frames. We are expecting further weakness which is signalled by the breakout of the rising wedge pattern. We can also see the formation of a new low and a breakout of a key level which further supports our directional basis

NZDJPY Rising Wedge BreakoutThe pair is already in a strong downtrend on higher time frames. We are expecting further weakness which is signalled by the breakout of the rising wedge pattern. We can also see the formation of a new low and a breakout of a key level which further supports our directional basis.

BluetonaFX - EURGBP Rising Wedge SHORT IdeaHi Traders!
There is a rising wedge pattern on EURGBP, which signals a possible reversal of the bullish trend we have seen over the past two months.
Price Action 📊
The market failed to break the previous resistance at the 0.87014 area, which led to lower highs and lower lows market swings, followed by a momentum break below the 20 EMA. This shows that there may be new waves of bearish volume entering the market.
We are looking for a bearish break and a close below the support trendline.
Fundamental Analysis 📰
Traders seem to be uncertain about the euro after ECB president Lagarge claimed that she is confident the ECB's policy will bring inflation back down to their 2% goal.
Support 📉
0.86140: SUPPORT TRENDLINE
Resistance 📈
0.86428: PEVIOUS DAY'S HIGH
Risk ⚠️
No more than 2% of your capital.
Reward 💰
At least 4% of your capital.
Please make sure to click on the like/boost button 🚀 as your support greatly helps.
Trade safely and responsibly.
BluetonaFX

USDJPYUSDJPY was trading in rising wedge pattern till the sellers took control from channel resistance and has given the massive sell rally. That sell rally break the inclining trendline of the wedge.
Now the price is retesting the broken trendline and broken support level.
it seems like the sellers can attack again this bearish confluence.
If the sellers takes charge again, the next target could be 147.35

USDJPY - Bearish Rising Wedge 📉Hello Traders!
On Tuesday 3 Oct, The USDJPY Price Reached a Resistance Level (150.315 - 150.160).
-The Price Formed a Rising Wedge Pattern !
-The Support Line of The Wedge is Broken.
So, I Expect a Bearish Move📉
i'm waiting for retest...
-----------
TARGET: 146.630🎯
___________
if you agreed with this IDEA, please leave a LIKE, SUBSCRIBE or COMMENT!

Bank Nifty - Long Term Analysis Technical Analysis:
Bank Nifty down by over a percent today, it led me to analyse its long term charts and what I see is not that great (P.S-I am not an expert)
Let's start with the big question, is it forming a Rising Wedge?
It clearly looks like plus it has tested the resistance for over 6 years now.
Now talking about the weekly chart of bank nifty, it looks like it is forming a double top and although now it is around the support level but it looks that it can be easily broken.
The worst would be when the rising wedge breakdown confirms
On the Monthly chart there has been a bearish engulfing followed by a shooting star (both Bearish) and this month has confirmed the bearishness so far.
Also I analysed the sector charts of both private and public banks, and private banks charts looks similar to the bank nifty (double top) bearish - considering bank nifty % is dominated by the pvt banks coz of market cap. Now Public banks have given massive wealth to the retailers and now is around its all time high, also it has been one side rally so not a lot of consolidation and is around the supply zone or resistance. Another negative point.
I have also marked a support level to which it can come down plus you can consider 200 MA on weekly as another support
Fundamentally banks have been performing well on many parameters and will continue to do so but it feels like the time when there will be massive profit booking specially from FII's as their accounts get closed by the end of December unlike ours end of march.
This is not a trading call, just my analysis. So be cautious if you trade.
Would love to know your comments if you agree or disagree, here to learn and understand your point of view

Bitcoin is extremely bullish and left people in disbelief!
Bitcoin continues to rally from the bottom of 24920 to 27137 and is heading towards 28650! This is going to happen; the bull market is absolutely awesome, and profits are huge!
If you are following me, I have been bullish almost from the bottom of the last big dump while the majority is still shorting Bitcoin on futures, which can also be seen in the negative funding rate on exchanges.
I hope you guys are enjoying this bullishness as much as I do, and I wish you massive profits!
From a technical perspective, the price of Bitcoin is moving in the ascending parallel channel on the 4H chart and will touch the trendline in the first week of October! This is also a strong resistance because of the 1:1 Fibonacci extension from wave (1) -> wave (2).
October, November, and December are statistically bullish months for Bitcoin, so we should expect an uptrend this season. Summer is usually boring, and September is usually bearish.
I see bullishness on Ethereum and altcoins, which is another good sign for the crypto market. DXY is pretty bullish, while Bitcoin is bullish as well, another strong sign!
What about gold and silver? These assets are going down, while Bitcoin is also rising, making a bullish divergence another good sign!
This analysis is not a trade setup; there is no stop-loss, entry point, profit target, expected duration of the trade, risk-to-reward ratio, or timing. I share my trades transparently and privately.
Thank you, and for more ideas, hit "Like" and "Follow"!

Ethereum is starting a new bull market! (after 2 years)
After almost 2 years, ETH is starting a new bull market. It's still a great time to buy before ETH reaches 10,000–20,000 USDT per coin!
So why is ETH bullish? To answer this question, we need to use the Elliott Wave theory and chart patterns on the weekly chart. As we can see, we have a strong Elliott Wave nest (1-2-1-2) with a combination of the previous ABC Zig Zag (3-3-3). This combo is indeed powerful! What's more, we can see an ascending triangle at the bottom of the trend, which is an even stronger bullish sign!
You want to buy Ethereum and Bitcoin as soon as possible to earn a lot of money, as the price is still very cheap.
Profits are already insane, so be greedy and enjoy the ride!
What is the profit target? You do not want to sell ETH for less than 10,000 USD per coin, that's for sure. As per my analysis, ETH could reach 20,000 USD in 2025, which you will see in one of my next analyses, so make sure you are following me! But of course, in the short term, we have some strong resistances, such as the 0.618 FIB at 2534 USD. Definitely a good profit target for swing traders.
I really look forward to 2024 and 2025, which will be bullish months! At this moment, probably 95% of traders are gone; they left the crypto space because, of course, they lost money during the previous bear market and were forced to sell their holdings. Some people may say that people should hold strongly and never sell, but if someone has to pay the bills, they are forced to sell it. So it's easy to say, right?
This analysis is not a trade setup; there is no stop-loss, entry point, profit target, expected duration of the trade, risk-to-reward ratio, or timing. I share my trades transparently and privately.
That's my outlook; be bullish and have a nice day!
Thank you, and for more ideas, hit "Like" and "Follow"!

EURNZD - Bearish Rising Wedge 📉Hello Traders!
On The Daily Time Frame, The EURNZD Broke a Support Level !
The Price Formed a Rising Wedge Pattern !
The Support Line of The Wedge is Broken🔥
So, I Expect a Bearish Move📉
i'm waiting for retest...
-----------
TARGET: 1.75750🎯
___________
if you agreed with this IDEA, please leave a LIKE, SUBSCRIBE or COMMENT!

IBM Bearish Pattern!!!When taking a look at IBM, we an see that it has had an impressive climb over the past few weeks. This bullish climb is also printing a bearish reversal pattern. The rising wedge breaks out to the downside more than it breaks upward. With this being said and the price action approaching the end of the wedge, i would expect a drop from these levels to the next support around 5% down.
If you end up taking a trade, use risk management so you don't lose more than 1%-2% of your account per trade.
Every day the charts provide new information. You have to adjust or get REKT.
Love it or hate it, hit that thumbs up and share your thoughts below!
Don't trade with what you're not willing to lose. Calculate Your Risk/Reward!
This is not financial advice. This is for educational purposes only.

AUDCHF ↘️ Rising wedge pattern analysisHello Everyone 🙋🏽♂️
As we could see at the end of the Ascending channel,
The price isn't crossing the zone 0.58700
and the rising wedge pattern is braked and retested
the price is going down now . be ready
We are not responsible of any losses for anyone, our trades are profitable more for long terms and we take losses as everyone,
manage your lot size as well and your SL and TP
Don't forget to hit the like bottom and write a comment to support us.
Follow us for more 🙋🏻♂️
Best Regard / EMA Trading .
Disclaimer:
----------------
It's not a financial advise, As everyone we take losses sometime but for long term trading we are profitable traders, so manage your account well with SL and TP and your lot size to keep your account safe and stay in the market .
