EUR/JPY Technical Breakdown: Rising Wedge Breakdown + Target🔺 1. Rising Wedge Pattern Explained
A Rising Wedge is formed when:
Price action creates higher highs and higher lows, but
The slope of the support line is steeper than the resistance line.
This signals that buyers are losing strength, and momentum is fading.
In this chart:
The wedge began forming around mid-February 2025.
Price was compressing within converging trendlines.
After multiple failed breakouts near resistance (~165.50), the pair finally broke below the lower trendline, confirming a bearish breakout.
This pattern is considered reliable because it traps late buyers and shifts sentiment from bullish to bearish quickly once the lower boundary is breached.
🔻 2. Key Technical Zones
📌 Major Resistance Zone (~165.00 – 166.00)
Strong supply area; price has rejected here multiple times since late 2023.
Resistance was confirmed again during the wedge formation.
High volume spike noted near this level, followed by a steep drop—evidence of distribution and smart money exiting long positions.
📌 Major Support Zone (~156.00 – 157.00)
Historically held as a demand zone.
Previous bounces suggest it is structurally significant.
However, repeated tests can weaken the zone, increasing the likelihood of a breakdown.
🎯 Target Price: 153.433
Measured by taking the height of the wedge and projecting it from the breakout point.
Coincides with a previously tested level (support turned target).
Bears could aim for this level as a swing target.
📉 3. Market Psychology Behind the Pattern
As price climbs inside a rising wedge, volume often declines, showing buyer exhaustion.
False breakouts near the top of the wedge trap breakout traders, adding fuel to the downside move once price breaks the lower boundary.
The sharp selloff post-breakout is often driven by stop-loss cascades and aggressive short positioning.
🔁 4. Potential Price Path & Trade Plan
Retest in Progress: Price may retest the broken wedge support (now resistance) near 163.00–164.00 before further decline. This retest zone offers a high-probability short entry opportunity with tight risk management.
Immediate Downside Levels: 160.00 (psychological level), 157.00 (support zone), and final target at 153.43.
Bearish Continuation Scenario: If the pair maintains below the wedge and forms lower highs, it confirms ongoing bearish sentiment.
🛑 5. Risk Factors to Monitor
ECB or BOJ monetary policy shifts (rate cuts/hikes, yield curve control updates).
Risk-on vs risk-off flows, especially in times of geopolitical or macroeconomic shocks.
Intervention by the Bank of Japan to protect JPY from excessive weakening.
✅ Conclusion: A Tactical Short Opportunity
The EUR/JPY chart is setting up for a potential medium-term short swing trade following a confirmed rising wedge breakdown. With clear rejection from a long-standing resistance zone and fading bullish momentum, the technicals align for a move toward 153.43 over the coming weeks.
Traders should watch for clean retests and structure-based entries, managing risk around 164.50 with profit-taking at key support zones along the path.
Rising Wedge

EUR/USD Rising Wedge Breakdown – Bearish Opportunity in Sight🔍 Technical Breakdown
🟦 1. Rising Wedge Pattern (Bearish)
The price has been moving within a tightening upward channel — forming higher highs and higher lows, but with decreasing momentum. This is a typical Rising Wedge, a pattern that signals exhaustion in an uptrend and typically resolves to the downside.
The pattern formed over several days.
Volume has been declining as the price pushed higher — a classic sign of weakening trend strength.
🚨 2. Major Resistance Zone
The wedge culminated near a major historical resistance zone (around 1.1400), which price failed to break multiple times — showing strong seller presence. This adds confluence to the bearish breakdown.
📉 3. Breakdown & Retest
Price broke below the lower wedge trendline, confirming the bearish reversal. After the breakdown, the pair appears to be retesting the previous support line — now acting as new resistance.
This retest is crucial — a successful rejection here typically confirms the breakdown and provides an ideal entry point for short positions.
⚡ Volume Clues
Note the "Volume Burst" earlier in the chart, followed by a sharp move up. But that rally was unsustainable — buyers couldn’t hold above resistance, and volume has since faded. This volume exhaustion is further evidence that bullish momentum is weakening.
🔄 Key Support Zones Below
Around 1.1200: A strong SR flip zone (support-turned-resistance), which could act as temporary support.
Final Bearish Target: Around 1.1070, a strong demand zone where price previously consolidated before the last bullish run.
This is the measured move target from the wedge height applied to the breakdown point.
🧠 Why This Matters (Trader Insight)
This setup combines:
A reliable bearish pattern (rising wedge)
Key horizontal resistance
A volume drop
A clean retest structure
That makes it a high-confluence short trade idea. These patterns don't always play out immediately, but when they do, they often drop hard.
📌 Trade Setup Summary
Bias: Bearish
Pattern : Rising Wedge (broken)
Current Action: Retesting the broken wedge
Entry Zone: 1.135–1.138 (retest confirmation)
First Target: 1.1200 (SR Flip)
Final Target: 1.1070 (Demand Zone)
Invalidation: Break and hold above 1.1410

Bitcoin (BTC/USD) – Rising Wedge Pattern Signals & BreakdownThis chart illustrates a Rising Wedge Pattern on the weekly timeframe for Bitcoin (BTC/USD), which is generally considered a bearish reversal pattern in technical analysis. The pattern appears after a strong upward move and typically signals that the price is losing momentum and may be preparing for a significant correction.
📐 What is a Rising Wedge Pattern?
A rising wedge is a chart pattern formed when the price consolidates between two upward-sloping trendlines – the support line (bottom) and the resistance line (top) – with the two lines converging toward each other.
As price climbs higher, it forms higher highs and higher lows.
However, the slope of the highs is less steep than the slope of the lows, showing a loss of bullish strength.
Eventually, the price breaks below the support line, often leading to a sharp move downward.
🔍 Key Highlights from the Chart:
📌 1. Major Resistance Zone (~$110K–$120K):
BTC is currently facing heavy resistance in this area.
This zone has historically acted as a supply zone where bulls have struggled to break through.
Multiple rejection wicks indicate strong selling pressure.
📌 2. Pattern Touchpoints:
BTC has now formed multiple touchpoints on both the support and resistance lines of the wedge, confirming the structure.
This gives the pattern higher validity from a technical analysis perspective.
📌 3. SR Interchange Zone (~$65K–$70K):
This is a key horizontal zone where past resistance could act as future support.
A successful breakdown may first test this level before continuation.
📌 4. Retesting After Breakdown:
After breaking the wedge support, a retest of the broken trendline is often seen.
If the retest is rejected, it confirms the breakdown and opens the door to deeper bearish movement.
🎯 Target Projection:
If the wedge breaks down and the bearish scenario plays out, we could see Bitcoin fall to the $22,000–$25,000 region – marked as the final target zone on the chart. This level aligns with:
Previous macro-support zones from 2021
Fibonacci retracement levels
Psychological price levels where buyers may re-enter
⚠️ Bearish Factors to Watch:
Bearish divergence on indicators like RSI or MACD (not shown on chart but worth checking)
Volume decreasing as price rises – a classic wedge behavior
Macroeconomic headwinds or Bitcoin halving-related exhaustion
Rejection from major resistance with strong bearish candles
🕒 Timeframe & Patience:
This is a weekly chart, which means the pattern will play out over weeks or months, not days. Patience is key. A clear break, retest, and rejection would be the most reliable confirmation to expect further downside.
✅ Invalidation Scenario:
If BTC breaks above the wedge resistance line with strong bullish volume and holds above the $120K level, this bearish thesis becomes invalid.
In that case, BTC could enter price discovery mode, making new all-time highs.
💬 Final Thoughts:
This analysis is a technical outlook, not financial advice. Always use stop-loss strategies and manage your risk carefully. Market sentiment, news, and macro factors can quickly shift the scenario. However, from a purely technical standpoint, the rising wedge pattern is a powerful signal that should not be ignored.

$GOOGL the pattern is there, target $152, short setup.NASDAQ:GOOGL You tell me. This looks so ready to go back below $150. My target is $152. I am entering puts right now with a strike price of $150 for 6/20 starting at $1.33 entry. I will add some on a push towards $167-$168. I will give up if it pushes through or holds at $170. This just looks to good TECHNICALLY in my opinion. I will keep you updated. I am willing to watch this position go down 65% where I will consider selling; looking at price and time to expiration. We are not out of the weeds yet when it comes to political rhetoric regarding tariffs even though this name shouldn't be affected by such because it is software, nothing physical but when the idea of tariffs are spewed the market as a whole reacts in negatively.
WSL.

Rising Wedge Breakdown – Bearish Setup on Silver (XAGUSD)Silver (XAG/USD) is currently trading within a bearish rising wedge formation on the 8-hour timeframe, and the market structure is hinting at a potential reversal to the downside. The confluence of resistance zones, pattern anatomy, and historical price action all point to a high-probability short setup, especially if key support levels are breached.
📈 Pattern Analysis: Rising Wedge
A rising wedge is typically a bearish chart pattern that forms when price consolidates between two upward sloping trendlines. However, the upper trendline rises at a slower pace than the lower one—indicating decelerating bullish strength. It often precedes a bearish breakout, especially if volume decreases near the apex.
In this case, the wedge is forming just below a major resistance zone around the $34.00 area, adding weight to the bearish scenario.
🔹 Key Technical Levels :
🟥 Resistance Zone ($33.80–$34.80): Price has tested and rejected this area multiple times in recent weeks. It marks a clear liquidity zone where sellers are in control.
🟩 Support Zone ($29.50–$30.30): This zone has provided strong support in previous retracements. If broken, it may flip into resistance upon retest.
🟦 Retest Zone (~$31.00–$31.50): If the wedge breaks downward, price may retest this area—creating an opportunity for traders to enter short with better risk-reward.
🎯 Final Bearish Target : $26.85: This level is derived from the height of the wedge and prior demand zones, making it a strong target area in a fully played-out bearish move.
🧠 Market Structure & Sentiment:
Volume Analysis – Volume has been tapering off as the price squeezes within the wedge, which is a typical trait of rising wedges. A volume spike on breakdown would serve as confirmation.
Trend Analysis – While the overall trend in the medium term has been bullish, the weakening upward momentum suggests that buyers are losing strength, and sellers may regain control soon.
Rejection Candle s – Several recent candle wicks above the $33.50 zone show clear rejection and failure to close above, reinforcing the resistance level.
📊 Trade Plan (Educational Purposes Only):
Criteria Details
Bias Bearish (Rising Wedge Breakdown)
Entry Option 1 On breakdown of wedge + retest
Entry Option 2 Aggressive entry on breakdown candle close below $31.50
Stop Loss Above $33.80 (last resistance)
Take Profit 1 $30.00 (support zone)
Take Profit 2 $28.00 (partial exit)
Take Profit 3 $26.85 (final target)
📌 Trading Psychology Note:
Traders should remain patient and avoid entering prematurely. Let the pattern confirm itself with a clean break and retest. Risk management is critical—wedge patterns can also fake out before reversing hard.
🧾 Summary:
Silver is nearing the end of a rising wedge pattern, right under a heavy resistance zone. Historical behavior, weakening momentum, and classic wedge structure suggest a potential bearish reversal. A break below the wedge support and a retest around $31.00 could present a high-probability short trade setup targeting the $26.85 area.
Keep this chart on watch. A decisive move is likely coming soon.

XAUUSD – Rising Wedge Breakdown in Play? | Bearish Setup Alert🧠 Market Analysis
Gold (XAUUSD) has shown incredible bullish strength in recent months, driven by geopolitical tensions, inflation uncertainty, and increased demand for safe-haven assets. However, every trend experiences a pause or correction — and that’s where we may currently be.
📊 Pattern Overview: Rising Wedge Formation
One of the most prominent technical patterns right now is the Rising Wedge. This is a bearish reversal pattern that occurs when price action consolidates upwards in a narrowing range, indicating waning bullish momentum and an imminent breakdown.
In this chart:
We see a clear series of higher highs and higher lows, forming two converging trendlines.
The upper trendline acts as dynamic resistance, while the lower one has been supporting price until now.
The wedge has now broken to the downside, signaling the potential start of a new short-term downtrend.
🔍 Key Technical Elements Explained:
🔵 1. Major Resistance Zone
Marked in the blue rectangular box, this zone has acted as a historical pivot area — both as support and resistance in the past.
The market respected this zone multiple times.
Price action tends to hesitate or reverse in such regions due to large institutional order flows.
🧠 2. Black Mind Curve Resistance
Unlike flat trendlines, the "Black Mind Curve" represents a curved, psychological dynamic resistance — often based on market sentiment, Fibonacci arcs, or logarithmic regression.
It reflects the market’s natural rhythm and is respected due to the hidden behavior of algorithmic trading systems.
Price just rejected this resistance after touching it during the wedge formation — a strong bearish clue.
🔄 3. Retest in Progress
After breaking out of the rising wedge to the downside, price is now retesting the broken wedge support.
This is a common price behavior known as the “kiss of death” — a final tap before continuation.
If the price fails to reclaim this broken support zone, it confirms a bearish continuation is on the table.
🎯 Trade Plan: Entry, Target & Stop
Trade Element Details
Bias Bearish
Entry Idea On confirmation of retest rejection (e.g., bearish engulfing candle)
Stop Loss (SL) Above the recent high or resistance – near $3,413.58
Take Profit (TP) First major support near $3,153.70 (SR Interchange)
Risk-Reward Ratio Estimated between 1:2 to 1:3, depending on entry
🔥 Bonus Target: If momentum increases, an extended drop toward $3,100–$3,080 is possible — where deeper demand lies.
🧘♂️ Trading Psychology & Risk Management:
Let’s face it: Even the best setup can fail — which is why discipline is your edge.
Confirmation is Key: Never short just because of a pattern. Wait for structure + candlestick confirmation (e.g., bearish engulfing, shooting star, etc.).
Emotions Kill Accounts : Don’t let greed convince you to skip stop-losses or over-leverage.
Let Price Come to You: If you missed the perfect entry, don’t chase. The market always gives second chances.
🧠 Educational Insight : What Makes This Setup Powerful?
This setup is a confluence trade, meaning:
You’re not relying on one signal, but multiple confirmations:
Rising wedge (pattern-based)
Resistance zone (horizontal S&D)
Curved dynamic resistance (psychological + advanced trendline)
Retest + rejection behavior (price action)
These stacked layers of confirmation increase the probability of a successful trade.
📌 Final Thoughts:
Gold is showing all the technical signs of a short-term bearish correction, despite the broader bullish narrative. For smart traders, this is an opportunity to catch a swing short with a clear entry, stop, and target.
The key to winning here? Patience and confirmation.
You don’t have to predict the market — just react to it with logic and discipline. Let the setup unfold naturally, and let the trade come to you.
💬 What’s Your Take?
Are you shorting Gold here or waiting for more confirmation?
Have you used curved resistance lines before in your analysis?
Drop your thoughts below — and if this helped you, smash the like button, share with others, and follow me for more high-probability setups!

Bearish Reversal Confirmed – BTC Rising Wedge TrapBitcoin (BTCUSD) on the 1H timeframe is displaying a bearish reversal structure after failing to sustain a breakout above key resistance. The recent price action has formed a Rising Wedge Pattern, which typically precedes a downside correction, especially when formed near a key supply zone. Let’s break down the setup:
🔍 Technical Analysis Overview:
🔹 1. Rising Wedge Pattern (Bearish)
A rising wedge is visible near the top of the recent bullish impulse. This wedge is characterized by converging trendlines with higher highs and higher lows, but with diminishing momentum. It typically signals a weakening uptrend and a potential trend reversal or correction once price breaks below the lower wedge boundary.
The breakout to the downside has already begun, confirming bearish intent.
🔹 2. SR Interchange Zone
The blue zone marked in the chart represents a Support-Resistance Interchange (SR Flip). This was previously an area of consolidation and breakout, acting as a key decision zone. Price is expected to retest this zone after the wedge breakdown before continuing further down.
This creates a perfect "Break → Retest → Drop" scenario, often favored by institutional and swing traders.
🔹 3. Consolidation Structure
Before the wedge formation, Bitcoin was stuck in a prolonged consolidation phase. This type of ranging price action often accumulates orders before a breakout. Once broken, these zones serve as magnets for pullbacks or liquidity grabs, and are frequently retested.
🔹 4. Target Zone
The measured move from the rising wedge pattern points to a target near $101,617, which aligns with a previous structural low and a potential demand zone. This area could serve as the next major support level.
🎯 Trade Strategy & Setup:
Entry: After confirmation of breakdown and a clean retest of the SR zone.
Stop Loss (SL): Just above the wedge high and structural resistance (~$108,020).
Target (TP): $101,617 (downside projection based on wedge height and price structure).
📌 Risk-Reward Setup: 1:3+ possible if retest confirms.
🧠 Trader’s Insight:
This setup reflects a common smart-money behavior where price forms a bullish-looking structure (rising wedge), entices buyers, and then traps them with a swift breakdown. The SR retest provides a low-risk shorting opportunity. Patience is key — let price come to your level before entering.
🚨 Risk Note:
If BTC reclaims and holds above the $108,020 level, the bearish thesis may be invalidated. Always wait for confirmation before execution.

EUR/USD Short Opportunity – Rising Wedge + Retest + TargetThis technical setup on EUR/USD (1H timeframe) highlights a potential high-probability short opportunity based on a combination of price action, chart patterns, and key structural levels. The pair is showing signs of weakening bullish momentum and preparing for a bearish continuation.
🔎 1. Pattern Analysis: Rising Wedge Formation
The primary pattern visible is a Rising Wedge, which is traditionally a bearish reversal formation. It’s defined by:
Higher highs and higher lows, but both trendlines are converging, suggesting weakening bullish control.
Volume (not shown here) typically decreases within a rising wedge, further confirming a potential breakout.
This wedge formed after a previous sharp bullish recovery, acting as a continuation structure that often reverses.
In this case, the price formed multiple touches on both wedge boundaries, enhancing the reliability of the pattern.
🧱 2. Key Structural Zones:
Minor Resistance Zone (~1.1270–1.1285):
Clearly marked on the chart with a blue shaded zone.
Price has reacted from this level multiple times, validating it as a supply area.
The most recent attempt to break above this level failed, further confirming seller dominance.
Consolidation Zone (highlighted in yellow):
Prior to the wedge’s formation, price entered a consolidation phase.
Consolidation often precedes a breakout or a trend reversal. In this case, it provided a base for the rally that formed the wedge.
🔁 3. Breakout and Retest:
Price has broken below the lower support line of the rising wedge.
This breakout is a bearish signal and suggests the pair may now be ready for a stronger downside move.
The price appears to be retesting the broken wedge support, which is a classic confirmation move before continuation.
Retests of broken structures often offer low-risk, high-reward entry opportunities.
🎯 4. Trade Plan and Setup:
Entry Zone: Watch for bearish rejection or candle confirmation on the retest of the wedge support turned resistance.
Stop Loss (SL): Positioned just above the resistance zone, at 1.12887, protecting the trade against false breakouts or reversals.
Take Profit Levels:
TP1 – 1.10649: This level is a strong support zone based on previous price action and structural significance.
TP2 – 1.09670: The full measured move from the height of the wedge. This also aligns with historical support and psychological round number proximity (1.10).
🧠 5. Confluence Factors:
Technical Pattern: Rising wedge = bearish.
Support/Resistance: Multiple reactions to both the resistance zone and wedge trendlines confirm market memory.
Price Action: Break + retest = ideal entry confirmation.
Risk-Reward Ratio: Favorable, especially with conservative TP1 and aggressive TP2 levels.
Macro Context (optional): If posted during news week – potential USD strength based on rate expectations, NFP, or inflation.
⚠️ 6. Risk Management Tips:
Use a position size that aligns with your account risk tolerance (1–2% rule).
Wait for confirmation (bearish engulfing candle or rejection wick) before entering.
Always be prepared for invalidation. If price closes above the resistance zone, this idea is voided.

JPY/USD Rising Wedge Pattern Formed | Retest & Move To Target🧠 Overview:
The JPY/USD pair has recently exhibited a Rising Wedge Pattern, a classic technical formation known for its bearish implications. This pattern has developed over several days of bullish price action, showing diminishing bullish momentum as price action narrows.
The wedge is forming right beneath a minor resistance zone, increasing the likelihood of a potential rejection and breakdown. This setup is particularly noteworthy due to the multiple layers of confluence supporting the bearish bias.
🔍 Technical Breakdown:
📌 1. Rising Wedge Formation
A rising wedge is often considered a bearish reversal pattern, especially after a strong uptrend.
As seen on the chart, price is respecting both the upper and lower bounds of the wedge, but with a loss of bullish momentum, indicated by shallower highs.
This tightening price action hints at indecision and likely exhaustion from buyers.
📌 2. Minor Resistance Zone
Price has approached a previous structure high where strong selling interest was seen before.
This zone has already rejected price once, acting as a supply area.
The repeated failure to break above reinforces the strength of this resistance.
📌 3. SR Interchange (Support Turned Resistance)
Below the current price action, there's a well-defined Support-Resistance Flip Zone (SR Interchange).
Previously a strong demand area, this zone may now act as a new resistance if price breaks below and retests it.
This is a key area where sellers are likely to step in again.
📌 4. Break & Retest Structure
As price begins to break the lower wedge boundary, the next move we anticipate is a retest of the broken wedge trendline.
This retest, if confirmed by rejection candles (such as bearish engulfing or pin bars), would present an ideal entry opportunity for short positions.
🎯 Trade Plan & Price Levels:
💼 Bearish Scenario
Entry Point: Wait for a successful retest of the broken wedge line (confirmation via price action: bearish engulfing or pin bar).
Stop Loss: Above the recent swing high or above the wedge resistance (~0.006920).
Take Profit 1 (TP1): 0.006845 – First key support zone.
Take Profit 2 (TP2): 0.006807 – Next major support / liquidity zone.
🧩 Why This Setup Makes Sense:
✅ Multiple Confluences:
Bearish wedge structure = reversal pattern.
Resistance zone = psychological and technical rejection.
SR Interchange = confirms institutional selling interest.
Retest confirmation = high-probability entry.
Target zones = based on recent support levels and market structure.
🛑 Risk Management:
Risk-to-reward ratio favors short positions if executed after retest.
Avoid jumping in early — wait for confirmation.
Proper stop loss is key to avoiding false breakouts or premature entries.
📊 Summary:
This is a textbook bearish setup with strong technical backing. The rising wedge pattern, when combined with resistance and retest zones, offers a great shorting opportunity — assuming price respects the pattern. Patience will be crucial here; wait for the break, the retest, and the confirmation before entering.
🔔 What to Watch:
Price behavior near the lower wedge boundary.
Reaction on retest — do bulls defend or do bears take over?
Confirmation from volume or price action (engulfing candles, rejection wicks).
Any fundamental catalysts or USD-related news.
✍️ Final Thoughts:
This is a well-structured short setup on the JPY/USD 1H chart. Wedges often deceive with temporary breakouts before reversing hard — so discipline, timing, and confirmation will be key. If the market respects this technical structure, we could see a clean drop toward our projected targets.

CADJPY - Bearish Rising WedgeHello Traders !
The CADJPY price formed a rising wedge pattern.
The price broke the support line.
So, I expect a bearish move📉
_______________
TARGET: 103.655🎯

Rising wedge on SPY - Melt up? or Next leg down? Immediate Bias (Tomorrow):
Scenario 1 – Bullish Continuation (Low Probability unless there's a macro catalyst):
Breaks above ~$596–$598 cleanly
Retests that zone as support (watch 595.50 intraday)
Then targets:
600 psychological
604–608 upper resistance channel
Possible end-of-month blow-off top: 612–618
Scenario 2 – Pullback / Rejection (More Probable Setup):
Rejected at ~596–597 zone (which aligns with upper wedge resistance)
Breakdown below $590 intraday
Then targets:
587.80 EMA cluster (20/50)
If lost → 576.44 next EMA + demand level
Followed by major support at 565.87 / 563.43
🔥 Week Ahead Trade Plan (May 20–24)
✅ Bullish Possibility:
If NVDA earnings, FOMC minutes, or macro data surprise to the upside
Watch for breakout above the red wedge and hold above 600
Target range: 604 → 612 max upside
🚨 Bearish Scenario:
Wedge breakdown below ~$590
Momentum cracks down to:
587
576 (watch for bounce)
If panic selling → 565–563 (larger time frame buying zone)
Volume divergence and overbought EMAs support a potential cool-off.
📅 Monthly Projection (End of May):
If wedge breaks down → consolidation range between 563 – 587
If wedge breaks out → blow-off rally up to 612–620, but likely to fade quickly
Fed commentary and NVDA earnings on May 22 will be major catalysts
📌 Key Levels
Type Price Notes
Resistance (R3) 612–618 Final upside blow-off zone (channel top)
Resistance (R2) 604 Overhead channel line
Resistance (R1) 595–598 Wedge top + major resistance
Support (S1) 587 EMA cluster + strong local demand
Support (S2) 576 Clean structure + prior breakout
Support (S3) 565–563 Confluence of long-term EMAs + trendline
🎯 Trade Setups
📉 Bearish (Favored if no breakout tomorrow):
Short 595–597 with stop above 600
Targets: 587 → 576
Optional: Add below wedge break (~590)
📈 Bullish (Confirmation-based):
Break + retest of 597–600
Target: 604, then scale out at 612
Avoid front-running long unless you see volume + price close outside wedge

ES1! (S&P500 Mini Futures) - Support Trendline Price Test -DailyES1! (S&P500 Mini Futures) price is currently testing a support trendline around $5900.
If several daily Price candles close below $5865 this month, a pullback in the price can occur (rising wedge pattern).
Volume has been decreasing in May 2025, compared to March and April.
Finance and Technology corporate earnings season has passed. The U.S. government 90-day tariff pause is set to expire in early July (pending trade deal negotiations with other countries).
Tariff and trade deal news, breaking news, corporate earnings, government law changes, consumer sentiment, inflation data, the FOMC, and presidential announcements can all affect the prices of stocks and ETFs.

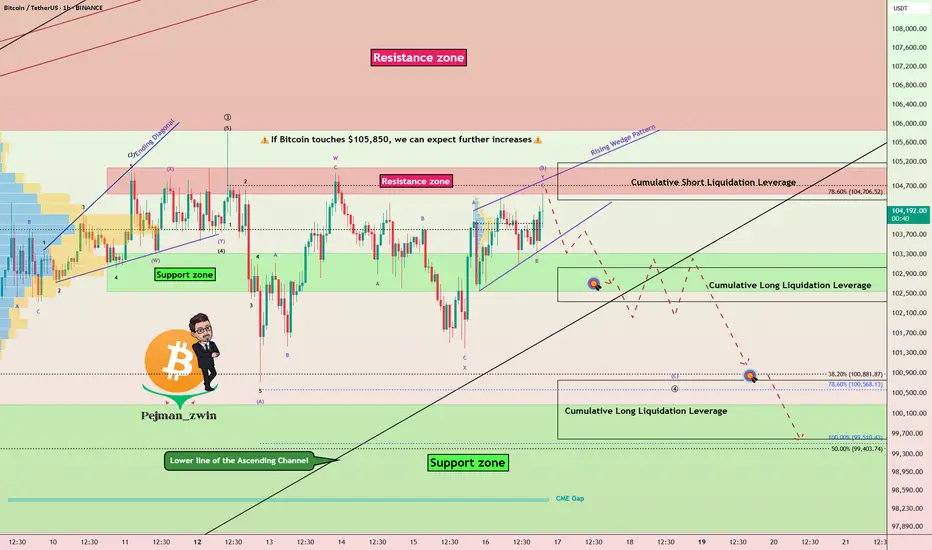
Bitcoin at Resistance With Weak Momentum-Bearish SetupBitcoin ( BINANCE:BTCUSDT ) finally reached the Resistance zone($105,100-$104,520) as I expected yesterday. Of course, the way Bitcoin reached the resistance zone was NOT with high momentum , so I decided to share this analysis with you.
In terms of Classic Technical Analysis , Bitcoin appears to have formed a Rising Wedge Reversal Pattern between Support zone($103,320-$102,600) and Resistance zone($105,100-$104,520) over the past few hours .
In terms of Elliott Wave theory , given Bitcoin’s low momentum and the Heavy Cumulative Short Liquidation Leverage($105,180-$104,412) ahead of Bitcoin, it appears that Bitcoin has completed microwave B of the main wave 4 with a Double Three Correction(WXY) .
I expect Bitcoin to decline to at least $102,800 at the first target AFTER breaking the lower line of the Rising Wedge Pattern, and if the Support zone($103,320-$102,600) and lower line of the ascending channel(Major) are broken, we should expect a drop to Cumulative Short Liquidation Leverage($100,763-$99,600) .
Note: If Bitcoin touches $105,850, we can expect further increases.
Please respect each other's ideas and express them politely if you agree or disagree.
Bitcoin Analyze (BTCUSDT), 1-hour time frame.
Be sure to follow the updated ideas.
Do not forget to put a Stop loss for your positions (For every position you want to open).
Please follow your strategy and updates; this is just my Idea, and I will gladly see your ideas in this post.
Please do not forget the ✅' like '✅ button 🙏😊 & Share it with your friends; thanks, and Trade safe.
#BTC Dominance Update – Key Levels in Play!🚀 Hey Traders! 👋
If you’re finding value in this analysis, smash that 👍 and hit Follow for high-accuracy trade setups that actually deliver! 💹🔥
Bitcoin dominance ( CRYPTOCAP:BTC.D ) is trading inside a beautifully defined rising channel on the 4H chart.
📈 What’s unfolding?
✔ Strong support holds at the lower channel line (marked by green arrows)
✔ Bounce potential toward the upper channel resistance (~65%)
✔ Expect possible rejection there, followed by another retest of support
💥 Why this matters:
✅ BTC dominance drives altcoin sentiment
✅ Rising dominance → pressure on altcoins
✅ Watch for a breakdown below support → potential altcoin relief rally
⚙ Key Takeaway:
Monitor this channel carefully. If dominance breaks below support, alts could gain momentum. If it bounces, BTC will continue to lead.
💬 Drop your thoughts in the comments — are you betting on BTC or alts next? 🚀👇

VIRTUALUSDT → Rebound from resistance. Trend break, U-turn?BINANCE:VIRTUALUSDT.P is pausing within an uptrend and forming a range within which signals of a possible reversal and decline are appearing.
Bitcoin is pausing its rally and moving into correction. This is a negative development for altcoins, which will not grow without the flagship.
VIRTUAL is consolidating, but pressure is building in the market (as can be seen from the cascade of resistance levels within the range). Another prerequisite for a breakdown of the market structure is a downward exit from the upward channel (a break of the trend support). Another retest of support at 1.581 could trigger a breakout and a fall. There is a fairly free zone below, and the nearest target is located in the 1.178 zone.
Resistance levels: 1.72, 1.829
Support levels: 1.581, 1.416, 1.178
Focus on the current range of 1.581 - 1.829. The chart shows that the price continues to storm and test support, which is an important signal against the backdrop of a broken uptrend. A break of support at 1.581 and consolidation below this level could trigger liquidation and a fall to the fvg zone or the liquidity zone at 1.178.
Best regards, R. Linda!

NZDCHF → The global bearish trend may continueFX:NZDCHF has been within a local upward wedge pattern for a long time. A breakout of support could trigger a continuation of the downtrend.
After breaking through the wedge support, the currency pair is one step away from the start of the realization. The focus is on consolidation at 0.4982 - 0.4919. A breakout of support could trigger a decline in the currency pair amid a weakening NZD and a rising dollar index, which overall creates a negative backdrop for the pair.
A retest of the previously broken boundary of the figure or resistance at 0.4953 is possible before the decline continues, but a consolidation of the price below 0.4918 will be a good signal for the start of the movement.
Resistance levels: 0.4953, 0.4981
Support levels: 0.4918, 0.4872
Trend pressure plays an important role, as does the fact that the price is coming out of a wedge consolidation. The breakout is directed towards the main trend, and price consolidation below the key support will only confirm this.
Best regards, R. Linda!

Failed Breakout + Rising Wedge = Bearish Signal for Bitcoin!?Bitcoin ( BINANCE:BTCUSDT ) attacked the Resistance zone ($87,520-$85,840) and the important Resistance line as I expected in yesterday's idea , but it seems that it failed to break .
Bitcoin is moving between two Support and Resistance zones .
From a Classic Technical Analysis , Bitcoin appears to have formed a Rising Wedge Pattern .
From an Elliott Wave theory , Bitcoin appears to have completed a main wave 5 on the 1-hour time frame .
Also, we can see the Regular Divergence(RD-) between Consecutive Peaks .
If we look at the Bitcoin chart in the 4-hour timeframe , a Shooting Star Candlestick Pattern with high volume is clearly visible near the Resistance zone ($87,520-$85,840 ), which could signal a reversal and decline in Bitcoin .
I expect Bitcoin to start declining again after an upward correction and break the lower line of the rising wedge pattern , and reach the targets I have indicated on the chart.
Cumulative Short Liquidation Leverage: $87,708-$86,487
Cumulative Long Liquidation Leverage: $84,520-$83,687
Do you think Bitcoin can finally break the important resistance line? I would like to hear your thoughts.
Note: If Bitcoin breaks above the Resistance zone ($87,520-$85,840), we can expect a pump.
Note: If Bitcoin falls below $81,000, we can expect further declines.
Please respect each other's ideas and express them politely if you agree or disagree.
Bitcoin Analyze (BTCUSDT), 1-hour time frame.
Be sure to follow the updated ideas.
Do not forget to put a Stop loss for your positions (For every position you want to open).
Please follow your strategy and updates; this is just my Idea, and I will gladly see your ideas in this post.
Please do not forget the ✅' like '✅ button 🙏😊 & Share it with your friends; thanks, and Trade safe.

GOLD → Countertrend correction. What to do in this case?FX:XAUUSD , after a bull run, bumps into strong limit resistance at 3244 and enters a correction phase, which is generally a logical maneuver amid strong gains.
Gold corrects from Friday's record $3,245 and moves back to $3,200 amid improving market sentiment and progress in trade talks. The price pared gains after a strong weekly rally, reacting to U.S. concessions on tariffs on Chinese electronics and China's pledges to boost economic stimulus. Additional influences come from the dialog between the US and Iran, as well as the anticipation of China's GDP and trade data for March. Despite the pullback, downside may be limited due to ongoing uncertainty.
Technically, it is worth looking at the 3187 - 3167 conglomerate of support, which can stop (temporarily or even turn the price upward) a strong and sharp decline, as the fundamental backdrop within the tariff war is still tense.
Resistance levels: 3244, 3270
Support levels: 3187, 3174, 3167
The rally is temporarily halted, but there is no talk of a trend reversal, as the tariff war fire is still burning, Trump or Xi Jinping may add to the fire....
Within the framework of counter-trend correction, the emphasis is on the support of 3187, 3174, 3167 from which we can trade a false breakdown and catch the price rebound.
Regards R. Linda!

#BTCUSDT shows signs of reversal📉 SHORT BYBIT:BTCUSDT.P from $82,125.0
🛡 Stop loss: $82,976.0
🕒 Timeframe: 4H
✅ Overview:
➡️ The BYBIT:BTCUSDT.P chart shows a rising wedge — a typical bearish pattern.
➡️ Price hit the upper wedge boundary and started to decline, breaking support.
➡️ A second top (Top 2) has formed on weakening volume, signaling a possible reversal.
➡️ The POC at $82,490.8 has been broken — price is holding below it, strengthening the bearish case.
🎯 TP Targets:
💎 TP 1: $81,430.0
💎 TP 2: $80,887.0
💎 TP 3: $80,485.0
📢 Additional scenario notes:
📢 Entry activates upon breakdown and consolidation below $82,125.
📢 Watch for increased volume at key TP levels for confirmation.
📢 A move above $82,976.0 invalidates the setup — stop placed just above key resistance and wedge top.
🚀 BYBIT:BTCUSDT.P shows signs of reversal — a corrective move to the downside is expected.

DJI - Rising Wedge + Double TopDJI showing a rising wedge which is a bearish pattern on this Daily chart
Also right before the prior down movement is a double top in red
Breakdown further out of this rising wedge pattern

Downside Risk Grows for NZD/USD After Structure FailThe NZD/USD pair has broken down from a well-defined rising wedge pattern, signaling a shift in short-to-medium term momentum. After trending within this rising structure for several weeks, price has now decisively violated the lower trendline, confirming a bearish breakout. The move coincides with a sharp rejection near the 200 EMA, which continues to act as dynamic resistance overhead.
Price is now hovering around a key support zone between 0.555 and 0.558 — a level that has historically served as a pivot point. The breakdown is also supported by a clear bearish RSI divergence, where price made higher highs while RSI formed lower highs, indicating weakening momentum. Currently, the RSI sits at around 32.47, approaching oversold territory but not yet showing signs of bullish reversal.
If the current support zone fails to hold, we could see further downside pressure, potentially driving the pair toward the next major support region near 0.548–0.540. On the other hand, if buyers step in and absorb the sell-off at these levels, a relief bounce toward the broken trendline or the 200 EMA could be expected — though such a move may face strong resistance.

EUR/GBP (1H) – Rising Wedge Breakdown & Short Trade Setup1. Overview of Market Structure
The EUR/GBP pair is forming a Rising Wedge Pattern, a well-known bearish reversal formation, which suggests that the current uptrend may soon reverse into a downtrend. The price has been moving within a tightening range, making higher highs and higher lows, but the upward momentum appears to be weakening.
A breakdown from this wedge is a strong bearish signal, indicating that sellers are gaining control, and a significant price drop is expected.
2. Chart Pattern: Rising Wedge – Bearish Reversal
A Rising Wedge is a pattern that occurs when price moves upward within a contracting range. This pattern typically forms after an uptrend and suggests that bullish momentum is slowing down.
Characteristics of the Rising Wedge in This Chart:
The price has tested the upper resistance zone multiple times, but each attempt has resulted in a rejection.
The lower support trendline has been tested frequently, showing that buyers are losing strength.
The breakdown of the wedge signals a strong bearish move, with price expected to drop toward key support levels.
This pattern becomes valid once the price breaks below the lower trendline, confirming the bearish outlook.
3. Key Technical Levels & Zones
A. Resistance Zone (0.84853) – Strong Supply Area
Marked as a Resistance Zone, where price has struggled to break through.
Sellers have stepped in around this level multiple times, preventing any further bullish movement.
Acts as a major stop-loss level for bearish trades, as a breakout above this zone could invalidate the setup.
B. Support Zones (Potential Take-Profit Targets)
1st Support Level (TP1) – 0.82539
This level has previously acted as strong support, where buyers have entered the market before.
A short-term pullback or consolidation may occur here.
2nd Support Level (TP2) – 0.81332
This is the final bearish target, marking a key demand zone from where price has bounced in the past.
If bearish momentum continues, price could reach this level, making it an ideal take-profit zone for swing traders.
4. Trading Strategy & Execution
A. Entry Strategy
A short trade is ideal after the price breaks below the rising wedge pattern. There are two possible entries:
Aggressive Entry:
Enter immediately after the breakout of the lower trendline, anticipating strong downside momentum.
Higher risk as price might retest the trendline before moving down.
Conservative Entry:
Wait for a retest of the broken trendline before entering short.
This confirms the breakdown, reducing false breakout risks.
B. Stop-Loss Placement
Stop-loss should be placed just above the resistance zone (0.84853).
This prevents being stopped out by minor pullbacks before the actual move happens.
C. Take-Profit Targets
TP1: 0.82539 (First major support level – potential profit booking area)
TP2: 0.81332 (Final bearish target – strong demand zone)
5. Risk Management & Trade Management
Risk-to-Reward Ratio (RRR)
This trade offers a high RRR, making it an attractive setup.
The stop-loss is small compared to the potential downside move.
Trailing Stop Strategy
A trailing stop can be used to lock in profits as price moves lower.
If price reaches TP1, move stop-loss to breakeven to secure capital.
If price reaches TP2, close the trade for maximum profit.
Exit Strategy
Exit early if price fails to break key support zones.
Monitor price action around TP1 & TP2 for signs of reversal.
6. Sentiment Analysis & Market Context
Bearish Confirmation:
Breakdown from the wedge signals bearish sentiment in the market.
If price fails to sustain above support zones, further downside is likely.
News & Fundamentals:
Major economic events or interest rate decisions could impact EUR/GBP volatility.
Traders should check for UK & Eurozone news before entering the trade.
7. Conclusion – Bearish Outlook
The Rising Wedge breakdown is a strong short-selling opportunity.
Confirmation is key: Enter short after the breakdown, use proper risk management, and aim for TP1 & TP2.
If price invalidates the pattern by breaking above 0.84853, the trade setup should be reconsidered.
This setup provides a high-probability bearish trade with a well-defined stop-loss and risk-to-reward ratio.

JPY/USD – Rising Wedge Breakdown & Bearish Trading Setup1. Market Structure & Technical Pattern:
The Japanese Yen (JPY) against the U.S. Dollar (USD) has been exhibiting a clear Rising Wedge Pattern over the past few months. This is a classic bearish reversal pattern, indicating that buying momentum is gradually weakening, and a strong decline is likely to follow.
Formation of the Rising Wedge:
The price has been making higher highs and higher lows, confined within two converging trendlines (black lines).
The lower boundary (support trendline) has been consistently acting as a dynamic support level.
The upper boundary (resistance trendline) has been limiting further upward movement, indicating exhaustion of buying pressure.
Breakout Confirmation:
The price action tested the resistance zone multiple times but failed to sustain bullish momentum.
A strong rejection from the upper resistance level led to a sharp sell-off, causing a breakdown of the support trendline.
Once the price broke below the wedge, selling pressure intensified, confirming the trend reversal.
2. Key Technical Levels & Zones:
Resistance Level (0.006895):
The price previously struggled to break above this resistance zone, forming a strong supply area where sellers dominated.
This level aligns with the upper boundary of the rising wedge, making it a significant turning point.
The rejection from this zone initiated the bearish breakdown.
Support Level (Broken – 0.006650):
This level acted as a strong demand zone, preventing further downside movement during the wedge formation.
However, once the price broke below this level, it confirmed the end of the uptrend and the beginning of a downtrend.
This level may now act as a new resistance (role reversal principle).
Stop Loss Placement (Above 0.006895):
A logical stop-loss is placed just above the resistance level to protect against a potential invalidation of the bearish setup.
If the price closes above this level, the bearish thesis would be invalidated.
3. Trading Execution & Risk Management:
Sell Entry Strategy:
Traders looking for short positions should enter after a confirmed break below the wedge’s support.
A potential pullback (retest) to the broken trendline could offer an additional shorting opportunity.
The retest would confirm the previous support turning into resistance before a continuation of the downtrend.
Take Profit Targets (TP1 & TP2):
TP1 (0.006481):
This level represents a strong demand zone where short-term buyers may step in.
Traders may choose to book partial profits here.
TP2 (0.006251):
This is a deeper support level and the final target for this trade setup.
If the price sustains bearish momentum, it is likely to reach this level before stabilizing.
Risk-to-Reward Ratio Consideration:
This setup offers a high probability short trade with an attractive risk-to-reward ratio.
The stop-loss is well-defined, minimizing potential losses while maximizing profit potential.
4. Expected Price Movement & Projection:
Short-term Outlook:
A possible pullback to the broken wedge (previous support now acting as resistance) before continuation lower.
If the price retests and rejects the 0.006650 level, expect acceleration in the downtrend.
Medium-term Outlook:
If the price reaches TP1 (0.006481) and breaks below, it increases the probability of hitting TP2 (0.006251).
A bearish trend continuation could form, potentially leading to further downside levels.
Invalidation Scenario:
If the price closes above the stop-loss level (0.006895), the bearish setup is invalidated, and a bullish breakout could follow instead.
5. Conclusion & Trading Plan:
The rising wedge breakdown signals a shift from bullish to bearish market sentiment.
Traders should look for short entries after a confirmed breakdown or wait for a pullback before executing trades.
The risk-to-reward ratio makes this a strong high-probability trade setup.
Following the plan with strict stop-loss placement ensures risk is controlled while maximizing profit potential.
6. Summary & Key Takeaways:
✅ Pattern: Rising Wedge (Bearish Reversal)
✅ Breakout Direction: Downside
✅ Resistance Level: 0.006895
✅ Support Levels: 0.006650 (broken), 0.006481 (TP1), 0.006251 (TP2)
✅ Stop-Loss Placement: Above 0.006895
✅ Profit Targets: TP1 – 0.006481, TP2 – 0.006251
✅ Trade Bias: Bearish
