Daily review of ETH interval 1HHello everyone, I invite you to a quick update of the situation of ETH to USDT on the 1H interval.
As we can see, we have formed a Rising Wedge pattern, which unfortunately is characterized by an exit from the bottom.
We can use the current situation to play the position, for this purpose we will mark the Stop Loss at $1618, which should be taken into account when playing short.
Entering positions in the area of the formation or just after leaving the formation at the bottom at $1525.
However, the target that can be taken into account is $ 1434.
Rising Wedge

Going Short on AUDUSDRising wedge pattern could indicate a reversal, also a potential rise for DXY could have a strong influence.
Rising wedge Gold sell setupGold has been exremely bullish in the past, the rsi is at overbought on the daily timeframe which is in line with the rising flag. Wait for a breakout and ride it down 🤑

Btc in rising wedgeBtc in rising wedge pattern could break out to the upper side but i think it will go down to 18700 usd

BTC - 4h - rising wedgeJust a first idea after the pump
The wedge is already visible
Volumen is go lower
COULD go a bit higher, so maybe not finished at this point
Start shorting here


Harmonic & Rising Wedge on SolanaBINANCE:SOLUSD
Harmonic Pattern observed with mixture of Bat & Gartley measurements.
Rising Wedge Pattern showing bearish pattern of BINANCE:SOLUSD

rising wedge semiconductor longshort semiconductors are on the verge of breaking down, and basically if we stay over 12.20 soxl im aiming for daily gap close, or near 12.86 . if we break this ascending tightening range to the downside and more or less double top 4hr resisting from top of envelope, around 12.30s or lower, im looking toward 15 minutes demand zone in low 11s maybe 11.30. short squeeze in semiconductors, or failed bull breakout. even if longs win, im selling rallies on the daily by buying soxs on dips to weekly lows, or new weekly lows (keeping in mind the s&p can still resist from 4000 or slightly higher/nvda can sell off $160, 162.5, 165).

Bone Shibaswap: Rising Wedge with Stoppage SupplyBONE is looking like it may retrace after scoring some nice gains. As I shared with my group: the rising spread is narrowing, volume showing signs of supply build after failures to rally in demand at key micro resistance points. One more potential rally may be in store, but this could be a false one if it breaks structure. Ultimately, I project the price falling back down to mitigate the lower retracement levels. If you're long in BONE, please make sure to take profit especially if you intend to milk the PA all the way to the wedge's confluence.
If you have strong hands, patience, and like scoring big wins, be sure to SUBSCRIBE to this channel. Here's why: I track all USD-paired cryptocurrencies on all the major CEXs and seek out the most lucrative swing trades. All my charts are clean and easy-to-follow with exceptional win rates ranging consistently between 80-85%. My TA is based off a combination of Wyckoff Volume Spread & Fibonacci Ratios. Stop getting smashed and start winning in crypto. My charts will teach you how.
*Not a financial advisor. Trade at your own risk.

CADCHF: Long from supportIts evident that Price action is respecting Fib Lvl 23.6% and presence of Rising wedge states a bullish momentum is possible. Series of Higher Highs and Lower low also support this theory.
Strategy is Long

gala possible toprising wedge formation and 1d stoch overbought.
good risk to reward ratio, stop loss 0.42
but be careful, China second largest world economy is open, shorting coins now is very bad behavior

PSLV - Taking ProfitsPSLV weekly and daily charts looking a bit extended = time to book some profits. Will leave a little sprinkle on to run just in case - but mostly move to cash and re-enter after a pull-back.
For longer term timeframes I expect that silver will continue to move up …eventually, but likely needs to cool off first. COPX also looking topping here...and copper usually leads the metals complex. Maybe this time is different - but probably not.
NFA

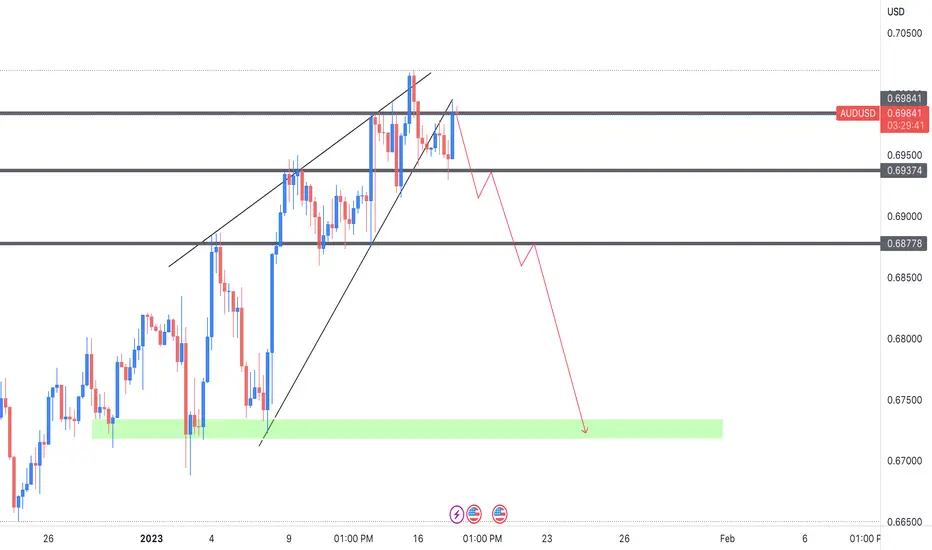
AUDUSD - Rising Wedge Bearish PotentialAs we can see AUDUSD formed a rising wedge and broke the structure of it pointing the pair to the downside. To further this bearish sentiment AUDUSD also rejected a key FIB level @78.6 after breaking structure and retracing.
Usually this is a great indication we may be in the 3rd wave of the Elliott Wave Theory which should be followed by a great impulse downward.
I set this idea to be invalid if price continues upward around 0.68750 with setting take profit at 0.66100 and 0.64656
If you would like to see updates on this idea and many more please follow and hit the like button for more!

1INCHUSDT CAN BREAK UP- Daily Timeframe1INCHusdt ready for potential break up
volume increasing
RSI diversion
OVERSOLD from long time
BB squeeze
wait for the confirmaion
i will update the stop loss/entry and exit once confirmed.

Forget about chart patterns! Hello, my dear friends and happy New Year!
I wish you to be healthy and reach all your goals in trading and not only! Never give up on this difficult way which we are going to overcome together!
Today we have a very important topic. How to use Elliott waves instead of classical chart patterns. This is the natural exposure why the chart patterns are garbage. I remember my third year at university when we have the trading lessons. Our teacher gave us a lot of useless knowledges about support, resistance and chart patterns. I have not understood why it should working and it was not soo intereting subject for me. That’s why I returned back to trading much later using self-education. Now I have the clear understanding why Elliott waves is the best tool and why it’s working. Most of traders even don’t understand that chart patterns is just the special case of Elliott waves. That’s why today I decided to explain you how you can change the first one to the second one. Let’s go!
Double Top(Bottom)
On the chart above I drew the different types of double tops. Generally we have 3 types of this pattern
Double top with the second top higher than the first one. In this case we can interpret it in two ways. It could be the classical waves 3, 4, 5 and the corrective wave A at the ending stage. In this case we can anticipate waves B and C. Also it could be the irregular correcton ABC inside wave 4 (rarely in wave 2). In this case we should wait for the wave 5 after that. Traders usually execute short position on the neckline breakdown and suffer when the wave 5 smashed their stop-loss. They are wondering why double top does not working.
Double top with the equal highs has the same possible outcomes. The only one difference that correction called flat instead of irregular.
Double top with the second top lower than the first one. Here is the most common variant is the end of the ABC correction. In this case we have the low potential for shorting the market becuase the new impulsive wave to the upside can hit all stop losses.
Head & Shoulders
This is the easiest pattern for analysis. The right sholder usually is the wave 4, the head, obviously is the wave 5 and the right shoulder is the wave B. On the neckline breakdown we have the shorting potential only in the rest part of the wave C. You could correctly count waves and short that the bearish reversal bar of the wave 5 or, as a last resort, at wave B potential top. Shorting at the neckline has sence only if you are sure that the wave B was the the wave 1 of the impulsive wave to the downside if higher degree and now the market is in wave 3. We have to learn how to count waves in a correct way. I would recommend you to read the Trading Chaos book by Bill Williams because it has the best explanation how do waves work.
Triangles and Wedges
This part is common for all types of triangles (ascending, descending, symmetrical) and wedges (falling and rising). This patterns have the similar structure. If we faced with one of these patterns we have 4 possible scenarios.
Triangle in the downtrend after the wave 3. In this case triangle is the wave 4, which is represented as the triangle correction. This correction type consists of 5 waves A, B, C, D and E. When the wave E is finished market will continue it’s move in the direction of a trend, printing the wave 5.
The same, but in the uptrend.
When the market showed us the 5 waves cycle to the upside and the correction is in progress. Triangle can appears in the wave B. In this case the price will continue the corrective move in the wave C after it’s finished.
The same with the downtrend.
Guys, of course there are much more types of chart patterns. For example, tripple tops and bottoms and so on. The purpose of this article is giving you another view of the market structure and to motivate you studying the Elliott waves theory. Believe me, it has much more potential than it seems on the first glimplse.
Best regards, Ivan
________________________________________________________________________________________________
If you like my educational ideas, please smash the boost button to stimulate me make more quality articles!

Gold- Rising Wedge Bearish Potential As we can see Gold is forming a rising wedge as shown on the 4H chart. This also aligns with an impulse Elliott Wave pattern, along with some nice wicks bouncing off of the 1830s resistance level indicating bulls may be letting up.
It seems Gold may be ready for a push to the down side with the confirmation of breaking out of the wedge.
With breaking out we can see a retrace to the common FIB levels of 0.5 which is around 1725 and 0.618 which is around 1699. Around these levels we will likely see a bullsh scenario afterwards, but will have to wait and see what the market has in store.
If you would like to see updates on this idea and many more please follow and hit the like button for more!

USDJPY | Perspective for the new week | follow-up detailsDespite missing out on the initial bearish move on Tuesday, we were still able to close the week on a profitable note with about 700 pips in total (see link below for reference purposes). The outcome from last week indicates that the U.S. dollar continues to plunge hereby handing back some of the previous session’s gains as participants attempt to gauge the Federal Reserve’s likely tightening path in the new year. And with BoJ's governor's speech coming up early in the new week, there might be fresh hopes for the US Dollar. In this video, we identified the 131.000 level as a critical point that has a memory for buying power. So, in the new week, we shall be using this zone as a yardstick for trading opportunities.
Disclaimer:
Margin trading in the foreign exchange market (including commodity trading, CFDs, stocks etc.) has a high risk and is not suitable for all investors. The content of this speculation (including all data) is organized and published by me for the sole purpose of education and assistance in making independent investment decisions. All information herein is for your reference only and I take no responsibility.
You are hereby advised to carefully consider your investment experience, financial situation, investment objective, risk tolerance level, and consult your independent financial adviser as to the suitability of your situation prior to making any investment.
I do not guarantee its accuracy and is not liable for any loss or damage which may result directly or indirectly from such content or the receipt of any instruction or notification therewith.
Past performance is not necessarily indicative of future results.

GOLD - This is brutal, no one expected it!
Don't be surprised if you wake up in the morning to see a massive red dildo on the gold chart breaking down the wedge. In my opinion, it's very likely.
GOLD is absolutely ready for a massive downtrend; it's going to happen very soon, so I hope you are prepared for it!
We can clearly see a rising wedge on the 4h / daily charts, which is also an ending diagonal wedge from the Elliott Wave perspective. This indicates that the bulls are losing steam.
The question now is, "How deep is the retracement going to be?" First of all, we should completely wipe out the wedge and also test the unfilled GAP, which is at the 0.618 FIB retracement. There is a parallel channel projection, so this is a good level to profit from your shorts.
I marked this whole uptrend as an impulse Elliott wave pattern, which suggests that gold can potentially go much higher later next year. This is my bullish scenario, I also have a bearish scenario, that I will post sometimes, maybe in January, so follow me and hit the like!
Maybe gold will be a good hedge against the upcoming recession. I think the bull market on the dollar is not over yet, and we are going to see new highs on the DXY index.
Thank you, and have a good one!

Vertex - rising wedge patternWhat we can see in the chart is a rising wedge pattern. We expect the price to break down from the rising wedge formation.
It may take a little bit more time since the price is still consolidating inside the wedge.
You should enter short position when/if the price breaks down of the wedge with a volume surge.
Do not forget to put a stop loss once you enter the trade.
Stop loss should be placed above the wedge.

XAUUSD might fall below...Gold is trading within a RISING WEDGE pattern.
After its rejection to 1824 yesterday, it might give us a new low if it breaks down below the structure around 1785.
It might expose the support around 1766-1745.
However, if the bulls take over again, it might bounce up and breaks the upper limit which could potentially went up to 1830-1850.
Great setup and patience is the key.

Xauusd ! Gold is broke rising wedge, short trade ideaThe rising wedge — also called an ascending wedge — is a bearish reversal pattern. This means that after the pattern completes, you can expect the market to reverse direction.
Confirming rising wedge.
1. Choppy and overlapping waves
2. Higher highs and higher lows
3. An upward sloping resistance trend line
4. An upward sloping support trend line
5. Resistance and support trend lines that converge and intersect when extrapolated
Divergence with an Oscillator, Volume Tends to Fall,
Oscillator divergence is created when the price makes a higher high, yet the oscillator makes a lower high.
Price action
The price of gold has broken the 1800 support level and is looking to pullback. Wait for bearish momentum candles then go to open short.

Short opportunityAs per Price Action we can See the Price has Broke Down the Recent Support, So if Price Sustains Below and give us a Valid Retest we can go for Short and our Target will be Next level.

Microsoft - 2016 Trendline is breaking down! 43% CRASH.
First Netflix, then META, TSLA, and now MSFT!
The major trendline from 2016 is breaking down with a successful retest. This is not looking good.
MSFT is still pretty strong compared to others, but the question is how long it can last.
The next support is the base trendline from 2009. In this case, a 43% crash is possible. I don't see any good, strong support above the trendline.
If we take a look at the MACD indicator, we can see that the histogram is very negative for the first time in a long time. It clearly broke the major uptrend.
As per my Elliott Wave analysis, this whole uptrend is done. MSFT's uptrend was brutal, as it always is, but the impulse wave has been completed. Now we are looking for a retracement.
The previous all-time high from 2000 is pretty much the worst-case scenario, just in case it starts to free fall like META. Buying Microsoft on this support is a once-in-a-lifetime opportunity.
We are experiencing a historical crash in stocks and crypto. A lot of investors get rekt and it will be even worse. Great to be alive or not? :D
I am not here to spread negativity, but I cannot pretend that everything is bullish. I don't want anyone to lose money with bad investments, but when the big players decide to crash the market, no problem for them.
Thank you.
