Bearish Thesis Bitcoin to 20800-then drop to 18500 WIP (Short)Elliot Wave continuing from the drop from 25200, ABCDE. Rising Wedge to about 20750-850 (not exact), then a drop from there to 18400-600 as measured from the last drop. Not a guarantee. I haven't entered a short, I might take a swing with my hedge account. Work-In-Progress. This doesn't mean, "short now" but for traders that already have established shorts from higher levels, this would add to the "hold your shorts" argument. I might set some very small sell stops on my hedge account with very little risk. I'd be placing stops a few hundred above just in case. I would also be taking healthy profits in my very light long position on my main account if we approach this level, but that is already a given. Also 18400 would not necessarily be the stopping point for the drop, as it is simply a measured move based on the last one that played out.
A secondary target might actually be to "sweep the lows" of 17600... implying at least a few hundred below that, or possibly thousands depending on catalysts, positioning, and where everyone's stops are placed.
Rising Wedge

Silver Micro trade setupIt is rising wage pattern a bearish continuation pattern. Most probablity is to break down side and continue bearish trend.

BTC PERSONAL ANALYSIS IN THE SHORT TERM (RAIN OF FIREEE!)Greetings fellow crypto fam! I am here to share a fairly well conclusion on what's gonna happen with bitcoin, we have been so exposed with lots of bearishness with all of the charts and patterns pointing more downside action. We have bearflags, rising wedges, inflation, rate hikes, housing market crashes, war, pandemic -- there's too much of anything in this world to even be at least interested in becoming a bull so I implore you to carefully consider your options in this market. There are two choices here,, either you enter shorts or puts in this monthly trend of bearishness or you can sit it out, wait for everything to settle probably 6 months or so and then decide from there.
The totality of Jack Powell's speech in the Jackson Hole is a huge U-turn on his image basically because everyone was expecting for a neutral-rate hike or even a standard Jack Powell optimistic speech, but no he literally admitted that along the way some pain will happen and this cannot be helped by taking more of this approach aggressively and possibly even end it quickly. I like the brashness of it all, however he just nailed the door shut when he said that their decisions or outlook towards the economy would largely depend on "data".
The bad thing about being data-dependent is that the economy could crash tons of money tomorrow and they will only act FROM there, there are no preventive measures, there are no concrete risk managements -- just pure reliance on what the potential future data can display and that's just sending everyone to their financial graves. This only proves that they literally cannot do anything to change what is happening and would prefer to just let the market settle ITSELF, all on its own , with continuous monitoring by yours truly, the FED.
----
Like the chart? The fundamental analysis too? Give my chart a boost, comment and share it. Its completely free, bookmark it, save it -- it is yours!

Bottom will be in December most likely: rising wedge on invertedSeptember: 15-16k per BTC, run up to 19.5K by October, resistance
October end: dump to 14.8k per BTC run to 16.7k by December
December: bottom - 12-13k
This coincides with 2018, the bottom was also in December.
The moment you see a double retest and a bullish divergence shows we are in bottom. But RSI keeps going to the high and the price is much lower, which is extremely bearish

BTC 15 min time frame looks good for short BTC 15 min time frame looks good for short as the trend is bearish so looks so good and also look for reversal if it breaks for upside might give up move also but however the overall all markets are down so impact will on BTC also so look this watch this in 5 min time frame for target and stop ;loss

Potential LTF BTC trade (Falling Wedge)BTC is coming out of a falling wedge of which’s target has been met. During this, the price action created a falling wedge which could take us higher until we reach the HTF resistance line in yellow which has continuously pushed price back down.
I think upon touching this yellow resistance line we will fall down to around the 13k level as there is major support there, please check out my other chart for BTC where I detail this. (BTC Price Prediction - TA)

ETHEREUM PERSONAL ANALYSIS IN THE VERY SHORT TERM (LANDSLIDE!)Total evaluation for the ETH asset is completely bearish. I repeat, bearish. Its quite obvious where we are going at this point. I don't see any particular bounce until we hit the previous support which is around 1500$ and even then depending on the current situation for Jack Powell's speech, we might see a more bearish approach. Lets tune in together at this very important day because there is a huge chance whatever happens today will reverberate all throughout our low volume weekends which is hugely prone for manipulation pumps either way.
-----
Like the chart? Save it! Bookmark it, boost it, comment on it you go for it -- its completely free and yours!

BTC - Bear Flag. 18K Incoming?A measured move brings BTC down to 18K. Jackson Hole Symposium approaching tomorrow coupled with Friday equities profit taking could lead to continued bearishness over the weekend. Thoughts?

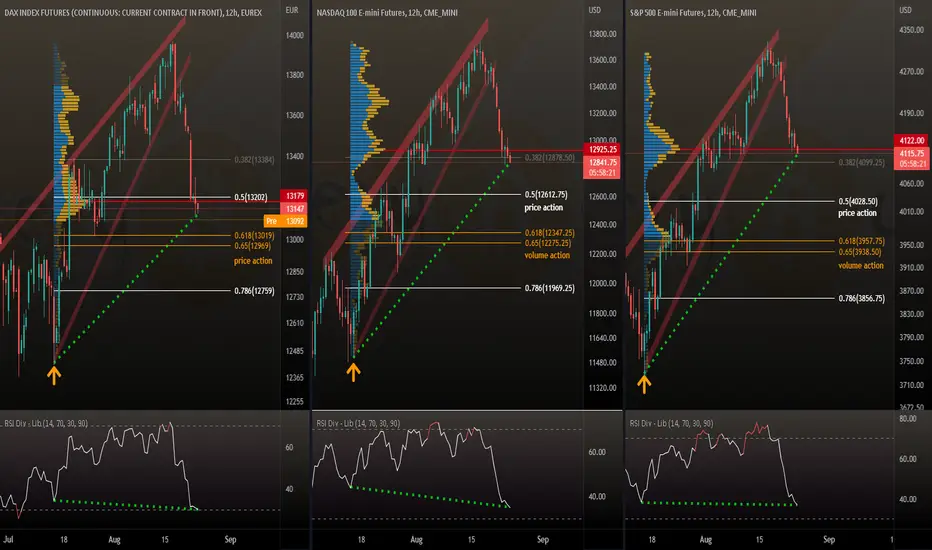
SPX500 DAX40 NASDAQ - more downward pressureSPX500 DAX40 NASDAQ - more downward pressure
Next support levels:
DAX at 13,000 (FIB golden pocket)
NASDAQ at 12,612 (FIB 50%) and 12,275 (FIB golden pocket)
SPX at 4,028 (FIB 50%) and 3,938 (FIB golden pocket)
Likely we meet these targets IMO dear Crypto Nation
*not financial advice
do your own research before investing
ETH PERSONAL ANALYSIS IN THE SHORT TERM (CONFIRMED!!!)The total current evaluation for Ethereum is a massive bear. Yes, you are reading that right, it is a complete breakdown of a confirmed rising wedge on the daily and you know what that means? This means that the price will now go back to where it originally started. Please be mindful of longing anything right now as we do not have any confirmations on any sentiment or fundamental or economical news to support a bullish reversal. The NASDAQ and the SP500 are on its way down, you can check it on my profile. You are in a bear market after all, shorting is the best move as is longing in a bull market!
---------
Do you like the chart? Do not forget to boost, comment, or share this to your friends. Bookmark it, save it, its completely free!

SPX500 DAX40 NASDAQ - volume support after breakdown ??!!SPX500 DAX40 NASDAQ - volume support after breakdown ??!!
All three traditional indices had a breakout of their rising wedges to the downside
Might be time for some recovery since prices meet volume profile support
Also hidden bullish divergence still in play
What do you think dear Crypto Nation
*not financial advice
do your own research before investing

2X $COST 1D Tech. Analysis!COSTCO IS A GREAT STOCK, but the price action is showing a cool off after this strong run up almost 40% from the May lows! The current bull trend is in a Huge rising Wedge, and also the overall chart is showing a head and shoulders formation in the making in the near future. Look to load up on puts at these 2 marked areas!

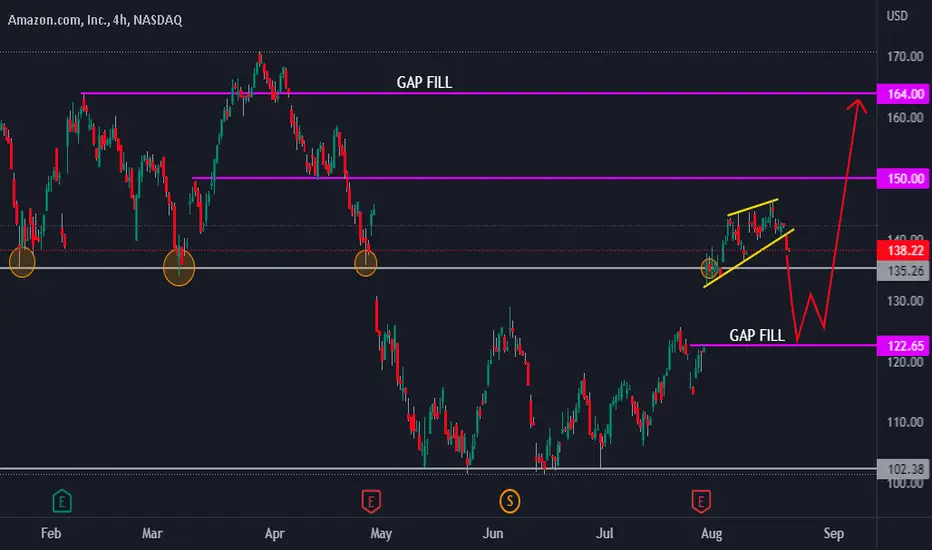
2X $AMZN 1D Tech. Analysis!AMAZON is coming out of a small rising wedge; we can see a retracement of the 20% push up, go fill the gap around the $123 area. Then there will probably be a bullish confirmation to continue the push up to fill the gap area around $164
Btc’s big brown rising wedgeWouldn’t surprise me if price does a slow grind up this wedge for a bit. *not financial advice*

CAD/JPY - 1H - Rising WedgeCAD/JPY is in a bullish trend, making HHs and HLs and forming a Rising Wedge . The price action is currently making a pullback into the rising support which has a confluence of slow MA dynamic support.
The Bullish Bias is based on the following signals:
Bullish trend (price making HHs and HLs)
GMMA: fast MA above slow MA with separation
Slow MA acting as dynamic support
RSI above 50 and not too near overbought levels
OBV convergence with price (uptrend has conviction)
Expecting bulls to be in control above the rising support. Go short if the wedge breaks downside.
Like & Follow for more such ideas.

GOLD - New bull market has started! | All-time high next year
Gold has bounced successfully from the strong support level on the weekly chart.
As per my Elliott Wave analysis, an ABC correction (FLAT) + Wave (4) have been completed, so we can start a brand new impulsive wave!
On the weekly chart, we can spot a beautiful rectangle consolidation, which is a strong continuation pattern.
The price is above the 200 moving average. The 200 weekly MA is considered a very strong support area by huge institutions and hedge funds.
I think this will be the final impulsive wave and then we can go back to retest the rectangle from the upside.
You can place your profit target at the top of the parallel channel , but do not forget to switch to the LOG scale.
For more analysis, please hit "Like" and "Follow"!

SP500 INDEX PERSONAL ANALYSIS IN THE LONG TERM (DUMP)The overall evaluation on the SP500 index has been in a monthly bearish trend that has always confirmed itself via a monthly resistance trendline rejection ever since the apex turning point of this index from January 2022. Please be cautious on your risk management as always. The projected lines of direction (white) are not random skittles, but was produced by my experience of years of trading on how market moves work to build proper market structure. Yes, it is possible that we may even dump further than expected or pump tremendously due to some peculiar and consistent positive catalysts however this serves as a "guideline" on what to expect for the months to come.
The SP500 is very similar to the NASDAQ structure and as well as in crypto. We may not see any potential major consolidation ranges until we hit the 2020 support lines.
------------------
You like the chart? Its free!
Don't forget to like, share and comment! Bookmark it, save it so that you may add it as additional reference for your future trades. Thank you!
(If you got any spam notifications by me reposting this a lot, its because the image view or zoom is not available in tradingview upon application. You shouldn't have to adjust it yourself, just read for your convenience!)

BTC is in a Rising WedgeRising Wedges are typically bearish, but I've indicated potential 1x, 1.5x, and 2x targets for exiting both bottom or top.
Should we do the opposite of what's usually expected and exit from the top:
-- Note that the 2x target for exiting top lines up just above the 200 day EMA.
If we see a corrective rally, stopping at or a bit above the 200 day EMA is quite common in its history of corrective rallies.

bearish wedge officially broke below, watch retest of org chanas i called before, we have officially broken below the bearish wedge. i, personally, expect the price to move below the old channel, but there is a small possibility for bulls to take tower at rest (though unlikely. could short now until it retest, close, then enter a long or a short of the break below, could wait for retest to enter a position, or could short now and close at 8/9k.

SOL: Wedge Pattern!SOL/USDT is making a rising wedge pattern on 1 day chart.
There can be 2 scenarios:
1. If SOL breakout through the lower trend line below 40 then the targets are on next support areas marked on the chart (Green)
2. If SOL holds the area in the wedge then the targets are on next resistance areas marked on the chart (Red)
Share your views in the comment section.
Like & follow for more easy and simple trading ideas.
Thank You!

Bitcoin - Last valid bullish EW count was invalidated, what now?
I studied this market structure for several hours, and my conclusion is that there is no valid Elliott Wave bullish count. Simply, a valid Elliott Wave count does not exist. Is this a problem?
From the Elliott Wave perspective, there are 2 possible options:
1) If we want to stay bullish, we have to accept the fact that a third impulsive wave can sometimes be a diagonal, not only an impulse. which I think could be true.
2) This was a huge WXYXZ corrective structure and we must go below 17622 USDT to confirm this count, make a new low, kindly by a wick, and then we can start a brand new uptrend or continue lower to 13-15k.
Which one of these options do you see? Let me know in the comment section what you think about it!
This technical analysis shows an impulsive wave with a non-standard diagonal third wave.
We still have a total of 9 waves, which indicates a bullish movement as per the simple rule that 5, 9, 13, 17,... waves are generally impulsive structures.
Market structures are not perfect. Sometimes you can see a weird triangle or a weird wedge, as well as a weird impulsive wave.
I don't trade Bitcoin, because my strategy and system is a strict pattern that occurs only sometimes in the market. That's why I watch 1000+ altcoins and pick only the most promising ones as per my strategy. But I do have Bitcoin for the longterm hodl.
For more ideas, please hit "Like" and "Follow"!

Bitcoin to $19200 ?Bitcoin to $19200 ?
Rising Wedge Breakdown
Short Target 19200
Let me Know what you think

Bear for Bitcoin, Short!As of the rising wedge, there has been a breakout as expected, So going short rn will be osm!...
⚠️NOT A FINANCIAL ADVICE
