Bitcoin (BTC/USD) Reversal? Rising Wedge Breakdown Signals Sell! The chart suggests a potential bearish move after a rising wedge pattern breakdown.
Key Observations:
Rising Wedge Breakdown:
BTC formed a rising wedge, which is a bearish reversal pattern.
The price has broken down from this wedge, indicating a potential downtrend.
Support and Resistance Levels:
Resistance Zone: Around $88,188 – $88,792, marked as a key level where selling pressure may increase.
Support Zone: Around $85,368 – $84,226, where buyers may step in.
Target: $81,429 – $81,258, a strong support level where price could drop.
Bearish Setup:
The chart suggests a sell opportunity near resistance, expecting a downward move toward the target zone.
Trading Idea:
Entry: Sell near $88,000 after confirmation.
Target: $81,429 – $81,258 (support zone).
Stop-Loss: Above $89,991 (resistance zone).
This setup suggests Bitcoin could decline further, making it a potential short trade opportunity. However, traders should watch for confirmation and overall market sentiment before executing trades.
Rising Wedge

CHFJPY - Bearish Rising WedgeHello Traders !
The CHFJPY failed to create a new higher high!
The price formed a rising wedge pattern.
Currently, The support line is broken !
So, I expect a bearish move📉
________________
TARGET: 168.750🎯

Silver (XAG/USD) Rising Wedge Breakdown – Bearish SetupMarket Overview & Context
Silver (XAG/USD) has been in a strong uptrend, forming higher highs and higher lows over the past few weeks. However, recent price action suggests a potential shift in momentum as a bearish Rising Wedge pattern emerges. This technical pattern often signals a possible trend reversal or correction.
This analysis focuses on a 4-hour (H4) chart, which provides a medium-term perspective for traders. The market has recently encountered a strong resistance zone, and multiple price rejections indicate a potential downward move.
Chart Pattern: Rising Wedge Formation
The Rising Wedge is a bearish reversal pattern that occurs when the price moves higher within two converging trendlines. This structure suggests that while buyers are still in control, their momentum is weakening.
Key Characteristics of the Rising Wedge in This Chart:
Uptrend with Weakening Momentum:
The price has been rising, but the higher highs are becoming less aggressive.
The slope of the highs is flatter compared to the lows, which indicates declining bullish strength.
Converging Trendlines:
The price is getting squeezed between support and resistance.
This tightening range typically precedes a breakout, with a higher probability of a bearish breakdown.
Bearish Implications:
A breakdown below the wedge’s lower trendline confirms bearish sentiment.
The price could drop sharply toward the next major support level if sellers gain control.
Key Technical Levels & Trading Strategy
1️⃣ Resistance Zone (Supply Area) – $34.50 to $34.60
The price has repeatedly tested but failed to break above this zone.
This confirms that sellers are active in this area, leading to multiple rejections.
A strong supply zone, making it an ideal stop-loss placement for short trades.
2️⃣ Support Level (Demand Area) – $30.50 to $30.60
This level has acted as major support in previous price action.
If the breakdown occurs, this is the primary downside target for sellers.
3️⃣ Stop Loss – $34.61
Positioned just above resistance to minimize risk exposure.
Ensures that if price moves against the trade, losses are contained.
Trading Plan & Execution
📉 Short (Sell) Setup – Bearish Breakdown Expected
✅ Entry: A confirmed breakout below the rising wedge’s support trendline (~$33.50 - $33.80).
✅ Stop Loss: Placed slightly above $34.61, ensuring risk control.
✅ Target: $30.56, aligning with previous support zones and technical projections.
Risk-Reward Analysis
Entry at breakdown (~$33.50)
Stop loss (~$34.61) – Risk: ~1.1 points
Target (~$30.56) – Reward: ~2.9 points
Risk-to-Reward Ratio: ~1:3, making this a highly favorable short setup.
Confirmation Signals to Watch Before Entering a Trade
📉 Break and Retest of Support as Resistance
If price breaks below wedge support and retests it as new resistance, it strengthens the bearish case.
📉 Volume Spike on Breakdown
A sharp increase in volume when breaking support confirms strong selling pressure.
📉 RSI Divergence (Bearish Signal)
If the Relative Strength Index (RSI) shows lower highs while the price makes higher highs, it suggests momentum weakness and a pending breakdown.
Potential Trading Scenarios
📌 Bearish Scenario (High Probability) – Breakdown Confirmation
If the price breaks below the wedge’s lower trendline and closes below $33.50, it will likely accelerate downward toward $30.56. Traders should enter short positions and hold for the target while managing risk with stop-loss levels.
📌 Bullish Scenario (Low Probability) – Invalidating the Pattern
If the price breaks above $34.60 and holds, the rising wedge pattern is invalidated. This would signal continued bullish strength, and traders should avoid short positions.
Conclusion & Final Thoughts
✅ The Rising Wedge Pattern suggests a potential bearish reversal in Silver (XAG/USD).
✅ If the price breaks the lower trendline, a drop toward $30.56 is highly probable.
✅ Traders should wait for confirmation signals before entering a trade.
✅ Risk management is crucial, with a stop-loss above $34.61 to minimize exposure.
🔹 This setup presents a strong risk-to-reward opportunity, making it ideal for traders seeking short positions in Silver.

XAUUSD Bearish Breakdown: Riding the Rising Wedge to Profit1. Chart Pattern: Rising Wedge (Bearish Reversal)
The Rising Wedge is a technical pattern that occurs when price makes higher highs and higher lows within converging trendlines. This pattern is considered bearish, as it usually precedes a breakdown when price fails to sustain the higher levels.
The pattern is clearly visible as price moves within two upward-sloping black trendlines.
The narrowing range suggests that buying pressure is weakening, and sellers are gaining control.
A confirmed breakdown occurs when price breaks below the lower trendline, indicating potential further downside.
2. Key Technical Levels
Resistance Level (Highlighted in Beige, Top Box)
This area represents a strong supply zone where price has struggled to move higher.
Each time the price reaches this level, selling pressure increases, pushing the price lower.
The chart labels this as the Resistance Level, suggesting a potential reversal zone.
Support Level (Highlighted in Beige, Lower Box)
This is the previous demand zone, where price has rebounded multiple times.
Once price reaches this level, buyers may attempt to push it higher.
However, if this level fails to hold after the breakdown, further downside is expected.
Stop Loss Level (~3,150)
The stop loss is placed just above the recent highs.
If price moves beyond this level, it would invalidate the bearish setup.
Traders use stop losses to limit risk in case the market moves against the position.
Target Level (~3,080)
This is the projected downside target based on the height of the wedge.
A measured move (calculated from the highest to the lowest point of the wedge) aligns with this target.
It represents a potential 1.78% decline from the breakdown level.
3. Price Action & Trade Setup
Breakout Confirmation:
The price broke below the lower trendline, confirming a wedge breakdown.
The bearish momentum suggests sellers are in control.
Entry Zone:
A good short-selling opportunity is identified after the breakdown and potential retest of the lower trendline.
Risk Management:
Stop loss at 3,150 (above resistance).
Profit target at 3,080 (expected support).
This gives a favorable risk-to-reward ratio.
4. Market Psychology Behind the Pattern
Rising Wedge Psychology:
The pattern forms as buyers push price higher, but each new high has weaker momentum.
Eventually, selling pressure outweighs buying interest, leading to a breakdown.
Resistance & Support Psychology:
The resistance area acts as a supply zone where big traders sell their positions.
The support zone may hold temporarily, but if it breaks, panic selling could accelerate the decline.
5. Possible Scenarios After the Breakdown
Bearish Case (Most Likely Outcome)
Price continues downward after breakdown.
It reaches the 3,080 target with increased selling momentum.
Confirmation of a bearish reversal pattern.
Bullish Case (Invalidation of Setup)
Price reclaims the wedge and moves back above resistance.
It invalidates the bearish breakdown, stopping out sellers.
A potential bullish continuation toward new highs.
Final Thoughts
This chart presents a high-probability short trade based on the Rising Wedge breakdown and resistance rejection. Traders can manage risk by setting a tight stop loss above resistance while aiming for a target at the next key support zone. The pattern suggests a bearish sentiment in the short term, favoring sell setups over buying opportunities.
Would you like me to add further insights, such as Fibonacci levels or RSI analysis, to strengthen the trade idea? 🚀

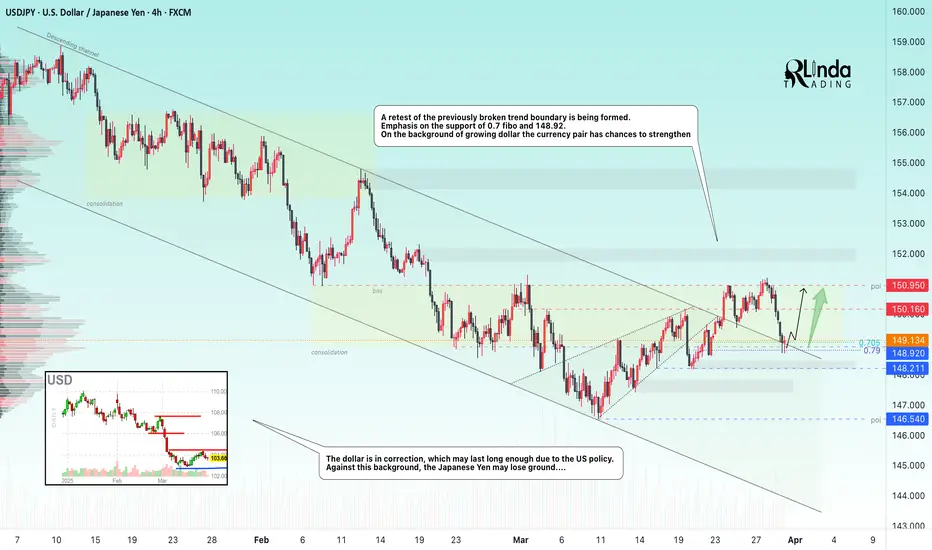
USDJPY → Key Level Retest. Attempt to change the trend FX:USDJPY in the correction phase is retesting the previously broken boundary of the downtrend. The market is trying to break the trend on the background of the dollar correction
The dollar is having a rather difficult life because of economic and geopolitical nuances regarding the USA, as well as high inflation. Against this background, the index may continue a deeper correction, as the rhetoric of interest rate cuts may be prolonged, which may put pressure on the markets.
The currency pair tried to overcome the downtrend resistance earlier and succeeded, but this is not enough for a trend change, it needs confirmation.
Support levels: 148.92, 148.21
Resistance levels: 150.16, 150.95
If the bulls hold the defense above 148.92 - 149.5, we have a good chance to catch a trend change. It will be the readiness to go to the resistance of 150.16 range, and the breakout of this level and price fixation above it will be the confirmation of the trend change
Regards R. Linda!
XAG/USD Rising Wedge Breakdown To Bearish Trade Setup1. Overview of the Chart
This chart represents Silver (XAG/USD) on the 4-hour timeframe from the OANDA exchange. The price action has formed a Rising Wedge pattern, which is a classic bearish reversal formation. This suggests that a potential breakdown could lead to a significant decline in price.
2. Chart Pattern: Rising Wedge Formation
A Rising Wedge consists of a narrowing price range with higher highs and higher lows, but the slope of the support line (bottom trendline) is steeper than the resistance line (top trendline).
This signals weakening bullish momentum, as buyers are struggling to push the price higher, and sellers are stepping in.
Rising Wedges typically break downward due to the loss of buying strength.
3. Key Technical Levels and Market Structure
A. Resistance Level (Highlighted in Beige Box - $34.50 to $34.80)
This zone has acted as a supply area, where price struggles to break higher.
The price touched this level multiple times, failing to hold above it, which increases the probability of a reversal.
B. Support Level (Highlighted in Blue Box - Around $33.50)
This is a critical short-term support where buyers previously stepped in.
A break below this zone would indicate a confirmation of the wedge breakdown and further downside potential.
C. Stop Loss Level (Marked at $34.80)
Placed above the resistance zone, ensuring protection if price invalidates the pattern and moves higher instead.
This aligns with a logical risk-management strategy to minimize losses if the setup fails.
D. Bearish Breakdown Projection & Target (Marked at $30.46)
The projected target aligns with previous structure support, meaning price may find buyers around this level.
This level is determined by measuring the height of the wedge and projecting it downward from the breakout point.
4. Trading Strategy & Execution Plan
📌 Short (Sell) Trade Setup:
Entry:
Enter a short position once price breaks below the lower trendline of the wedge with strong bearish momentum (e.g., a big red candle closing below support).
A possible retest of the broken support could provide a second entry opportunity.
Stop Loss:
Set at $34.80, above resistance, to ensure the trade is protected against invalidation.
Take Profit (Target):
First target: $32.50 (psychological level and minor support).
Final target: $30.46 (major support and full pattern breakdown projection).
5. Market Psychology & Confirmation Signals
Why This Setup is Bearish?
Price action shows higher highs but with decreasing strength, signaling bull exhaustion.
The Rising Wedge is a well-known bearish structure, and its breakdown typically leads to a strong sell-off.
Volume confirmation: If the breakdown happens with high volume, it strengthens the bearish case.
What to Watch For?
A decisive bearish candle closing below the wedge support confirms the short setup.
If price retests the broken trendline and fails to reclaim it, it provides a second opportunity for entry.
Avoid entering if price consolidates near resistance instead of breaking down.
6. Conclusion: Bearish Bias & Trading Edge
The Rising Wedge formation suggests that Silver is losing bullish momentum and could break down.
Key levels and structure provide a well-defined trade setup, ensuring a good risk-to-reward ratio.
Traders should wait for a confirmed breakdown before entering a short position.
📉 Bearish Outlook – Price likely to drop toward $30.46 target
⚠️ Risk Management is crucial – Stop Loss at $34.80
🎯 Breakdown confirmation needed before entering short positions
Would you like me to refine any part or add more insights? 😊

Bitcoin (BTC/USD) Breakdown – Rising Wedge Signals Further Drop!1. Chart Overview
This 4-hour BTC/USD chart from BITSTAMP presents a well-defined Rising Wedge pattern, which is a bearish reversal structure typically signaling an upcoming price decline. After a strong upward movement, Bitcoin formed a wedge pattern with higher highs and higher lows converging. This indicates weakening bullish momentum, leading to a confirmed breakdown.
2. Key Technical Elements & Market Structure
A. Rising Wedge Formation (Bearish Pattern)
A rising wedge is a bearish reversal pattern that appears after an uptrend, showing gradually weakening buying pressure.
The chart shows that price action was following an upward sloping support and resistance trendline.
The higher highs and higher lows formed within the wedge indicate a loss of bullish momentum.
Eventually, the price broke below the lower trendline, confirming a bearish breakdown.
B. Breakdown Confirmation
A decisive bearish candle broke below the wedge's lower trendline, confirming the downward move.
After breaking down, the price attempted a small retest of the wedge’s support, which has now turned into resistance.
This successful rejection from the previous support adds to the bearish confirmation.
C. Support & Resistance Levels
Resistance Level ($88,547):
This zone acted as a strong supply area, where previous bullish moves were rejected.
If BTC/USD attempts to recover, this area may provide selling opportunities.
Support Level ($79,193):
This is the next downside target, aligned with previous price consolidation zones.
A break below this support could trigger further selling pressure.
3. Trading Setup & Strategy
A. Short Trade Setup
Entry Point: After BTC/USD confirmed the breakdown of the rising wedge.
Stop Loss: Placed slightly above the $88,547 resistance level to limit risk.
Target Price: A decline towards $79,193, which aligns with the previous major support zone.
B. Bearish Market Sentiment
BTC/USD is currently trading below the wedge, reinforcing bearish bias.
A successful retest of the broken wedge support would validate further downside continuation.
If price remains below the $85,000 level, sellers are likely to maintain control.
4. Market Outlook & Next Price Action
Bearish Scenario
If BTC fails to reclaim the wedge breakdown level, further downside is expected.
A breakdown below $80,000 psychological level could increase selling momentum toward $75,000-$77,000 levels.
Volume analysis suggests that selling pressure is increasing.
Bullish Scenario (Invalidation)
If BTC/USD reclaims the $88,547 resistance and closes above it, the bearish bias could weaken.
Bulls need to break above the rising wedge resistance trendline for a reversal.
5. Conclusion & Trading Plan
The Rising Wedge pattern breakdown confirms a bearish outlook for BTC/USD.
The risk-reward ratio for a short trade is favorable, targeting a move down to $79,193.
Traders should watch for volume confirmation and trend continuation signals before entering.
Key Takeaways
✅ Bearish Bias confirmed after the Rising Wedge breakdown.
✅ Short Position setup with entry, stop loss, and target defined.
✅ Resistance at $88,547 - Failure to break above it strengthens the bearish case.
✅ Target at $79,193 - A strong support area where buyers may step in.
6. Tags for TradingView Post
#BTC #Bitcoin #Crypto #TradingSetup #TechnicalAnalysis #CryptoTrading #BearishPattern #RisingWedge #Breakdown #ShortTrade #PriceAction #SupportResistance #MarketAnalysis
Would you like any further refinements or additional insights? 🚀

EUR/USD Weekly Forecast: Rising Wedge Breakdown & Bearish TargetChart Overview:
The provided EUR/USD daily chart displays a well-structured Rising Wedge pattern, which eventually led to a significant bearish breakdown. The analysis highlights key levels, including resistance, support, stop loss, and a downside target, all of which contribute to a well-planned trade setup. The market structure suggests a strong bearish continuation, targeting lower price levels based on technical projections.
1. Chart Pattern: Rising Wedge Formation & Breakdown
A Rising Wedge is a bearish reversal pattern that forms when price creates higher highs and higher lows, but the slope of the trendlines indicates weakening bullish momentum. This pattern is often a signal of upcoming bearish price action once a breakout occurs.
Pattern Breakdown Analysis:
The price moved inside the wedge, showing a gradual upward trend with declining momentum.
Upon reaching a key resistance level, price faced strong rejection (marked with a red circle).
The bearish breakdown below the wedge confirmed the pattern, leading to a sharp decline.
A retest of the broken wedge followed before continuing downward.
This confirms a classic bearish trend reversal, making it a strong technical setup.
2. Key Levels and Trade Setup:
🔹 Resistance Level (Major Supply Zone)
The resistance zone (highlighted in beige) acted as a strong supply area, where buyers lost control.
Price reached this resistance multiple times but failed to sustain above it.
A bearish reversal initiated from this level, marking the beginning of a downward trend.
🔹 Support Level (Key Demand Zone)
The support zone (also highlighted) represents a major demand area where price previously reversed.
This level aligns with historical price action, making it a critical area to monitor for potential reactions.
🔹 Stop Loss Placement
A stop loss is placed above the previous high within the resistance zone to protect against false breakouts.
If price invalidates the breakdown and moves above this level, the bearish setup would no longer be valid.
🔹 Price Target Projection
The breakdown suggests a potential drop towards 1.00874, as indicated by the 100% measured move.
This aligns with previous historical support, making it a realistic downside target.
3. Trade Execution Plan: How to Trade This Setup?
📌 Entry Strategy:
Traders can enter short after confirmation of the breakdown and a potential retest.
A sell position can be initiated around the resistance turned support after a pullback rejection.
📌 Stop Loss Strategy:
A stop loss should be set above the resistance zone (around 1.12208) to minimize risk.
This ensures protection against a bullish breakout invalidation.
📌 Take Profit Strategy:
The first take profit target is set at the support level near 1.04498.
The final take profit target is at 1.00874, which aligns with the full measured move projection.
4. Conclusion & Market Sentiment
🔸 Bearish Market Bias – The breakdown of the rising wedge confirms strong bearish momentum.
🔸 Key Resistance Held Strong – The price was unable to break above, confirming seller dominance.
🔸 Downside Target Aligns with Previous Support Levels – A confluence of technical signals supports further decline.
Final Thought:
This chart presents a high-probability bearish trade setup in EUR/USD. The combination of a rising wedge breakdown, clear resistance rejection, and a defined downside target makes it an ideal short-selling opportunity. Traders should watch for price action confirmations and risk management strategies before executing trades.
🚨 Risk Disclaimer: Always apply proper risk management and confirm signals before trading. Market conditions may change, so monitoring price behavior is crucial for trade adjustments.

Bitcoin Weekly Forecast | Rising Wedge Breakdown & Bearish MoveIntroduction
This Bitcoin (BTC/USD) 1-Day Chart Analysis highlights a critical market development: the breakdown of a Rising Wedge pattern, signaling a potential bearish trend. After reaching a new all-time high (ATH) resistance, BTC has shown weakness, confirming a possible reversal. This analysis covers key levels, trend structure, trading setups, and market psychology for traders looking to capitalize on this move.
1️⃣ Understanding the Chart Structure
Rising Wedge Pattern – A Classic Bearish Reversal
A Rising Wedge is a bearish technical formation that develops when prices rise within a narrowing range. It typically features:
✅ Higher Highs & Higher Lows: Suggesting bullish momentum, but the price action becomes weaker over time.
✅ Converging Trendlines: Showing a loss of buyer strength as each rally fails to make significant new highs.
✅ Volume Decline: As the wedge matures, volume decreases, confirming reduced buying interest.
✅ Breakdown Confirmation: A sharp drop below the lower trendline validates the bearish move.
In this case, BTC followed all the classic wedge characteristics, and its breakdown has initiated a potential major correction.
2️⃣ Key Levels & Market Dynamics
🔵 Resistance Level + All-Time High (ATH) (~$110K-$115K)
BTC reached its ATH resistance zone but failed to hold above it.
The red arrow indicates the rejection at the top, where strong selling pressure emerged.
Bulls attempted multiple breakouts but failed, leading to a reversal.
🟢 Support Zone (~$78K-$80K) – Weak Retest Before Breakdown
The price initially bounced off this support but struggled to hold gains.
The blue support level highlights a key zone where BTC found temporary stability.
A weak rally followed, but the price got rejected again, confirming the bearish trend.
🔻 Major Bearish Target (~$48,920)
Using the measured move theory, the projected drop extends to $48,920, a strong historical support.
The black arrow points to the expected downward trajectory.
3️⃣ Trading Setup & Risk Management
🔽 Bearish Trade Setup (Short Position Strategy)
For traders looking to short BTC based on this pattern, here’s an optimal trade setup:
🔸 Entry Point: Around $85K-$90K (post-retest of breakdown)
🔸 Stop Loss: Above $100K (invalidation of the bearish setup)
🔸 Take Profit Targets:
TP1: $75K (minor support)
TP2: $60K (psychological level)
TP3: $48,920 (final bearish target)
Alternative Scenario – Bullish Recovery?
If BTC reclaims $100K+ with high volume, the bearish thesis is invalidated, signaling a continuation of the uptrend.
A break above ATH ($115K) would confirm new bullish strength.
4️⃣ Market Sentiment & Psychological Factors
📉 Bearish Sentiment Strengthens:
Rising Wedges often cause a bull trap, where buyers expect new highs but get caught in a reversal.
Current price action suggests sellers are gaining control.
⚠️ Key Risks for Traders:
False breakdowns can occur if BTC sees unexpected bullish news.
Keeping an eye on fundamental developments (ETF approvals, macroeconomic conditions, etc.) is essential.
Conclusion – BTC Heading for a Deeper Correction?
Bitcoin’s Rising Wedge breakdown strongly suggests a continued bearish trend.
Short opportunities are ideal below $90K, with downside targets near GETTEX:48K -$50K.
If BTC regains $100K+, bearish outlook is invalid.
📊 Trading Recommendation: Monitor price action closely and adjust risk management accordingly!
Would you like me to tweak any part of this analysis? 😊

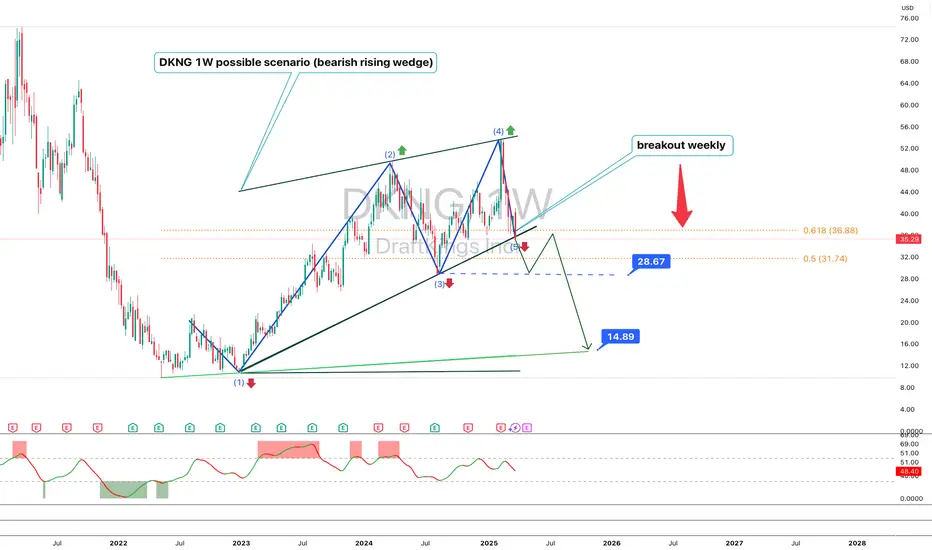
DKNG 1W – Technical and Fundamental AnalysisDKNG shares have broken a rising wedge on the weekly chart, reinforcing a bearish signal. The price is testing the $35.29 level after failing to hold above $36.88. A breakdown below $31.74 could accelerate a decline toward $28.67 and $14.89. RSI indicates weakening bullish momentum, MACD shows a bearish crossover, and EMA 50 and EMA 200 confirm a long-term uptrend but signal correction risks.
Fundamentally, DraftKings remains a leader in online gambling, but its stock is sensitive to Fed rate decisions and macroeconomic conditions. The upcoming earnings report could also impact price action. Correlation with the Nasdaq and S&P 500 increases its dependence on overall market sentiment.
A confirmed break below $31.74 could lead to further downside toward $28.67 and $14.89. If the price holds above $35.29, a recovery toward $36.88 is possible.
Silver (XAG/USD) Rising Wedge – Bearish Breakdown Setup!A rising wedge is a pattern that typically forms when the price makes higher highs and higher lows, but the upward momentum starts weakening. The narrowing structure of the wedge indicates that buyers are losing strength, and a breakout to the downside is likely.
Key Characteristics of the Rising Wedge:
✔ Higher highs & higher lows – but with reduced momentum
✔ Trendline support (lower boundary) & resistance (upper boundary)
✔ Volume decline – suggests a potential reversal
Expected Scenario:
If the price breaks below the lower trendline, it signals bearish pressure, and Silver could see a strong decline.
2. Key Levels & Trading Setup
📌 Resistance Level ($34.50 - $34.80)
The upper boundary of the wedge is acting as strong resistance.
Historically, this zone has rejected price action multiple times, indicating sellers are defending this area.
📌 Support Level ($30.20 - $30.50)
A major demand zone where buyers previously stepped in.
If the wedge breaks down, this is the most likely target for the decline.
📌 Stop Loss ($34.81)
Placed just above the recent high and resistance zone to limit risk in case of an unexpected upside breakout.
📌 Target ($30.20)
Measured move from the wedge breakdown projects a sharp decline toward the next strong support at $30.20.
3. Trade Execution Strategy
🔴 Bearish Breakdown Scenario
If the price breaks below the lower trendline (around $33.00), we expect a strong move downward.
📉 Short Entry: Below $33.00 (after confirmation)
🎯 Target: $30.20
❌ Stop Loss: $34.81 (above resistance)
Confirmation Needed:
✅ Strong bearish candle close below support
✅ Increased volume during breakdown
✅ Retest of broken support turning into resistance
🟢 Bullish Alternative (Invalidation)
If price breaks and holds above $34.81, the bearish setup will be invalidated, and a breakout towards $36.00 - $37.00 could be expected.
4. Additional Considerations
📌 Fundamental Factors: Keep an eye on macroeconomic news, Fed decisions, and USD strength, as these impact Silver prices.
📌 Risk Management: Avoid overleveraging and use a proper risk-reward ratio (1:3 or higher).
📌 Market Sentiment: Watch volume trends and confirm breakout or fakeout before entering trades.
Conclusion
This chart presents a high-probability short trade setup based on the rising wedge breakdown.
If the breakdown occurs, Silver could drop toward the $30.20 support zone. However, traders should wait for confirmation before entering to avoid fakeouts.
Would you like me to refine this further for a TradingView post? 🚀

CHF/USD – Rising Wedge Breakdown | Bearish Setup The CHF/USD (Swiss Franc to US Dollar) 15-minute chart is currently displaying a classic Rising Wedge Pattern, which is widely recognized as a bearish reversal pattern. This setup signals weakening bullish momentum and an increased probability of a price breakdown. The chart provides a clear sell trade setup, with key levels including entry, stop loss, and target, making it a structured and well-defined opportunity for traders.
🔹 Key Technical Elements on the Chart
1️⃣ Resistance Level (Sell Zone)
📌 Location: Near 1.1350 – 1.1360
📌 Significance:
This level represents a strong supply zone, meaning sellers have consistently pushed prices down from this area.
Price attempted to break through this zone multiple times but was rejected, reinforcing the bearish outlook.
It serves as the upper boundary of the rising wedge, confirming its role in restricting upward movement.
Traders should be cautious of any false breakouts above this level before confirming a bearish move.
2️⃣ Support Level (Demand Zone)
📌 Location: Near 1.1295 – 1.1305
📌 Significance:
This level has historically acted as a demand zone, where buyers stepped in to push prices back up.
However, the formation of the rising wedge suggests weakening demand at this level.
Once the price breaks below this support zone, it confirms a bearish trend continuation.
3️⃣ Rising Wedge Pattern (Bearish Setup)
📌 Pattern Characteristics:
The rising wedge is a bearish continuation pattern that typically signals an upcoming sell-off.
Price moves inside a narrowing upward-sloping range, where buyers lose strength while sellers gradually gain control.
The lower trendline (dotted black line) has been providing support, but as price struggles near resistance, a breakdown becomes likely.
Once price breaks below the wedge, the pattern confirms a strong bearish move.
📌 Why Is This Important?
This pattern indicates that buyers are losing momentum, and a shift toward bearish control is taking place.
The expected move is a sharp downward breakout, leading to lower price levels.
4️⃣ Trendline Support (Breakdown Confirmation)
📌 Location: The dashed black line below price action
📌 Significance:
This trendline acted as a rising support, keeping price within the wedge.
A clean break below this trendline confirms the bearish breakout.
The breakdown is expected to be followed by increased selling pressure and higher trading volume.
📉 Bearish Trade Setup (Short Position Strategy)
Based on the rising wedge breakdown, traders can consider the following sell trade setup:
✅ Entry Point: Sell below 1.1325 (Confirm breakdown with volume)
✅ Stop Loss: Above 1.1356 (To avoid false breakouts)
✅ Target 1: 1.1295 (First support level)
✅ Target 2: 1.1275 (Deeper downside potential if momentum continues)
🛠 Trade Rationale (Why Take This Trade?)
🔸 Bearish Price Action → Price is rejecting resistance and forming a lower high, signaling weakness in the uptrend.
🔸 Pattern Confirmation → The rising wedge has a high probability of breaking downward, leading to a sharp decline.
🔸 Risk-Reward Ratio → The setup provides a favorable risk-to-reward ratio, as traders can manage risk efficiently by placing a stop loss above resistance.
🔸 Volume Analysis → If selling volume increases upon breakout, the move becomes more reliable.
📊 Market Outlook & Final Thoughts
🔹 Bearish Scenario:
If price breaks below 1.1325, expect a strong decline toward 1.1295 and potentially lower.
A sharp move downward could accelerate selling pressure, targeting 1.1275 in an extended move.
🔹 Bullish Reversal Risk:
If price closes back above 1.1356, the bearish setup is invalidated.
Traders should exit shorts if price reclaims the resistance level.
🚨 Final Verdict: Bearish Breakdown Expected!
📉 Short Setup Activated – Targeting 1.1295 🚀
📊 Watch for Volume Confirmation Before Entering!

Bitcoin’s Next Move: Falling to $79K?This detailed technical analysis of Bitcoin (BTC/USD) on the 1-hour timeframe highlights a Rising Wedge pattern, key support and resistance levels, a trade setup, and projected price movements. The chart suggests a bearish breakdown, and traders can use this analysis to make informed decisions.
1. Understanding the Chart Pattern – Rising Wedge Formation
A Rising Wedge is a bearish reversal pattern that occurs when the price moves upwards within two converging trendlines. The slope of the lower trendline is steeper than the upper trendline, indicating weaker bullish momentum and an increasing probability of a downside breakdown.
📌 Key Observations:
The black solid trendlines outline the wedge pattern.
The price action remained inside this wedge from March 11 to March 26, 2025.
A breakdown has now occurred, confirming bearish momentum.
🔺 Why is this Bearish?
Rising Wedges are considered distribution patterns, meaning buyers are losing strength, and sellers are gradually taking control.
The price fails to make aggressive new highs and instead grinds upward weakly.
Once support is broken, a strong sell-off usually follows.
2. Key Chart Levels – Support & Resistance Zones
🔵 Resistance Level (Upper Bound of Wedge & Supply Zone)
The red arrow marks a strong rejection at $88,500 - $89,000, which acted as a major resistance level.
This zone has seen multiple failed breakout attempts, signaling that sellers dominate this area.
Stop-losses for short trades should be placed above this resistance zone.
🟢 Support Level (Lower Bound of Wedge & Demand Zone)
The wedge's lower boundary previously acted as strong support until it was breached.
The blue highlighted box represents a demand zone around $81,000, where buyers previously stepped in.
Losing this level could trigger a much stronger bearish move.
3. Breakdown Confirmation & Trading Setup
With the wedge broken to the downside, we now look for a confirmed bearish setup to enter a trade.
📉 Bearish Confirmation:
✅ The price broke below the wedge’s lower boundary, signaling a reversal.
✅ A retest of the broken wedge trendline confirms the breakdown.
✅ The price is now showing lower highs and lower lows, indicating a new bearish trend.
🎯 Trade Setup – How to Play This Move?
🔴 Entry for Short Position:
Enter short between $86,900 - $87,200 after confirming a rejection at the broken trendline.
🔵 Stop Loss:
Place a stop-loss above $89,282 to protect against a fakeout.
If BTC closes back inside the wedge, the short setup is invalidated.
🟢 Target 1: $81,000 – This is a key demand zone, and price might temporarily bounce here.
🟢 Target 2: $79,031 – This is the next strong support level, making it a final bearish target.
⚠ Risk Management Note:
Adjust position size based on risk tolerance.
Be mindful of short squeezes (where price temporarily spikes before continuing lower).
4. Expected Price Movement – Bearish Projection
🔮 The dashed black lines on the chart indicate a likely price pathway:
1️⃣ A breakdown below the wedge, followed by a minor retest of the broken trendline.
2️⃣ A continuation toward $81,000 (support level).
3️⃣ A small bounce before further decline.
4️⃣ The price reaching the final target of $79,031, where buyers may start accumulating again.
📌 If Bitcoin breaks below $81,000 with high volume, the bearish trend will likely accelerate.
5. Market Psychology & Trading Strategy
📌 Why This Setup Makes Sense?
The market exhibited exhaustion at the top of the wedge.
The break-and-retest confirms seller dominance.
The lower highs & lower lows show bearish momentum.
🚀 Alternative Bullish Scenario?
If BTC reclaims the wedge and breaks above $89,000, then the bearish setup is invalid.
A close above $89,500 would signal strong buying pressure and potential bullish continuation.
6. Conclusion – What to Watch Next?
🔎 Key Points to Monitor:
✔ Retest & rejection at $87,000 – $88,000 (confirming bearish momentum).
✔ Break of $81,000 to signal continuation toward the target.
✔ Stop-loss protection above $89,000 to manage risk.
📊 Final Thoughts:
The Rising Wedge breakdown suggests a shift from bullish to bearish sentiment.
This is a high-probability short trade with well-defined entry, stop-loss, and targets.
Traders should wait for price action confirmation before entering trades.
Would you like any refinements, or do you need further trade ideas? 🚀📉

NVDA Bear may not be done chewing it up...NVDA looks like it's resuming it's downtown after a temporary recover. I'm watching to see if we get close to $100 again. If so, the door could open for $90 or even $85.
The rising wedge could still be in play here.
Good Luck & Trade Safe.

Silver (XAG/USD) – Rising Wedge Breakdown & Retest📌 Overview of the Chart
The chart illustrates a classic Rising Wedge pattern that has broken down, signaling a potential bearish continuation. The price action respected technical structures, including support and resistance levels, trendlines, and key psychological zones.
The breakdown of the rising wedge led to a sharp decline, followed by a retest of the previous support as resistance, confirming further downside momentum. Traders analyzing this setup can identify clear entry points, stop-loss placements, and target objectives based on price action behavior.
🔹 1️⃣ Understanding the Rising Wedge Pattern
A Rising Wedge is a bearish pattern that forms when price moves upward within converging trendlines. It indicates that buying momentum is slowing, and a potential reversal or breakdown is imminent.
✔ Characteristics of the Rising Wedge on This Chart:
📈 Higher Highs and Higher Lows: The price was trending upwards, but the narrowing structure indicated exhaustion.
📊 Decreasing Momentum: Volume likely started declining as the price approached resistance.
📉 Bearish Breakdown: Price broke below the lower trendline, confirming the pattern’s bearish nature.
🔻 What Happened Next?
The price dropped sharply after the wedge breakdown.
A retest of the broken trendline acted as a confirmation of resistance.
The downtrend continued, targeting a lower support level.
🔹 2️⃣ Key Support & Resistance Levels
🔵 Major Resistance – 34.27 USD (All-Time High & Supply Zone)
This level served as a strong supply zone, rejecting multiple bullish attempts.
Price struggled to break this level, leading to a sell-off.
The stop-loss for short trades is placed above this zone to minimize risk.
🟠 Support Level – 32.80 USD (Previous Support Turned Resistance)
This was a key support zone before the wedge breakdown.
Once broken, price retested this level and faced rejection, confirming a trend shift.
⚫ Trendline Support (Now Broken)
The lower support trendline was a crucial guide for bulls.
Once price broke below, it signaled strong bearish control.
A retest of the trendline was unsuccessful, confirming a bearish continuation.
🟢 Target Zone – 31.93 USD (Projected Breakdown Target)
The measured move target of the rising wedge aligns around 31.93 USD.
If selling pressure continues, price may reach this level.
🔹 3️⃣ Trading Strategy – Short Setup & Execution
This setup provides a high-probability short trade based on the pattern breakdown.
📉 Short (Sell) Entry Criteria:
✅ Entry Zone: After the price broke below the wedge and retested the trendline (~33.80 USD).
✅ Confirmation:
Bearish candlestick formations (Doji, Engulfing, or Pin Bars).
Increased volume on bearish moves.
🚫 Stop-Loss Placement:
🔹 Above the resistance level (34.27 USD) – If price breaks above this, the setup is invalid.
🔹 Reasoning: Protects against unexpected bullish reversals.
🎯 Take-Profit Target:
🔻 Target Price: 31.93 USD (based on measured move projection).
🔻 Risk-Reward Ratio: At least 2:1 (adjusted based on volatility).
🔹 4️⃣ Market Psychology & Price Action Analysis
Understanding trader sentiment is crucial:
📌 Before the Breakdown:
Bulls were in control, pushing price higher.
However, momentum slowed down, forming the rising wedge.
Traders who identified this pattern anticipated a potential trend reversal.
📌 After the Breakdown:
Sellers overpowered buyers, causing a rapid break of structure.
The price retested the previous support as resistance, confirming further downside.
The market sentiment shifted to bearish, aligning with technical confirmations.
🔹 5️⃣ Alternative Scenarios & Risk Factors
🔄 Bullish Reversal (Invalidation of Bearish Bias)
🚨 If price reclaims 34.00-34.27 USD, it invalidates the bearish setup.
📌 A break above this level could trigger a new bullish wave, targeting higher highs.
⚠️ Key Risk Factors:
Unexpected macroeconomic events (e.g., Fed policy, inflation data, geopolitical tensions).
Strong bullish rejection at lower support zones (~32.00 USD).
Volume divergence (if selling volume dries up, bears may lose control).
📢 Conclusion: High-Probability Bearish Trade with Clear Risk Management
This rising wedge breakdown provides a strong short setup, with technical confirmations and price structure supporting further downside movement.
📉 Bearish Bias Until 31.93 USD
A breakdown retest suggests sellers remain in control.
Price is expected to continue lower unless bulls regain 34.00+ levels.
🔍 Key Trading Question:
Will Silver (XAG/USD) continue to its measured target of 31.93 USD, or will bulls defend key support and push prices higher?
Let’s discuss! 🚀👇

BTC/USD Rising Wedge – Bearish Breakdown Ahead?Introduction: Understanding the Market Structure
This Bitcoin (BTC/USD) 4-hour chart presents a technical setup with a mix of bullish and bearish formations. The analysis focuses on key support and resistance zones, trendlines, and chart patterns to determine the next possible move.
🔍 The key takeaway? BTC has formed a Rising Wedge, a bearish reversal pattern, signaling potential downside unless a breakout invalidates the setup.
1. Market Structure & Current Trend Analysis
📌 Market in Curve Formation – The Accumulation Phase
Before the recent rally, Bitcoin was in a downtrend, making lower lows and lower highs, suggesting a period of price weakness.
However, price found strong support at around $77,600 - $80,000, forming a curved bottom structure—an early signal of an accumulation phase.
This bottoming pattern transitioned into a bullish uptrend, leading to the formation of a rising wedge.
🔹 Key Observations:
✔ Accumulation near $77,600 created a base for buyers.
✔ The gradual recovery curve suggests a shift from bearish to bullish momentum.
✔ Bitcoin later formed higher lows, confirming a temporary uptrend.
⚠ Shift in Momentum – The Rising Wedge Appears
The price rallied from the support zone but started forming a Rising Wedge pattern, which is typically a bearish signal.
A rising wedge indicates that although buyers are pushing prices up, they are losing momentum.
The narrowing price range suggests that sellers are entering at higher levels, weakening bullish strength.
2. Key Technical Levels to Watch
🔵 Resistance Zone ($92,000 - $94,957)
The shaded area near $92,000 - $94,957 is a major resistance level, where BTC previously failed to sustain a breakout.
This supply zone has been tested multiple times, reinforcing its strength.
The Stop Loss for short positions is placed above $94,957—any breakout above this level would invalidate the bearish setup.
🟠 Support Zone ($77,600 - $80,000)
The strong demand zone between $77,600 - $80,000 aligns with previous support levels.
If the rising wedge breaks down, this is the first major price target where BTC could find support.
A strong breakdown below $77,600 could lead to further declines toward $75,000 or lower.
3. The Rising Wedge Pattern – Bearish Warning!
🔍 What is a Rising Wedge?
A Rising Wedge is a bearish reversal pattern that forms during an uptrend when price moves within two converging trendlines.
It indicates that buyers are losing strength, and sellers are preparing to take control.
Once the lower trendline breaks, it confirms bearish momentum, leading to a price drop.
📝 Current BTC/USD Rising Wedge Analysis:
BTC has formed higher highs and higher lows, but the price range is narrowing.
The lower trendline is critical—a breakdown below this level could trigger a sharp decline.
The bearish target aligns with the support zone near $77,600.
4. Trading Plan – Possible Scenarios
📉 Bearish Breakdown Scenario (High Probability)
✅ Entry: Short BTC if the price breaks below the rising wedge (~$86,000 - $85,500).
✅ Stop Loss: Above $94,957 to protect against invalidation.
✅ Take Profit Target: $77,600 - $80,000 (first support level).
✅ Extended Target: If BTC drops below $77,600, watch for $75,000 - $72,000.
✅ Risk-Reward Ratio: Ideally 1:3 or higher for optimal trade management.
📈 Bullish Breakout Scenario (Low Probability but Possible!)
If BTC breaks and closes above $94,957, the bearish setup becomes invalid.
A confirmed breakout above resistance could push BTC towards $98,000 - $100,000.
Traders should wait for volume confirmation before entering long positions.
5. Risk Management & Final Thoughts
⚠ Risk Factors to Consider:
If BTC breaks the wedge with low volume, the move might be a false breakdown.
Macroeconomic events, such as interest rate decisions, can influence price behavior.
Watch for bullish divergences in indicators like RSI or MACD before shorting aggressively.
🔎 Conclusion:
The Rising Wedge pattern suggests a bearish reversal—a breakdown could send BTC toward $77,600.
Traders should wait for confirmation before entering trades.
If BTC breaks above $94,957, a bullish continuation could push it toward $100,000.
🔥 Bearish Bias Until Breakdown Confirmation!
Would you like an indicator-based analysis (e.g., RSI, MACD, or Moving Averages)? 🚀

Bitcoin (BTC/USD) – Rising Wedge Breakdown & Trading Setup 📊 Chart Overview & Market Context
The provided chart represents Bitcoin's (BTC/USD) price movement on the 1-hour (H1) timeframe, highlighting a Rising Wedge pattern. This pattern is generally bearish and signals a potential reversal or breakdown.
Over the past few trading sessions, BTC has been moving inside an ascending wedge formation, making higher highs and higher lows. However, this movement is narrowing, indicating weakening bullish momentum. As BTC approaches a critical resistance level, sellers appear to be gaining control, increasing the likelihood of a sharp decline.
This chart outlines a well-structured bearish trading setup, identifying key areas of resistance, support, stop-loss placement, and potential downside targets.
📌 Technical Analysis & Key Levels
🔹 1. Chart Pattern: Rising Wedge (Bearish Reversal Signal)
A Rising Wedge is a technical pattern characterized by:
✔ Two upward-sloping trendlines, converging over time.
✔ Diminishing bullish momentum, as higher highs become weaker.
✔ Breakdown expectation, where price typically falls below the lower support trendline.
📉 Why is this pattern important?
The rising wedge signals that buyers are losing strength and that a reversal is likely.
When price breaks below the lower boundary, selling pressure increases, leading to a strong downward move.
Traders often anticipate a breakdown from this pattern to enter short positions.
🔹 2. Resistance Level (Key Rejection Zone)
📌 Zone: 88,500 - 89,500 USD
This area has acted as a strong resistance, preventing further upside movement.
Sellers stepped in, causing the price to reject and start declining.
A confirmed rejection from this level adds bearish confluence to the setup.
🔹 3. Rising Wedge Support (Breakdown Level)
📌 Zone: 85,000 - 84,500 USD
This is the lower boundary of the wedge pattern.
If BTC closes below this level with strong volume, it confirms the breakdown.
A retest of this level as resistance after a breakdown would provide an ideal short entry.
🔹 4. Key Support Levels & Bearish Targets
Once BTC breaks down, the next areas of interest are:
📌 First Bearish Target: 80,500 - 79,500 USD
A previous demand zone where buyers previously pushed prices higher.
BTC could pause here before continuing lower.
📌 Final Target (Full Breakdown Projection): 76,802 USD
If the wedge pattern fully plays out, BTC could drop toward this level.
This aligns with a major historical support zone, where significant buying interest could emerge.
🔹 5. Stop-Loss & Risk Management
📌 Stop-Loss: 90,483 USD
If BTC moves above this level, it invalidates the bearish setup.
Keeping a tight stop-loss ensures controlled risk while maximizing potential rewards.
📉 Trading Plan: How to Trade This Setup?
✅ Short Entry Strategy:
Enter a short trade once BTC breaks below 85,000 USD, confirming the wedge breakdown.
If BTC retests the broken support (now resistance), it offers a second entry opportunity.
✅ Stop-Loss Placement:
Place a stop-loss above 90,483 USD, in case of a bullish breakout.
✅ Take-Profit Levels:
First Target: 80,500 - 79,500 USD (Support zone)
Final Target: 76,802 USD (Full wedge breakdown projection)
📌 Key Takeaways & Market Sentiment
🔸 Bearish Structure Formation: BTC is losing momentum inside a rising wedge, signaling a potential downturn.
🔸 Breakdown Confirmation Needed: A close below 85,000 USD with volume confirms the bearish trade setup.
🔸 Risk Management is Key: The stop-loss above 90,483 USD protects against invalidation.
🔸 Watch for Retests: If BTC retests the breakdown level, it can provide an ideal entry point.
🚨 Bitcoin is showing early signs of a bearish reversal! If the rising wedge breaks down, a significant decline toward 76,802 USD could follow. Traders should monitor price action carefully and execute the setup accordingly. 🚀

EURUSD → Price is in consolidation. Emphasis on false breakdownFX:EURUSD is forming a correction within the consolidation that was formed on the uptrend. The reason for the consolidation is the halt in the movement of the dollar index...
The dollar is forming a counter-trend correction due to political and econmoic data, but the general background is bearish. But, the fall of the dollar, to which the index may soon return, may strengthen the growth of the currency pair. EURUSD consolidation within the uptrend (against the background of the dollar index correction). The zone of interest is the support at 1.078 and the imbalance area
Resistance levels: 1.078, 1.074
Support levels: 1.0936.1.1009
The price has not tested the support and is forming a correction to the imbalance zone 1.087 - 1.09 from which the price may return to the downward movement to 1.078. The emphasis is on the range support from which we should wait for a false breakdown before further growth.
Regards R. Linda!

BTC/USD Trading Analysis – Double Bottom & Rising Wedge BreakoutThis BTC/USD 4-hour chart showcases a potential bullish breakout setup based on technical patterns, key support and resistance levels, and price action analysis. The chart suggests a trend reversal following a downtrend, with signs of bullish momentum building up.
Let's break down the full technical analysis, covering the chart structure, key levels, price patterns, and trading strategy.
1. Market Structure & Identified Patterns
A. Double Bottom Reversal – Strong Bullish Signal
A double bottom pattern has formed, which is a bullish reversal signal that indicates the end of a downtrend.
This pattern consists of two significant low points (Bottom 1 and Bottom 2) near the $80,000 - $81,000 support zone.
The pattern confirms strong buying interest at this level, preventing further price drops.
A breakout above the resistance level would confirm the pattern’s validity, signaling a move toward higher targets.
B. Rising Wedge Formation – Potential Bullish Breakout
The price action is consolidating in a rising wedge, forming higher highs and higher lows within a narrowing range.
A rising wedge often suggests a potential breakout.
Since this wedge forms after a double bottom, the breakout is expected to be bullish, rather than a bearish breakdown.
If the price breaks above the wedge’s upper trendline, it will confirm a strong upward momentum.
2. Key Support & Resistance Levels
Support Levels:
Major Support Zone (80,000 – 81,000):
This level has been tested twice, confirming buyer strength.
It serves as the foundation for the double bottom pattern.
Stop Loss Level (72,921):
If the price drops below this level, it would invalidate the bullish setup.
This level is strategically placed to manage risk and protect against potential downturns.
Resistance Levels:
First Resistance Zone (95,000 – 100,000):
This is a critical level, as the price has faced multiple rejections here.
A breakout above this zone would confirm a strong bullish trend continuation.
Take Profit Targets:
TP1 (108,481): The first take-profit target aligns with previous highs and is a logical point for partial profit booking.
TP2 (114,372): This is the second profit target, calculated based on Fibonacci extensions and historical price movements.
3. Trading Strategy & Execution Plan
A. Entry Strategy
To execute a successful trade, we need to wait for confirmation of the breakout.
Ideal Entry: After a strong breakout above 95,000 – 100,000, indicating bullish momentum.
Confirmation Factors:
Increased trading volume → Signals strong buying interest.
Candle close above resistance → Confirms breakout.
Retest of broken resistance as support → Strengthens bullish continuation.
B. Risk Management
Stop Loss Placement: Below 72,921, ensuring limited downside risk.
Risk-to-Reward Ratio: The trade setup aims for a 1:3 or better risk-to-reward ratio.
C. Potential Scenarios
✅ Bullish Breakout:
If BTC breaks and holds above 95,000 – 100,000, we can expect a rally toward 108,481 (TP1) and 114,372 (TP2).
❌ Bearish Rejection:
If BTC fails to break resistance, it could retest 80,000 or drop lower, invalidating the bullish setup.
4. Final Thoughts – What to Expect?
This BTC/USD 4-hour chart analysis provides a high-probability bullish trade setup, supported by:
✅ Double Bottom Formation → Strong Reversal Signal
✅ Rising Wedge Breakout Potential → Momentum Building
✅ Key Resistance Breakout Levels Identified
📌 Conclusion:
If Bitcoin breaks above 95,000 – 100,000, expect a major bullish move toward 108,481 and beyond. However, if resistance holds, we might see a retest of lower support levels. Risk management is essential for a successful trade execution. 🚀

BTC Dominance at Critical Level – Altcoin Rally Incoming?🚀 Hey Traders! 👋
If you find this analysis valuable, show some love by smashing that 👍 and hitting Follow for high-probability setups that actually deliver! 💹🔥
BTC Dominance Update:
We’re seeing a rising wedge formation on the daily timeframe—a classic bearish pattern. Right now, BTC.D is testing resistance, and if it rejects here, we could see an explosive Altcoin rally! 🚀
📉 Breakdown = Altseason incoming!
🚨 Invalidation: A break and close above 62.5 would cancel this setup.
What do you think about this? Let me know in the comment section.
👉 Stay ahead of the game! Follow us for real-time updates and pro-level trade setups. Let’s dominate the markets together! 💪🔥

Silver (XAG/USD) – Rising Wedge Breakdown & Bearish Setup📌 Overview
This 1-hour chart of Silver (XAG/USD) presents a textbook Rising Wedge pattern, which is known as a bearish reversal signal. The price was in a strong uptrend but started showing signs of buyer exhaustion, leading to a breakdown from the wedge formation.
The chart clearly identifies:
✅ A Rising Wedge formation
✅ Resistance Level where price faced multiple rejections
✅ Breakdown Confirmation and shift in trend direction
✅ Projected Target & Stop Loss Zones
This setup suggests a strong potential for further downside movement in silver prices. Now, let’s break it down step by step like a professional trader.
🔹 Key Technical Analysis Breakdown
1️⃣ Rising Wedge Pattern – The Bearish Setup
The Rising Wedge is a bearish reversal pattern that forms when price action moves higher within two converging trendlines. The slope of the lower trendline is steeper than the upper trendline, meaning that buyers are getting weaker.
This pattern suggests that even though the price is rising, bullish momentum is fading.
Once the price breaks below the wedge, it confirms a bearish trend.
🔸 Characteristics of this Wedge:
📌 Multiple Higher Highs & Higher Lows – But with decreasing strength
📌 Narrowing Price Action – Indicates weaker buying power
📌 Breakdown Below Support Line – Confirms the bearish move
2️⃣ Resistance Level – Key Price Rejection Zone
The price tested the Resistance Level multiple times before breaking down. This area is where sellers overpowered buyers, preventing further upside movement.
The resistance zone was a liquidity area, meaning large institutional traders likely placed sell orders here.
The price attempted to push higher but failed, showing that demand was exhausted.
Once rejection happened, selling pressure increased, and the breakdown followed.
3️⃣ Breakdown Confirmation – Bearish Momentum Kicks In
After the wedge broke down, the price started moving in a structured downtrend, forming lower highs and lower lows. This confirms that the breakdown was valid and that the trend has shifted.
🔹 Signs of Breakdown Strength:
✅ Strong Bearish Candles – Indicating aggressive selling
✅ No Immediate Recovery – Suggests sellers are in control
✅ Lower Highs Forming – Bearish trend structure confirmed
4️⃣ Risk Management – Stop Loss & Target Zones
A well-planned trade must include a Stop Loss and a Target to manage risk effectively.
📌 Stop Loss Placement (33.95)
Placing a Stop Loss just above the resistance level protects against false breakouts.
If the price goes back above 33.95, it would invalidate the bearish setup.
📌 Profit Target (31.96)
The target is based on the measured move projection, meaning the expected price drop is equal to the height of the wedge at its widest point.
If the price reaches 31.96, traders can lock in profits.
📌 Risk-Reward Ratio (RRR)
The setup offers a favorable risk-to-reward ratio, making it a high-probability trade.
5️⃣ Expected Price Movement – Bearish Outlook
From here, we can expect the following price movement:
📉 Scenario 1: Continuation of Downtrend (High Probability)
The price will likely form lower highs and lower lows on its way to 31.96.
Each small rally should be met with selling pressure.
📈 Scenario 2: False Breakdown (Low Probability but Possible)
If the price moves back above 33.95, the wedge breakdown will be invalid.
This could lead to a bullish reversal instead.
6️⃣ Final Thoughts – How to Trade This Setup?
This Rising Wedge Breakdown provides an excellent short-selling opportunity. Here’s how a professional trader would approach it:
✅ 🔹 Entry Strategy:
Short after a retest of the broken wedge support
Confirmation of lower highs ensures trend continuation
✅ 🔹 Risk Management:
Place Stop Loss above 33.95
Take profits around 31.96
✅ 🔹 Confirmation Signals to Watch:
Lower highs forming after breakdown
Increased selling volume on bearish candles
Price respecting the downtrend structure
🔔 Conclusion – Bearish Bias Confirmed
🔻 Trend Shift: The breakdown signals a potential trend reversal in silver.
🔻 Bearish Targets: The price is expected to fall toward 31.96 in the coming sessions.
🔻 High-Probability Trade: Strong technical reasons support a bearish outlook.
🚨 Watch for further confirmations and manage risk effectively! 📊💰

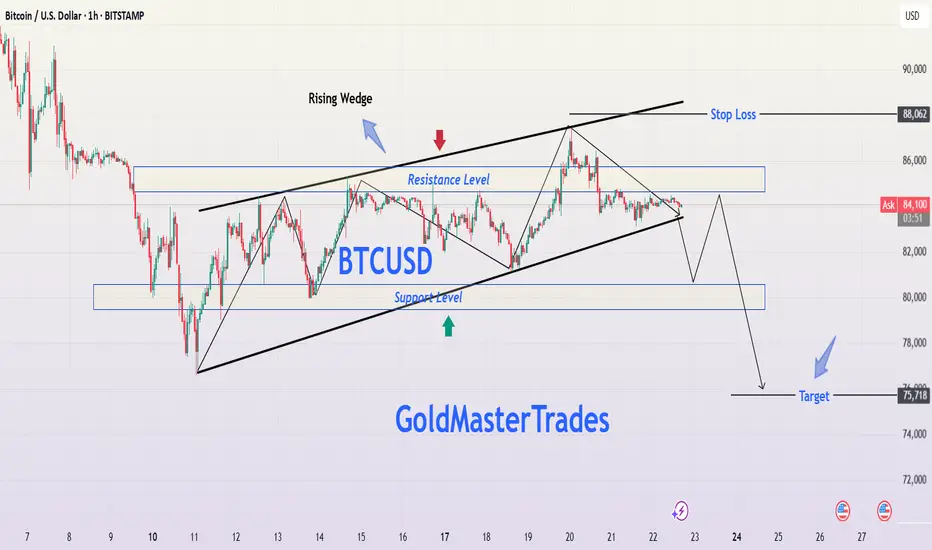
BTCUSD Bitcoin Rising Wedge Breakdown – Professional AnalysisBitcoin's price action is forming a Rising Wedge pattern on the 1-hour chart, a well-known bearish reversal formation. This pattern suggests that although the price has been making higher highs and higher lows, the upward momentum is weakening. Historically, when a rising wedge breaks to the downside, it often leads to strong downward movement, making it an ideal shorting opportunity.
This analysis will cover the pattern formation, key support and resistance levels, price action expectations, trading strategy, and risk management to ensure a well-informed trade setup.
1. Chart Pattern Breakdown: Understanding the Rising Wedge
Formation of the Rising Wedge
The price has been moving within two converging trendlines (black lines), forming a wedge shape.
The slope of both the upper and lower trendlines is positive, indicating an uptrend, but the lower trendline is steeper, suggesting weakening bullish pressure.
As Bitcoin moves higher, buying volume is declining, indicating that buyers are losing control.
The price has tested the upper resistance trendline multiple times, failing to break above it, further confirming bearish exhaustion.
The lower trendline has acted as strong support, but multiple touches suggest a possible breakdown soon.
Why This Pattern is Bearish
The rising wedge is inherently bearish because it signals that although the price is rising, the upward movement is slowing down. Eventually, the price is likely to break below the lower support trendline, triggering a sharp sell-off.
A breakdown from this wedge structure would confirm the start of a downtrend, making it an excellent opportunity for short traders.
2. Key Technical Levels to Watch
Resistance Level (~$86,000 - $86,500) - Strong Sell Zone
Bitcoin has repeatedly failed to break above this zone, indicating heavy selling pressure.
If the price unexpectedly moves above this level, the bearish setup would be invalidated.
Support Level (~$80,000 - $80,500) - Breakdown Zone
This support level has held strong multiple times.
If BTC loses this zone, it will likely trigger a massive drop due to stop-loss orders being hit and panic selling.
Stop Loss ($88,062) - Risk Management
A stop loss above $88,062 ensures protection against unexpected bullish breakouts.
This level is placed just above recent highs to minimize the risk of premature stop-outs.
Target Level ($75,718) - Profit Objective
The projected price target is based on measuring the height of the wedge and applying it to the breakout point.
This level also aligns with a major historical support zone, where buyers might step in.
3. Trading Setup & Strategy
Bearish Trading Plan - Short Setup
📌 Entry:
Enter short after Bitcoin breaks below the wedge’s lower support and confirms the breakdown by retesting support as new resistance.
Ideal entry price is around $81,500 - $82,000 after confirmation.
📌 Stop Loss:
Place above $88,062, which is beyond the wedge’s upper resistance.
This protects against unexpected bullish breakouts.
📌 Take Profit:
First target: $78,000 (psychological support).
Final target: $75,718 (technical breakdown target).
Confirmation Signals for a Strong Short Trade
✔ Candle Close Below Support – A 1-hour candle closing below the wedge confirms a breakdown.
✔ Increase in Selling Volume – Rising bearish volume supports downward momentum.
✔ Retest of Broken Support as Resistance – If the price retests the wedge’s lower trendline and fails to reclaim it, it confirms further downside.
4. Risk Management & Considerations
Risk-to-Reward Ratio: The trade offers a 3:1 risk-reward ratio, making it highly favorable.
Market Conditions: External news events, institutional activity, or macroeconomic trends (like inflation reports) could impact price action.
Bear Trap Possibility: If Bitcoin breaks below but quickly reclaims support, it could be a fakeout, so wait for confirmation before entering.
5. Alternative Scenario – When to Invalidate the Bearish Outlook?
Although the primary expectation is a bearish breakdown, we must consider alternate scenarios:
🚨 Bullish Invalidation: What if Bitcoin Rallies?
If Bitcoin breaks above the resistance zone at $86,500 - $88,000, the rising wedge breakdown would be invalidated. In that case:
✅ A breakout above $88,062 could trigger a short squeeze, pushing BTC toward $90,000+.
✅ Bulls will regain control, shifting the trend to bullish continuation instead of reversal.
🔹 In such a case, traders should exit short positions and re-evaluate market conditions before re-entering trades.
6. Conclusion – Trading Plan Summary
📊 Current Bias: Bearish 📉
🔹 Pattern: Rising Wedge (Breakdown Expected)
🔹 Entry: Short after wedge breakdown & confirmation
🔹 Stop Loss: Above $88,062
🔹 Target: $75,718
Bitcoin is forming a classic Rising Wedge, which historically leads to strong downward movement once it breaks support. If BTC follows the expected scenario, a high-probability short trade is in play, targeting a decline toward $75,718. However, traders must wait for confirmation and manage risk effectively to avoid fakeouts.
📢 Stay updated, follow price action closely, and trade responsibly! 🚀
GOLD → Consolidation (correction) before growth to $3100FX:XAUUSD is going into consolidation after strong growth on the back of dollar correction. The metal may test deeper support areas before attempting a new high
Gold is correcting, but remains in an uptrend
The decline in quotations may be seen as a buying opportunity, given the economic uncertainty due to Trump's tariffs and expectations of Fed rate cuts.
The Fed reiterated its forecast of two rate cuts in 2025 despite Powell's cautious comments. Gold is further supported by rising inflation risks and geopolitical tensions in the Middle East.
Resistance levels: 3045, 3057
Support levels: 3024, trending, 3004
Reaction to support is weakening, even amid the uptrend. Gold may stay in this consolidation until the middle of next week, or it may try to break out of the consolidation to retest deeper support zones, such as the rising trend line or the 3004 imbalance zone, from which the growth may resume.
Regards R. Linda!
