Trading Divergences With Wedges in ForexTrading Divergences With Wedges in Forex
Divergence trading in forex is a powerful technique for analysing market movements, as is observing rising and falling wedges. This article explores the synergy between divergence trading and wedges in forex, offering insights into how traders can leverage these signals. From the basics to advanced strategies, learn how you could utilise this approach effectively, potentially enhancing your trading skills in the dynamic forex market.
Understanding Divergences
In forex trading, the concept of divergence plays a pivotal role in identifying potential market shifts. A divergence in forex, meaning a situation where price action and a technical indicator like the Relative Strength Index (RSI) or Moving Average Convergence Divergence (MACD) move in opposite directions, often signals a weakening trend. This discrepancy is a valuable tool in divergence chart trading, as it may indicate a possible reversal or continuation of the current trend.
There are two primary types of divergence in forex—regular and hidden. Regular divergence occurs when the price makes higher highs or lower lows while the indicator does the opposite, often signalling a reversal. Hidden divergence, on the other hand, happens when the price makes lower highs or higher lows while the indicator shows higher highs or lower lows, typically suggesting a continuation of the current trend.
Trading Rising and Falling Wedges
Rising and falling wedges are significant patterns in forex trading, often signalling potential trend reversals. A rising wedge, formed by converging upward trendlines, often indicates a bearish reversal if it appears in an uptrend. Conversely, a falling wedge, characterised by converging downward trendlines, typically reflects a bullish reversal if it occurs in a downtrend.
Traders often look for a breakout from these patterns as a signal to enter trades. For rising wedges, a downward breakout can be seen as a sell signal, while an upward breakout from a falling wedge is often interpreted as a buy signal. When combined with divergences, this chart pattern can add confirmation and precede strong movements.
Best Practices for Trading Divergences
Trading divergence patterns in forex requires a keen eye for detail and a disciplined, holistic approach. Here are key practices for effective trading:
- Comprehensive Analysis: Before trading on divergence and wedges, be sure to analyse overall market conditions.
- Selecting the Right Indicator: Choose a forex divergence indicator that suits your trading style. Common choices include RSI, MACD, and Stochastic.
- Confirmation Is Key: It’s best to watch for additional confirmation from price action or other technical tools before entering a trade.
- Risk Management: Traders always set stop-loss orders to manage risk effectively. Divergence trading isn't foolproof; protecting your capital is crucial.
- Patience in Entry and Exit: Be patient as the divergence develops and confirm with your chosen indicators before entering or exiting a trade.
Strategy 1: RSI and Wedge Divergence
Traders focus on regular divergence patterns when the RSI is above 70 (overbought) or below 30 (oversold), combined with a rising or falling wedge pattern. The strategy hinges on identifying highs or lows within these RSI extremes. It's not crucial if the RSI remains consistently overbought or oversold, or if it fluctuates in and out of these zones.
Entry
- Traders may observe a regular divergence where both the price highs/lows and RSI readings are above 70 or below 30.
- After the formation of a lower high (in an overbought zone) or a higher low (in an oversold zone) in the RSI, traders typically watch as the RSI crosses back below 70 or above 30. This is accompanied by a breakout from a rising or falling wedge, acting as a potential signal to enter.
Stop Loss
- Stop losses might be set just beyond the high or low of the wedge.
Take Profit
- Profit targets may be established at suitable support/resistance levels.
- Another potential approach is to exit when the RSI crosses back into the opposite overbought/oversold territory.
Strategy 2: MACD and Wedge Divergence
Regarded as one of the best divergence trading strategies, MACD divergence focuses on the discrepancy between price action and the MACD histogram. The strategy is particularly potent when combined with a rising or falling wedge pattern in price.
Entry
- Traders typically observe for the MACD histogram to diverge from the price. This divergence manifests as the price reaching new highs or lows while the MACD histogram fails to do the same.
- The strategy involves waiting for the MACD signal line to cross over the MACD line in the direction of the anticipated reversal. This crossover should coincide with a breakout from the rising or falling wedge.
- After these conditions are met, traders may consider entering a trade in anticipation of a trend reversal.
Stop Loss
- Stop losses may be set beyond the high or low of the wedge, which may help traders manage risk by identifying a clear exit point if the anticipated reversal does not materialise.
Take Profit
- Profit targets might be established at nearby support or resistance levels, allowing traders to capitalise on the expected move while managing potential downside.
Strategy 3: Stochastic and Wedge Divergence
Stochastic divergence is a key technique for divergence day trading in forex, especially useful for identifying potential trend reversals. This strategy typically employs the Stochastic Oscillator with settings of 14, 3, 3.
Entry
- Traders may look for divergence scenarios where the Stochastic readings are above 80 or below 20, mirroring the RSI approach.
- This divergence is observed in conjunction with price action, forming a rising or falling wedge.
- Entry may be considered following a breakout from the wedge, which signals a potential shift in market direction.
Stop Loss
- Setting stop losses just beyond the high or low of the wedge might be an effective approach.
Take Profit
- Profit targets may be set at key support/resistance levels.
The Bottom Line
Divergence trading, coupled with the analysis of rising and falling wedges, offers a comprehensive approach to navigating the forex market. By integrating the discussed strategies with sound risk management and market analysis, traders may potentially enhance their ability to make informed decisions in the dynamic world of forex.
This article represents the opinion of the Companies operating under the FXOpen brand only. It is not to be construed as an offer, solicitation, or recommendation with respect to products and services provided by the Companies operating under the FXOpen brand, nor is it to be considered financial advice.
Risingwedgepattern

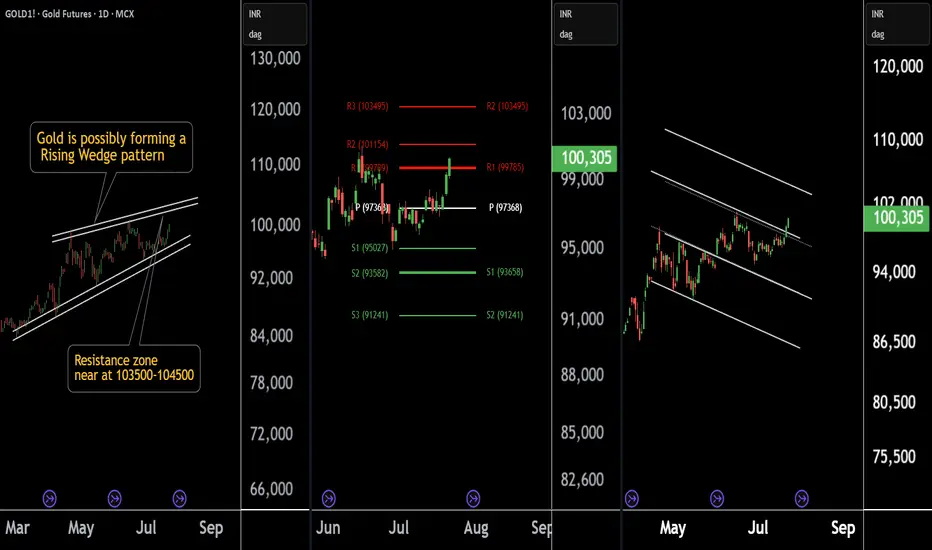
Gold at a Crossroad: Long or Short? Key Levels in FocusThere are three chart of Gold .
Gold1! is forming a Rising Wedge pattern, with resistance positioned between 103500-104000 levels.
Gold1! is facing Pivot Point resistance around the 103500 level, indicating potential supply pressure.
Gold1! is approaching the parallel channel resistance, and the upside move is nearly complete in percentage terms, with resistance around 103800-104000.
if this level sustain then we may see first of all higher prices then again fall in gold1!
Thank You !!
Dice Egypt to be monitored for a new entry - Good opportunity!Daily chart, the stock EGX:DSCW broke the lower trend-line of the rising wedge pattern. So, technically this bearish movement should test the pattern target 2.15
However, there are near relatively strong support cushion at 2.45 - 2.42, then a support level at 2.24
A new entry (buy) can be made after 2 days close above 2.51 with high volume, to target 2.75 to 2.80 (then 3.05)
Stop loss below 2.40 should be considered.

NVDA Bear may not be done chewing it up...NVDA looks like it's resuming it's downtown after a temporary recover. I'm watching to see if we get close to $100 again. If so, the door could open for $90 or even $85.
The rising wedge could still be in play here.
Good Luck & Trade Safe.

Mastering the Rising Wedge Pattern in Forex: Your Path to Profit
Are you ready to unlock the secrets of the rising wedge pattern in the thrilling world of forex trading? 🚀 In this comprehensive guide, we'll dive into the intricacies of trading this powerful chart pattern and show you how to harness its potential for profitable gains. 📊💰
Understanding the Rising Wedge Pattern 📈
The rising wedge pattern is a technical analysis formation that signals a potential reversal in the prevailing trend. Visually, it resembles a narrowing price range between two converging trendlines, with the upper trendline slanting more steeply than the lower one. This pattern suggests that buyers are becoming less enthusiastic, leading to a possible trend reversal. 📉📈
Trading the Rising Wedge: Step-by-Step Guide 📚
1. Identify the Pattern: Locate the two trendlines, ensuring there are at least two touches on the upper trendline and two on the lower trendline.
2. Confirming Volume: Observe the volume during the formation of the rising wedge. Ideally, there should be diminishing volume as the pattern develops, indicating weakening buying pressure.
3. Wait for Breakout: Anticipate a breakout below the lower trendline as confirmation of a potential downtrend. Consider using additional indicators to support your decision, such as RSI or MACD.
4. Set Stop Loss and Take Profit: Place your stop-loss above the recent swing high within the wedge, and set your take-profit level based on a reasonable risk-to-reward ratio.
Real-Life Examples 📊🔍
1. Example 1:
2. Example 2:
3. Example 3:
Unveil the potential of rising wedge patterns in forex trading and elevate your trading game today! 📈🔼🔽 Don't miss out on this opportunity to navigate the markets with greater confidence and precision. 💼🤑
Hey traders, let me know what subject do you want to dive in in the next post?

SPX 500 Analysis(Rising Wedge Pattern)!SPX 500 Analysis on Weekly Timeframe!
Rising Wedge Pattern in SPX500
Rising Wedge Pattern Formation after a Strong Downtrend
SPX500 was in downtrend before now we are seeing a temporary uptrend but if we observe carefully it is an unstructured uptrend, for trend reversal it has to break 4323.56 level. Now SPX500 has formed a Rising Wedge Pattern. This pattern formation happened after a long down move. Now SPX500 is taking a pause and trading inside a wedge. If SPX500 able to break Support Trendline then the Primary trend will continue which is a Downtrend. I have done all important Analysis on the chart. I hope this will help you to forecast the further direction of SPX500.

📈How to Trade: Rising Wedge Pattern📌 What is the Rising Wedge Pattern?
The rising wedge is a bearish chart pattern found at the end of an upward trend in financial markets. It suggests a potential reversal in the trend. It is the opposite of the bullish falling wedge pattern that occurs at the end of a downtrend. Traders recognize the rising wedge as a consolidation phase after a medium to long-term trend, indicating a decrease in momentum. Traders often use this pattern as a signal to take a short-selling position or exit their current position.
📊 How to Identify and Use the Rising Wedge
🔹 Identify an existing trend in a currency pair.
🔹 Draw support and resistance trend lines along with the highs and lows of the trend.
🔹 Wait for price consolidation and the contraction of the support and resistance lines, forming a rising wedge pattern.
🔹 Observe the upper trend line acting as resistance and the lower trend line acting as support, converging towards each other.
🔹 Place a sell order once the price breaks below the support line of the rising wedge pattern.
🔹 Set a stop-loss order at the same level as the support trend line to manage risk in case the price reverses.
🔹 Consider setting a profit target based on the distance between the highest and lowest points of the wedge pattern or by using a technical indicator or a previous support level as a reference.
💥 Key Takeaways:
🔸 The rising wedge is a technical chart pattern used to identify possible trend reversals.
🔸 The pattern appears as an upward-sloping price chart featuring two converging trendlines.
🔸 It is usually accompanied by decreasing trading volume.
🔸 A rising wedge is often considered a bearish chart pattern that indicates a potential breakout to the downside.
🔸 Wedges can either form in the rising or falling direction.
👤 @QuantVue
📅 Daily Ideas about market update, psychology & indicators
❤️ If you appreciate our work, please like, comment and follow ❤️


Very low volume on HT token. Between 9 and 10$ topI'm bearish on HT. Justin Sun is actually hated in Chinese media for pumping and dumping his own coins. He probably bought cheap and will also dump on you. The volume profile is showing incredible low volume. It will top around 9 and 10$. I shorted 1x with tight stop loss.

PTBA in Retest ⚠️⚠️⚠️PTBA . Daily TF. Rising wedge pattern. Has broke the trendline support and go to the retest area (support that become resistance). Be carefull. It might do down if it rejected. Or if it enter the wedge area again and breakout the wedge, it is become bullish and cancel the bearish.

Two shapes of Rising Wedge PatternsI have explained about Rising Wedge Patterns on this Tutorial in detail.
Rising Wedges are bearish pattern and it generates bearish signal; Rising Wedge Patterns forms with Higher Highs and Higher Lows.
Rising Wedge pattern basically forms in two shapes ; If rising wedge pattern forms in an uptrend it will make reversal and if rising wedge pattern forms in a downtrend it will make continuation.
The higher highs and the lower lows along makes a trend resistance and trend support. When breakout occurs downside, price breaks the trend support line.
In rising wedge breakout occurs downside 60 to 70% of the time.
To confirm a true breakout, we can take help of Volume indicator. In a true breakout there will be big volume than usual.
We should use other indicators like MACD and RSI also to confirm that it will turn bearish before taking entry in a trade. (We can see MACD divergence, RSI Divergence and where the RSI is...)
Thank You;
Stay Tuned 👍, more tutorials and strategies coming!
