Risk-to-Reward and Journaling : Track, analyze, and evolve
📈 Mastering the Markets: Why Risk-to-Reward and Journaling Are Every Trader’s Edge
In trading, profitability isn't just about making winning trades — it's about managing risk smartly and learning from every position. Two of the most underrated habits that separate amateurs from consistent traders are:
1. Understanding Risk-to-Reward (R:R)
The risk-to-reward ratio is the foundation of trade planning. It's a simple calculation of how much you're willing to risk versus how much you aim to gain. A ratio of 1:2 means you risk $1 to potentially make $2.
✅ Why it matters:
Even with a 40% win rate, a positive R:R can still yield profitability.
It disciplines your entries, stops, and targets — no more emotional exits.
It forces you to filter out trades that don’t offer enough upside.
📊 For example, if you take 10 trades risking $100 each with a 1:2 R:R:
Win 4 = $800 gain
Lose 6 = $600 loss
Net Profit = $200 despite winning less than half.
2. The Power of Journaling
Trading without a journal is like flying blind. Your memory fades, but data doesn’t lie. A trading journal helps you:
🧠 Improve strategy by analyzing what works (symbols, timeframes, setups)
📉 Spot patterns in losses — overtrading? wrong R:R? bad timing?
📈 Stay disciplined — journaling enforces accountability
📒 Capture emotions — was it fear or FOMO? A journal tracks mindset too.
In my experience, journaling alone can boost a trader’s edge more than tweaking indicators. It turns experience into insight.
🎯 Final Word
The market rewards preparation, not prediction. A solid risk-to-reward framework keeps you in the game. Journaling turns your trades into tuition. Together, they compound your growth.
Happy Trading
Risk!!!
GBP/JPY Low Risk BUYS - SWINGLOW RISK TRADE
If you prefer not to swing you can scalp buys on the pullbacks throughout the week ahead.
GBP/JPY - BULLISH ENGULFING CONFIRMED
A+ SETUP since it has touched
and respected our area of interest.
SL - 185.599
TP1 - 190
TP2 - 192.799
TP3 - 194.681

Mastering Risk Management: The Trader’s Real EdgeYou’ve all heard it,
“Cut your losses and let your winners run.”
Simple words — but living by them is what separates survivors from blown accounts.
Here’s some tips on how to approach risk management when trading:
☑️ Risk is always predefined: Before I click Buy or Sell, I know exactly how much I’m willing to lose. If you don’t define risk upfront, the market will do it for you.
☑️ Position sizing: Never risk more than 1–2% of your account per trade. Small losses mean you can keep taking high‑probability setups without fear.
☑️ Always use a stop‑loss: No stop? You’re not trading — you’re gambling.
☑️ Stop‑loss discipline: Place stops where the market proves you wrong — not where it “feels comfortable.” Then leave them alone.
☑️ Focus on risk/reward, not win rate: A 40% win rate can still be profitable if your average reward outweighs your risk.
☑️ Risk/reward ratio: Only take trades with at least a 2:1 or 3:1 potential. You don’t need to win every trade — your winners should pay for your losers (and more).
Remember:
“It’s not about being right all the time. It’s about not losing big when you’re wrong.”
Risk management won’t make your trades perfect — but it will keep you trading tomorrow.
And in this game, staying in the game is everything.
💭 How do you handle risk in your trading? Drop your strategy or tip in the comments — let’s share and learn together! 👇
Thanks again for all the likes/boosts, we appreciate the support!
All the best for a good week ahead. Trade safe.
BluetonaFX

SPX Is Pure RiskAbsolutely insane for people to be saying things like "a new bull market" when it never ended. All of the risk is to the downside. If markets ran another 10% to the upside that gives investors a chance to determine if they want to buy a correction to see new highs or not. But to say that a bull market is coming is the antithesis of thinking when current risk is all downside.
This is risk management 101:
Lets say you have a SP:SPX target of 10,000, would you rather buy it at 6,500 where you know your downside is 7-8% or right here at 6300 with a potential downside of 22%+?
Who in the market is long right now? Everyone because all the short sellers are stopped out, and the dumbest of money the guys who just got promoted to the rank of captain in the branch of hindsight bought the "breakout."
The retracement to the highs has been one of the most hated rallies off of a bounce ever seen and why? Because it required a large amount of vibes and to a degree stupidity to buy where it bounced but it paid off. So if it was borderline stupid to do that, what does it mean to lever up at the top?
The correct method is to either be short here or be patient for a breakout with volume and a successful retest. There you can limit your downside and have nearly unlimited upside if it plays out that way.

Risk and Probability in Trading — Why Risk Assessment MattersRisk and Probability in Trading — Why Risk Assessment Matters More Than Chasing the “Holy Grail”
In trading, most participants and analysts are focused on finding the so-called “Holy Grail” — the perfect entry point where the price moves in the desired direction and yields profit. However, few actually assess the risks involved, as if success is possible without factoring them in. Market reviews are often filled with levels, forecasts, and price directions, but rarely include probability estimates or potential losses.
In my view, the real Holy Grail isn't a guaranteed profitable entry, but a scenario where the market offers a position with minimal risk relative to historical context. To identify such setups, we need a risk scale based on historical data — how favorable the current risk-to-reward ratio is compared to the past.
It’s also crucial to understand that no one can predict price direction with certainty. The key to opening a position is not hope, but evaluating all possible scenarios — upward, downward, or sideways — and knowing the outcome in each case. Risk management is more than just placing a stop-loss; it’s a structured approach that should be central to any trading strategy.
What Are Minimal Risks?
“Minimal risk” is a relative concept — it only makes sense when measured against a defined scale. Building such a scale requires historical statistics: what were the maximum and minimum losses and profits for similar positions in the past?
Profit-to-Loss Ratio
The idea behind the search for the “Holy Grail” is to find moments when the market offers the best possible profit-to-risk ratio. For example, if the current ratio is 10, and historically it has ranged from 0 (low risk) to 100 (high risk), then 10 may be a good entry point. If the ratio approaches 80–90, it signals that the position is extremely risky.
Why Are Probability and Risk Assessment Important?
Market reviews often talk about resistance levels, volatility, and price direction — but rarely address the risks of different scenarios. No expert can predict market movements with certainty — if they could, they’d be billionaires. Opening positions without accounting for risks and scenario probabilities is extremely dangerous.
How to Factor in Risks When Entering a Position
The key question is: what will the profit-to-loss ratio be after entering a position, depending on whether the price goes up, down, or stays flat? It’s important to understand the consequences of each case and make decisions based on risk assessment.
Risk Management Must Account for the Inability to React Instantly
Conventional tools like stop-losses and limit orders often fail to protect capital effectively during sudden price spikes. These tools are particularly vulnerable when market makers or high-frequency algorithms trigger stop levels en masse.
This highlights the need for more resilient risk management instruments — ones that can respond to volatility instantly and automatically. Options are one such tool, capable of limiting losses regardless of market dynamics.
Without robust risk management, long-term profitability becomes statistically unlikely. Sooner or later, the market will present a scenario that can wipe out your capital — unless you’re properly protected.
Important note: this is not an endorsement of options or any specific broker. It’s simply a conclusion based on the logic of building effective capital protection. If a broker only provides access to linear instruments (futures, spot, stocks) without the ability to hedge, it will inevitably lead to capital erosion — even for systematic traders.
And if this article gets more than 100 rockets, I’ll continue sharing specific examples of low-risk trading assessments.

Crude Oil Prices Rocketing amid geopolitical risks
NYMEX:CL1! NYMEX:MCL1! NYMEX:BZ1!
Macro:
Geopolitical tensions remain high and markets are now likely to price in our scenario discussing ongoing air and missile war, given one-off intervention from the US thus far. According to Reuters, the U.S. now assesses that Iranian retaliation could occur within the next two days.What happens next is anybody’s guess but as traders, it is important to navigate these uncertainties with scenario planning and/or reduce risk to account for increased volatility.
We also get Services and Manufacturing PMI data today and PCE Price Index on Friday. Chair Powell is set to testify on Tuesday 9am CT.
Key levels:
Jan 2025 High: 76.57
2025 High: 78.40
2025 CVAH(Composite Value Area High): 75.68
Key LIS zone: 73.50-73.15
We anticipate the following scenarios in crude oil:
Scenario 1:
Prices remain elevated as tensions remain high, despite limited retaliation, however, the situation overall now escalated beyond return to diplomacy.
Scenario 2:
Any push towards de-escalation, unlikely in our analysis, but given the headline risk, crude prices may remain volatile and come off the highs.
Given our key LIS (Line in Sand) zone above, we favor longs above this and shorts below this zone.

S&P 500 Daily Chart Analysis For Week of June 20, 2025Technical Analysis and Outlook:
The S&P 500 Index has primarily exhibited downward trends during this week’s abbreviated trading session, narrowly failing to reach the targeted Mean Support level of 5940, as outlined in the previous Daily Chart Analysis. Currently, the index exhibits a bearish trend, suggesting a potential direction toward the Mean Support level of 5940, with an additional critical support level identified at 5888.
Contrariwise, there exists a substantial likelihood that following the accomplishment of hitting the Mean Support of 5940, the index may experience recovery and ascend toward the Mean Resistance level of 6046. This upward movement could facilitate a resilient rally, ultimately topping in the completion of the Outer Index Rally at 6073, thereby enabling the index to address the Key Resistance level situated at 6150.

EUR/USD Daily Chart Analysis For Week of June 20, 2025Technical Analysis and Outlook:
During this week's trading session, the Eurodollar has encountered a significant decline, dipping below the Mean Support level of 1.149; however, it exhibited a modest recovery on Friday. Recent analyses indicate that the Euro is likely to decrease further to the Mean Support level of 1.148, with the potential for extending its bearish trend to reach 1.140. Nevertheless, there remains a possibility that the current recovery will persist, which could result in price movements targeting the Key Resistance level at 1.158 and potentially leading to a retest of the Outer Currency Rally's 1.163 mark.

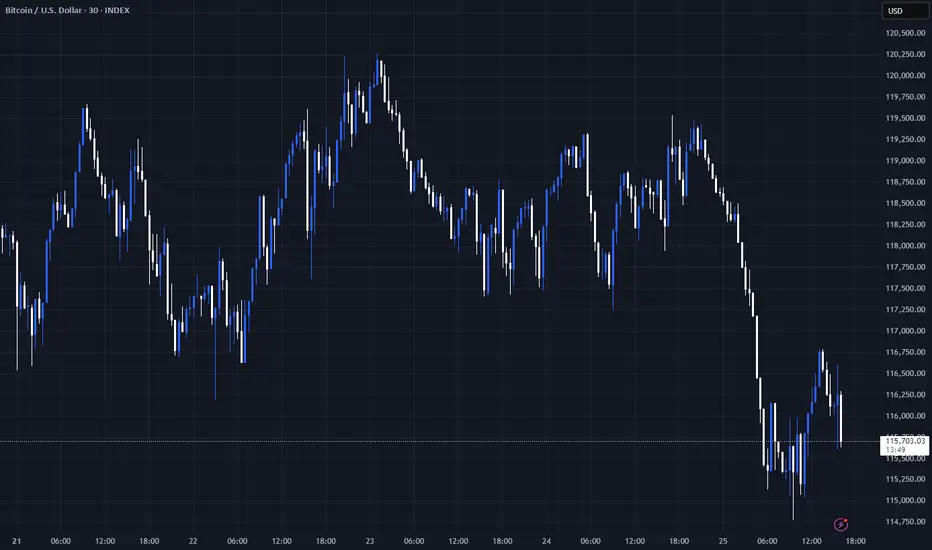
Bitcoin(BTC/USD) Daily Chart Analysis For Week of June 20, 2025Technical Analysis and Outlook:
In the recent trading session, Bitcoin exhibited an upward trend; however, it subsequently experienced a significant decline from the established Mean Resistance level at 110300. On Friday, Bitcoin exhibited notable price action, characterized by a pump-and-dump scenario. At this juncture, Bitcoin is retracing downwards as it seeks to approach the Mean Support level at 101500 and the ultimate Inner Coin Dip at 96500. It is essential to acknowledge the potential for an upward rally from the Mean Support levels of $101500 and/or the Inner Coin Dip at $96500. Such a rally could culminate in a retest of the Mean Resistance level at $107000.

Rising Geopolitical Tension (Iran Conflict) Signals Market RiskMoving Partially to Cash (VEA, QQQ, TQQQ, SPY, TECL, SOXL)
The global market is entering a high-risk environment. Geopolitical escalation, particularly the growing threat of direct US involvement in a military conflict with Iran, is pushing global uncertainty to new highs. Tensions in the Middle East, rising oil and gold volatility, and increased friction between major world powers all point toward a potential market breakdown. On the chart, VEA ETF is showing signs of topping out within a rising wedge pattern. Meanwhile, institutional funds are starting to reduce exposure to high-risk assets. I'm taking partial profits and shifting to cash across VEA, QQQ, TQQQ, SPY, SOXL, and TECL to preserve gains. Buy-back zones are set around 53.00, 48.00, and 44.00. In an environment of global escalation and rapid risk-off sentiment, active portfolio defense is more important than passive hope.

WTI on high time frame , price reach 60$?
"Hello friends, focusing on WTI, the price is currently in a bullish trend on the daily time frame. During the last NY session, the price swept liquidity in the $66 zone and faced a strong rejection. Considering both technical analysis and fundamental news, I believe the price is gearing up for a decline, with the initial target likely around $60."
If you need further clarification or have more details to discuss, feel free to share!

Risk Can be Taken at Re-test of Breakout Level.Cup & Handle Formation.
Breakout from the main Resistance level
around 25.
Possible Targets can be around 30 - 31.
Breaking 23 will bring more Selling Pressure.

05-25-25 Risk Containment & Trading Strategy ExamplesSkilled Traders have learned to manage risk levels using techniques that allow them to preserve capital and move their assets towards future successful traders.
Some beginner traders get stuck trying to swing for the fences.
In this video, I try to share a common Fibonacci price/strategy technique where traders can attempt to limit risks while learning to identify efficient successful trade triggers.
Remember, taking a trade is the easy part. Protecting and growing your capital is much more difficult.
Please use the techniques in this video to learn how to protect and manage your capital.
Get some.
Happy Memorial Day.
#trading #research #investing #tradingalgos #tradingsignals #cycles #fibonacci #elliotwave #modelingsystems #stocks #bitcoin #btcusd #cryptos #spy #gold #nq #investing #trading #spytrading #spymarket #tradingmarket #stockmarket #silver

The last 4 previous Stockmarket Fear spikes were great buys...for Bitcoin, allowing investors to enhance their long-term holdings.
Purchasing risk assets when the #VIX exceeds 50 and over 20% of stocks fall below their 200-day moving average has consistently yielded positive returns, with a success rate of one hundred percent when evaluated one week, one month, and three months later.
This particular scenario has only happened 11 times in the history of the S&P 500, and the reading from Monday, April 7th, marked one of those rare instances.
#BTFD

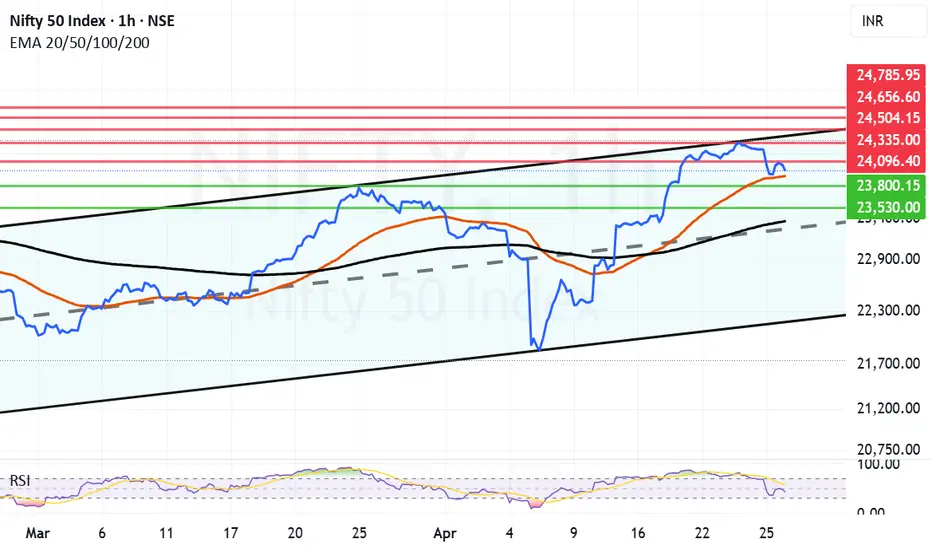
Despite Geo-Political tensions, Nifty closes above Mother line. It was quite remarkable for Nifty to close above the Mother line (50 Hours EMA) despite the Geo-Political tensions and brewing storm of escalations at border. This shows the character of not only Indian market but the resilience of India as a nation. In yesterday's post itself we had mentioned that strong technical resistance has been reached. Add the tension and intent of India to fight against terrorism so it was a perfect recipe for a major fall. Which may happen if things escalate further next week but recovering from 23847 and to close above 24K at 24039 shows that when things will be back to normal the indices will bounce back. Resistance for Nifty now remain at 24096, 24335 and 24504. Supports for Nifty remain at 23914 (Major Mother line support) of 50 Hours EMA, 23800, 23530 and finally 23363.
While Long term players, FII, HNI and DII look at such opportunities to invest for Retail trader it becomes very difficult to control their emotions in such an environment of Geo-political pressure and then we saw a huge fall in the market. The opportunity was seized by both DII and FII with both hands as both turned net buyers for Rs.6492+ Crores. So traders / investors should always avoid knee jerk reactions. Who knows what happens during the weekend the support and resistance levels to watch out for are already mentioned in the message.
Disclaimer: The above information is provided for educational purpose, analysis and paper trading only. Please don't treat this as a buy or sell recommendation for the stock or index. The Techno-Funda analysis is based on data that is more than 3 months old. Supports and Resistances are determined by historic past peaks and Valley in the chart. Many other indicators and patterns like EMA, RSI, MACD, Volumes, Fibonacci, parallel channel etc. use historic data which is 3 months or older cyclical points. There is no guarantee they will work in future as markets are highly volatile and swings in prices are also due to macro and micro factors based on actions taken by the company as well as region and global events. Equity investment is subject to risks. I or my clients or family members might have positions in the stocks that we mention in our educational posts. We will not be responsible for any Profit or loss that may occur due to any financial decision taken based on any data provided in this message. Do consult your investment advisor before taking any financial decisions. Stop losses should be an important part of any investment in equity.
2018 Cycle Repeat? Bullish Bitcoin Until End of YearSee my DXY analysis for my full view on the performance on bitcoin (and other risk assets as well)
-Summary- bullish like 2018 until end of year.
-This chart pointing out time frames of past cycles, the over all market structure of bitcoins price, and the transformation of a bullish trend into the parabolic. (where I think we are now)

Crypto Risk Management: The Most Overlooked EdgeIn the thrilling yet unforgiving world of crypto, profit potential is massive—but so is the risk. Every trader or investor enters the space with dreams of 10x gains, but without a solid risk management strategy, many exit just as fast—with a trail of losses.
Risk management is the art of protecting your capital while giving yourself the best shot at long-term profitability. It’s not just a skill; it’s a survival strategy.
What Are the Risks in Crypto?
Crypto markets are unique—24/7, global, and driven by emotion, hype, and tech disruption. With that come several risk categories:
Market Risk – Volatile price swings can wipe out unprepared traders.
Liquidity Risk – Low-volume coins can be hard to exit during dumps.
Regulatory Risk – Government crackdowns or bans (e.g., Binance or XRP cases).
Security Risk – Hacks, rug pulls, phishing scams, and smart contract bugs.
Operational Risk – Mistakes like sending funds to the wrong address or using faulty bots.
These risks aren’t just theoretical—think of the LUNA/UST collapse or the FTX debacle. Billions were lost due to poor risk management at multiple levels.
🧠 Core Principles of Risk Management
To stay in the game long-term, you need to adopt some fundamental principles:
Preserve capital first, profit later.
Risk small, aim big.
Never risk more than you can afford to lose.
Think in probabilities, not certainties.
Be consistent, not lucky.
Even the best traders lose—but they survive because they manage their downside better than the rest.
🛠️ Tools & Techniques That Can Save Your Portfolio
1. ✅ Position Sizing
Don’t bet your whole stack on one trade. A common approach is to risk 1–2% of your portfolio per trade. That way, even a streak of bad trades won’t destroy your capital.
2. 🛑 Stop-Loss & Take-Profit
Always have predefined stop-loss levels to cut losses, and take-profit targets to lock in gains. Trading without a stop-loss is like driving without brakes.
3. 📊 Diversification
Spread your investments across different sectors (DeFi, AI, Layer 1s, etc.). Don’t rely on one narrative or one coin.
4. ⚖️ Leverage Control
Leverage can amplify gains—and losses. Avoid high leverage unless you’re an experienced trader with a tight plan.
5. 🔁 Portfolio Rebalancing
Adjust your allocations periodically. If one asset balloons in value, rebalance to lock in gains and manage exposure.
6. 💵 Using Stablecoins
Stablecoins like USDT, USDC, or DAI are great for hedging during volatility. Park profits or prepare dry powder for dips.
🧠 Psychological Risk: The Silent Killer
Many traders don’t lose due to bad analysis—they lose to emotions.
FOMO leads to buying tops.
Fear leads to panic selling bottoms.
Revenge trading after losses leads to bigger losses.
Greed blinds you from taking profits.
The key is discipline. Create a plan, follow it, and review your mistakes objectively.
🚫 Common Mistakes to Avoid
Going all-in on one trade or coin
Holding through massive drawdowns hoping for a recovery
Ignoring stop-losses
Overleveraging small positions to “win it all back”
Risk management is about avoiding unnecessary pain, not killing your gains.
🧭 Final Thoughts
The best traders in crypto aren't those who win big once—they're the ones who survive long enough to win over and over. Risk management is your edge in a market that respects no one.
Whether you’re a scalper, swing trader, or long-term HODLer, never forget: capital is your lifeline. Guard it with your strategy, protect it with your plan, and grow it with patience.
✍️ By Green Crypto
Empowering traders with analysis, tools, and education. Stay sharp. Stay profitable.

$BTC is facing a systemic threat—and it's becoming real.This post is a follow-up to my highly controversial idea from last year:
Back then, many laughed and called me a fool. But it's happening:
Forbes: "Quantum Leap or False Alarm? Bitcoin’s Fate in the Quantum Age"
www.forbes.com
CoinDesk: "Bitcoin Developer Proposes Hard Fork to Protect BTC from Quantum Threats"
www.coindesk.com
Key points:
Bitcoin is not digital gold. It can be hacked.
We have about 5 years to move to quantum-resistant encryption.
This requires a hard fork, forcing all BTC holders to move their coins to a new wallet.
Those who don’t move their coins? They’re burned—permanently lost.
How?
Quantum computers can use a “long-range attack” to derive private keys from public keys. In early BTC transactions, public keys were visible—around 2 million BTC are at risk.
Consequences:
Two chains will coexist: BTC (legacy) and BTC (quantum-safe).
SegWit adoption took 2 years. Expect similar delays.
2 million BTC could be lost forever (≈10% of supply).
Satoshi’s coins? Gone.
We'll have BTC, BTCQ, and BCH side by side.
Why would whales support this?
Removes inactive or lost coins
Doubles their holdings across chains
Protects their assets from being hacked
Is this bullish? Should you buy BTC?
Not sure. This is a systemic risk. The panic from Bitcoin developers says it all.
I warned you. Read my original post. Follow me to stay ahead of what’s next.
📉 Potential consequences
Bitcoin chain split: Legacy chain vs. upgraded chain (like BTC/BCH but even messier).
Burned coins: Could cause a deflationary shock if millions of old coins become inaccessible.
Temporary loss of trust: Confusion = market panic. Price volatility could spike.
Regulatory scrutiny: Governments could use this as an excuse to push CBDCs or new crypto laws.
New “Bitcoin” brand wars: Just like the BCH/BSV split, there may be competing narratives.
Can the developers fix this problem?
Yes, developers can upgrade Bitcoin to be quantum-safe.
But the real danger lies in:
Coordination failure
Loss of user trust
A messy migration
Potential devaluation of old BTC
Legal and branding chaos
#Bitcoin #BTC #CryptoNews #QuantumComputing #CryptoRisk #HardFork #Blockchain #CryptoSecurity #SatoshiNakamoto #CryptoWarning #DYOR #Altcoins #BTCFork #BitcoinUpdate #QuantumThreat

XOM Analysis: Oil's Next Move & Policy ShiftsNYSE:XOM currently piques my interest, particularly with oil prices potentially stabilizing or rising further. Recent geopolitical developments and policy shifts under Trump’s administration—such as rolling back Biden-era energy regulations, reducing methane fees, and easing LNG export permits—could significantly influence the energy landscape.
My intuition suggests Trump’s "Mar-a-Lago Accord" might involve major global economies reducing holdings of US dollar assets, swapping short-term treasuries for century bonds. Such currency shifts and reduced drilling activity could lead to a tighter oil supply, benefiting prices. Additionally, a weakening US dollar could positively impact technology stocks, as investors rotate towards sectors less affected by traditional commodities.
Technical Analysis (Daily & Hourly Chart)
Current Price: Approximately $103.00
Key Resistance Levels:
Immediate resistance: $103.93 (L.Vol ST 1b)
Important resistance zone: $104.74 (118 AVWAP)
Critical resistance (Last week's high): ~$106.46
Key Support Levels:
Near-term support: $101.13 (Weeks Low Long)
Major support: $97.92 (Best Price Short)
Trading Scenarios
Bullish Scenario (Continued oil strength & supportive policy shifts):
Entry Trigger: Sustained breakout and close above immediate resistance at $103.93.
Profit Targets:
Target 1: $104.74 (AVWAP resistance)
Target 2: $106.46 (recent swing high)
Stop Loss: Below recent pivot around $101.00, limiting risk effectively.
Bearish Scenario (Oil price weakness or production surge):
Entry Trigger: Failure to sustain the above resistance at $103.93 or a breakdown below near-term support at $101.13.
Profit Targets:
Target 1: $99.00 (psychological & short-term support)
Target 2: $97.92 (strong support, ideal short target)
Stop Loss: Above $104.75 to control risk in case of a reversal.
Thought Process & Final Thoughts
Given the current geopolitical and regulatory environment, XOM appears poised for potential upside if oil prices remain strong and policy shifts materialize. However, caution is warranted, as oil companies seem hesitant to increase production due to profitability concerns. Clearly defined technical levels will help navigate trade entries and exits effectively around these evolving macroeconomic conditions.
Earnings Date: May 2nd—Keep positions nimble as earnings can significantly impact short-term volatility.

Monetary System - Blowout Monitor!If you don't know what these mean ask Perplexity AI, et al.
You want to own assets with decreasing volatility. You want to sell assets when volatility increases. In fact the CTA funds, have a volatility control metric for buy or selling.

TESLA Always Pay YOURSELF! Tsla Stock were you PAID? GOLD Lesson
⭐️I want to go into depth regarding the this topic but it is a long one with PROS & CONS for doing and not doing it.
Every trader must choose what's best for them but you will SEE when I finally get to the write up that MANY OF THE PROS are NOT FINANCIAL but PSYCHOLOGICAL❗️
Another of 🟢SeekingPips🟢 KEY RULES!
⚠️ Always Pay YOURSELF.⚠️
I know some of you chose to HOLD ONTO EVERYTHING and place your STOP at the base of the WEEKLY CANDLE we entered on or the week priors base.
If you did that and it was in your plan GREAT but... if it was NOT that is a TRADING MISTAKE and You need to UPDATE YOUR JOURNAL NOW.
You need to note EVERYTHING. What you wanted to see before your exit, explain why not taking anything was justified to you, were there EARLY exit signals that you did not act on. EVERYTHING.
🟢SeekingPips🟢 ALWAYS SAYS THE BEST TRADING BOOK YOU WILL EVER READ WILL BE YOUR COMPLETE & HONEST TRADING JOURNAL ⚠️
📉When you read it in black amd white you will have YOUR OWN RECORD of your BEST trades and TRADING TRIUMPHS and your WORST TRADES and TRADING ERRORS.📈
✅️ KEEPING an UPTO DATE JOURNAL is STEP ONE.
STUDYING IT IS JUST AS IMPORTANT👍
⭐️🌟⭐️🌟⭐️A sneak peek of the LESSON after will be HOW & WHEN TO ENTER WHEN THE OPEN BAR IS GOING THE OPPOSITE WAY OF YOUR IDEA.👌
🚥Looking at the TESLA CHART ABOVE you will see that we were interested in being a BUYER when the weekly bar was BEARISH (GREEN ARROW) and we started to consider TAKE PROFITS and EXITS when the (RED ARROW) Weekly bar was still BULLISH.🚥

EURUSD Short with Risk Manager ToolI received some messages about the Risk Manager Indicator.
This indicator was created by me and it calculates the Lot Size you need to enter in order to follow your risk management rules.
You just need to fill the % of your balance you want to risk on each trade, the entry price and the number of pips of your stop loss. Then the indicator automatically calculates the position size.
It works on XAU, FOREX, OIL and US100/MNQ1! markets.
It's a private indicator and it's available on my website.

DXY, bullish or bearish?Welcome back!
Today i'm posting a small idea on the DXY. Usually i cover crypto but the macro is important. A weak dollar correlates with more risk being taken and a strong dollar with less risk being taken. Hence my analysis of the DXY.
In the above chart a couple of things can be seen which makes the outlook hard to predict.
On one side there is a bullflag on the monthly timeframe with a target of 130!
On the other side, looking under we can see a bearish MACD cross and a bearish stoch RSI. On average it takes half a year to a year for a cross like this to recover.
This causes me to be bearish on the dollar and bullish on risk-on assets.
Thanks for reading
