AUD/JPY: Fading the Rally at a Major Resistance ZoneWhile AUD/JPY has been in a clear uptrend, the rally is now approaching a significant technical ceiling where sellers have previously stepped in. We see a compelling opportunity for a counter-trend short, betting that this resistance level will hold and that the current bullish momentum is showing signs of exhaustion.
This trade is for those watching for a market turn, offering a well-defined risk-to-reward setup for a swing position.
🤔 The "Why" Behind the Short Setup
📰 The Fundamental Risk
The Australian Dollar is a "risk-on" currency, meaning it performs well when global markets are optimistic. The Japanese Yen, however, is a classic "safe-haven" asset that strengthens during times of uncertainty. With the upcoming high-impact Australian CPI data, any sign of economic weakness could disappoint the market, increase pressure on the RBA, and trigger a "risk-off" move that would benefit the Yen and send AUD/JPY lower.
📊 The Technical Ceiling
The chart tells a clear story. The price is currently testing a major resistance zone. Attempting to short near a strong ceiling like this provides a strategic entry to capture a potential trend reversal. We are essentially betting that the trend's multi-week momentum will stall and reverse from this key technical juncture.
✅ The High-Clarity SHORT Trade Setup
📉 Pair: AUD/JPY
👉 Direction: Short
⛔️ Entry: 96.716
🎯 Take Profit: 92.080
🛑 Stop Loss: 98.907
Rationale: This setup plays for a significant swing move. The wide stop loss is designed to withstand volatility from news events, while the deep take profit targets a full reversal back to major support levels seen earlier in the year.
Riskoff

NZD/JPY: Bearish Wedge Before RBNZ CatalystThis is a high-conviction trade idea for NZD/JPY , where a perfect storm of technical and fundamental factors is aligning for a significant short opportunity. The setup is clean, the reasoning is strong, and we have a clear catalyst on the horizon. 🚀
Fundamental Analysis 🌪️
The macro picture is the primary driver here, creating a powerful bearish case.
1️⃣ Monetary Policy Divergence (🇳🇿 vs 🇯🇵): This is the core engine of the trade. The Reserve Bank of New Zealand (RBNZ) is dovish, signaling rate cuts amid a fragile domestic economy. In stark contrast, the Bank of Japan (BoJ) is hawkish, having started a historic policy normalization to combat persistent inflation. This fundamental clash is strongly bearish for NZD/JPY.
2️⃣ Risk-Off Catalyst (🇺🇸): The market is nervous ahead of the July 9th US tariff deadline . This uncertainty is creating a classic "risk-off" environment, which typically strengthens the safe-haven JPY and weakens risk-sensitive currencies like the NZD.
3️⃣ The RBNZ Decision (🏦): The main event on July 9. The market expects a "dovish hold," meaning even if rates are unchanged, the forward guidance will likely be very cautious, highlighting economic risks and signaling future cuts. This is the catalyst that could trigger the sell-off.
Technical Analysis 📉
The 4H chart provides crystal-clear confirmation of the fundamental weakness.
1️⃣ Bearish Rising Wedge: Price is being squeezed into a classic bearish reversal pattern. This shows that buying pressure is exhausted, and the market is preparing for a move to the downside.
2️⃣ Key Resistance Zone: The wedge is pushing directly into a heavy supply zone between 87.80 and 88.00 . This area has acted as a firm brick wall 🧱, rejecting multiple attempts to move higher.
3️⃣ RSI Momentum: The RSI below the chart confirms the weakening momentum. It's failing to show strong bullish power, which supports the price action and signals that the uptrend is running out of steam. 💨
The Trade Plan 🎯
Based on this analysis, the plan is to enter with a limit order to get an optimal entry price on a potential final spike into resistance.
Direction: Short (Sell) 📉
Order Type: Limit Sell
Entry: 87.80 📍
Stop Loss: 88.40 🛡️
Take Profit: 86.00 💰
Risk/Reward Ratio: 1:3 ⭐⭐⭐
This setup presents a rare confluence of fundamental divergence, technical weakness, and a clear catalyst.
Trade safe and manage your risk.

Upward Momentum, Caution Near 106,500–110,000 Resistance__________________________________________________________________________________
Technical Overview – Summary Points
Momentum: Strong bullish bias on mid/long-term (1D-4H), short-term "Down" divergences (1H/2H). Overall alignment, no capitulation/euphoria signals.
Key supports / resistances: Supports at 103,300/102,600 (D Pivot Low, 720 Pivot). Major resistances: 106,480–109,952. Price compression under daily/weekly resistance, technical rejection risk.
Volumes: Normal to moderately high, 1H abnormal volumes signal possible squeeze.
Multi-TF: Bullish confluence 1D–6H, short-term Down divergences, caution required for late long entries under resistance.
Risk On / Risk Off Indicator: "Strong Buy" signal consolidated across all timeframes except 15min (neutral ST), sector bullish.
ISPD DIV: Neutral on all TFs – no behavioral overheating or exhaustion.
__________________________________________________________________________________
Strategic Summary
Overall bias: Bullish HTF setup (1D–4H), buy opportunities on dips towards 103,300/102,600, stop <102,000.
Risk zones: 106,480–109,950 = resistance cluster, active management required. Technical invalidation below 102,000.
Macro catalysts: Window of increased volatility 15:00–16:00 UTC (CB Consumer Confidence & Powell speech). Middle East geopolitics = “wildcard”, caution on any escalation.
Action plan: Buy on pullback, manage actively >106,000, mandatory protection during news hours, reassess post-macro-volatility.
__________________________________________________________________________________
Multi-Timeframe Analysis
1D & 12H: Upward momentum confirmed, solid supports, no exhaustion signals, Risk On / Risk Off Indicator "Strong Buy".
6H–4H: Technical and behavioral confirmation, constructive volumes, caution near immediate resistances.
2H–1H: Short-term downside divergence, 1H very high volumes = potential squeeze or shakeout, active caution required under resistance.
30min–15min: Consolidation/digestion; Risk On / Risk Off Indicator neutral at 15min, no impulsive entry point yet.
Summary: Robust up-structure on HTF, buy-side strategies on dips favoured, active management imperative near resistance and macro volatility events.
__________________________________________________________________________________
Fundamental, On-Chain & Macro Risks Analysis
Macro news: No immediate catalysts except USD news (CB Consumer Confidence, Powell) at 15:00-16H00 UTC, source of temporary volatility – no prevailing trend in question at this stage.
On-chain / Market: High volumes, institutional leadership, no “retail” panic, no flush/fomo, healthy structure.
Leverage: OI >$95B, stablecoin dominance, risk contained except on external triggers (macro, geopolitical).
Geopolitics: Middle East context = spike risk, active management mandatory on escalation.
__________________________________________________________________________________
Summary:
• Dominant bias Up (buy on dips >102,600), active management below major resistances (106,500–110,000).
• Key stop <102,000 (invalidation).
• Increased risk window: 15:00–16:00 UTC (USD news).
• Monitor leverage, adjust exposure ahead of key catalysts.

BTC to 42k 2025 possibly lower
### 🔎 **1. Sentiment & Behavioral Data**:
- **App Rank + Google Trends Overlay**:
Elevated app rank + Google Trends spikes historically mark **local tops or overheating**, often preceding significant cool-downs.
- Current period mirrors previous euphoric cycles.
- RSI (monthly) also elevated → supports reversion.
---
### 🧊 **2. Macro Liquidity Conditions**:
- **BTC vs Global Liquidity Index**:
- Historically tightly correlated.
- Current divergence: **BTC is at ATH territory**, while **Global Liquidity Index is still suppressed**.
- Suggests **unsustainable move**, and vulnerability if liquidity tightens.
---
### 🏦 **3. ETF Flow Structure**:
- **Monthly Flows:**
- Net positive ($780M), **but cooling**.
- Feb had negative net flows (~ SEED_TVCODER77_ETHBTCDATA:4B out), March stabilizing but still tepid inflows.
- Sign of **diminishing marginal demand** from institutional flows → could fail to support current prices if retail demand slows.
---
### 🔥 **4. Liquidation Heatmap (Hyperliquid)**:
- **Heavy liquidation clusters**:
- Between **$86K - $90K** → currently being tested.
- **Liquidity vacuum below ~$80K** with significant liquidation levels → ideal for a **"liquidity hunt" wick** if downside opens up.
- Reinforces potential **swift downside mechanics** via cascading leverage.
---
### 📈 **5. Technical Structure & Smart Money Concepts**:
#### BTCUSD (Weekly View):
- Price hitting **regression model’s upper red band** (mean reversion zone).
- Momentum indicators (MACD, ST Oscillator, Squeeze) all **bearish divergent**.
- Fair Value Gaps (FVGs) below ($66K– GETTEX:52K ) + large Weekly OBs → **magnet zones**.
#### BTCUSDT.P (Perpetual Futures):
- RSI and volume profile show clear **bearish divergence**.
- Weekly CHoCH (Change of Character) + potential **lower high forming**.
- Price sitting in **high liquidity zone** with **weak support below**.
#### BRN/BTC Ratio:
- Shows **macro risk-off positioning** still in play (low oil/energy relative to BTC).
- Risk that this reverses → capital rotation *out of crypto* and into commodities.
---
### ⚠️ **Conclusion: Near-Term Bearish Bias**
Your thesis is still anchored in the **broader structural bull market**, but the current **micro-structure is highly vulnerable** to a **mid-cycle correction**, driven by:
- Overheated retail metrics.
- Bearish divergence across momentum tools.
- Depleting ETF inflows.
- Liquidity + liquidation setups ideal for **fast downside moves**.
- Macro conditions (liquidity and cross-asset risk ratios) not supportive of continued vertical price expansion **without correction**.

BTC/USD Trading Setup – Bear Trap & Reversal PlayBTC has followed a former volatility setting where an initial sharp dump was followed by a reversion to prior levels with shrinking volatility, only to see another leg down extending 7% beyond the first drop. This pattern indicates a liquidity sweep before a potential structural shift.
Adding to the pressure, political instability has fueled market uncertainty, leading to a broad risk-off sentiment. Notably, gold is also at risk of a correction, and BTC is likely to dump alongside it rather than act as a hedge . This suggests a macro-driven selloff across multiple asset classes before any meaningful recovery.
BTC has now tested the 90K region five times, making it a key inflection point. A final dive below this level for a liquidity grab is highly probable before any major reversal. The tightening volatility percentages provide insight into an impending expansion phase, signaling that a significant move is approaching.
This setup presents an ideal bear trap opportunity. A final shakeout below 90K could lead to liquidity absorption, setting up a strong long-term positioning for a recovery. Smart entries on the final flush could offer a highly favorable risk-reward play for bulls.

Fundamental Analysis of EURUSDEURUSD is trading in the support area which has been respected by the price action since December of 2022. Similarly, there is an area of resistance.
There are two scenarios based on the current geopolitical tension and the policy of the new administration in the US.
Scenario#1: Risk OFF or USD depreciates against EUR and other currency pairs
The new US administration will take charge in Jan 2025, and by that time if the Scenario#2 has not happened then the EUR should appreciate significantly against USD. The new administration is expected to be business friendly. The US economy should get an ultra-boost because of lower taxes and less regulations.
There are many other promises made by the winning party like the increase in import tariffs on all the countries, deportation etc., maybe those promises were to attract voters. We don't know how it will play out, so we go with the simple approach that republican party means less regulation, hence business friendly.
Scenario#2: Risk ON or USD appreciates against EUR and other currency pairs
This scenario could play out even before the new administration takes charge!!! We don't know if it is a bluff from Russia or a real threat, but the fear of nuclear war can be frightening. Whenever there are major escalations in the world, the USD appreciates and that is as simple as 1 + 1 = 2, right?

Risk-On or Risk-Off? Stocks vs. Bonds Introduction:
With stocks reaching new all-time highs and market sentiment edging into euphoria, it's an opportune time to revisit a classic risk-on/risk-off indicator: the ratio between stocks AMEX:SPY and long-term bonds NASDAQ:TLT . This ratio provides a clear view of investor sentiment:
Risk-On: When SPY outperforms TLT, investors favor equities for their higher potential returns.
Risk-Off: When TLT outperforms SPY, it reflects rising risk aversion and a move toward safer assets like bonds.
Analysis:
Uptrend Intact: Currently, the SPY-to-TLT ratio remains in a clear uptrend, defined by a series of higher-highs and higher-lows. This sustained upward momentum signals continued confidence in equities.
Ascending Channel: The ratio is also rising within an ascending price channel, a bullish continuation pattern. As long as this structure holds, the market can be interpreted as firmly in risk-on mode.
What to Watch:
Channel Support: A breakdown below the channel’s lower boundary would be the first sign of caution.
Higher Highs: If the ratio continues to push upward, it would confirm further bullish sentiment in equities.
Conclusion:
The SPY-to-TLT ratio is a key barometer for risk appetite, and its sustained uptrend within the ascending channel is a clear signal of the market’s risk-on posture. As long as this trend holds, equities remain in a favorable position. However, traders should stay vigilant for any signs of a breakdown, which could hint at rising market caution. Are you aligned with this risk-on outlook, or do you see potential cracks forming? Share your thoughts below!
Charts: (Include charts showing the SPY-to-TLT ratio, the ascending price channel, and key trendlines for support and resistance)
Tags: #SPY #TLT #RiskOn #RiskOff #Stocks #Bonds #TechnicalAnalysis #MarketTrends

SOL / USD ConsolidationNeutral consolidation for a week heading into major economic data. Any sort of risk-on response from the overall market could lead to significant upside. However a breakdown could flush out a lot of bulls in quick fashion.
Upwards price targets of: 151, 158, 163, and 184+
Downwards price targets: 134, 110, 104

Bitcoin Breaks Record, Shrugs Off Risk-On Label Gold extended gains for a third consecutive session, crossing $2,650 per ounce, as investors sought safety following an escalation in the Russia-Ukraine conflict.
Meanwhile, Bitcoin is also performing well and doesn't appear to be acting totally as a risk-on asset in this environment, surging to a fresh record high. President-elect Donald Trump’s administration is reportedly considering a dedicated cryptocurrency policy role within the White House, Bloomberg reported.
Adding to Bitcoin's momentum, the Financial Times revealed that Trump Media and Technology Company is in advanced talks to acquire crypto trading platform Bakkt.
Bitcoin remains above key technical levels, including the 50- and 100-day EMAs, while the RSI hit overbought territory at 80.

safe-haven play :USD vs. NZDIn several of my previous analyses, I mentioned the state of the Forex market due to geopolitical tensions . As a result, we are witnessing an increase in safe-haven currencies like USD compared to riskier currencies such as AUD and NZD. Therefore, by following proper risk management principles, you can open short positions on this currency pair.
Additionally, from a technical perspective, after breaking down the ascending channel, the price has formed the first wave of Elliott and, after its correction, has completed the second wave. In the most recent candle, it has entered the third impulsive wave.
Target 1: 0.59750
Target 2: 0.58626
Stop Loss: 0.61010

NZDUSD: Short Term SellEntry: 0.6080
Stop Loss: 0.6140 (60 pips above entry)
Take Profit: 0.5980 (100 pips below entry, offering a 1.67:1 reward-to-risk ratio)
Reasoning:
The New Zealand dollar is displaying signs of weakness, and with global risk-off sentiment prevailing, NZD/USD may continue to fall towards 0.5980. This setup provides a favorable risk-to-reward opportunity.

AUDUSD: Short Term SellEntry: 0.6727
Stop Loss: 0.6800 (73 pips above entry)
Take Profit: 0.6600 (127 pips below entry, offering a 1.7:1 reward-to-risk ratio)
Reasoning:
With global risk-off sentiment growing and commodity prices showing signs of weakness, AUD/USD could face further downside pressure. This setup capitalizes on potential bearish momentum, offering a strong risk-to-reward opportunity.

Lower Technology Sector Pulls Cryptos LowerCryptocurrencies are trading to the downside, and we are seeing some sharp intraday sell-offs, most likely triggered by risk-off flows. As you know, normally when stocks are down, cryptos tend to move in the same direction, especially when there are significant sell-offs in the stock market like we've seen over the last few days, triggered by missed earning reports and lower technology sector. It's not surprising that we are seeing a pullback, which we have been warning about in our past updates.
Some of the coins are experiencing very sharp sell-offs and deeper retracements, while other stronger coins are hitting interesting support levels. Even Bitcoin, the most important cryptocurrency, is at a very interesting first area of support. However, looking at the total crypto market cap, there is a sharp one-leg down, suggesting a more complex and deeper ABC retracement before the market may really find new buyers. There is first tecnical strong support around the $2.24 trillion level.
Looking at the NASDAQ 100, there seems to be a very strong impulse away from the highs, so toš is in, but we see prices possibly in the 5th wave approaching some support around 19,000. If we get an ABC rally in the near term, that's when cryptos could also stabilize.
GH

Gold big picture: 2400 was "a" top? One more push to 2700 ?We appear to be in an Elliott "Wave 5".
Wave 5's in commodities tend to extend.
Likely a pullback first then next/last leg?
.
Here is a Near-Term plot of possible retrace to $2307
===========================================================================================

commodities high conviction entry in FebLooking back, commodities had a high conviction in february based on a longterm trend. Combining macd and BB break out.
Markets have either risk-on sentiment or defensive. During risk-on phase people want to put money to work, there is too much money. During risk-off or defensive, people want money and safety. Assets become too expensive. Bitcoin rallies during risk-on phases. Oil or gold can be either risk-on and risk-off . Markets are fascinating.
Faang can be a risk-on and risk-off, till everything becomes too expensive to have.
Markets leave clues. and they move on cycles.
It makes sense why commodities are risk-off . Small caps usually are risk-on (when economy does well, there are no global conflicts; ie the future is BRIGHT).
More concerns move the weight to risk-off , ie markets are a weighing machine longterm.
People tend to be stuck in one mood or another, and it's tough to adjust? markets can change gears quickly.

SQUIDGROW BIG RISK BIG GAIN PART 3 Let's clarify right away, this is an altcoin that has a small market cap, but some zones that should have held have held out, especially bullish on a large time frame. It is not a persuasion to buy, but my knowledge plus a trade idea
if you like this series, click like. See part 2 and part 1 below by clicking on the arrow where the price went

AUD/USD, NZD/USD hint at a round of risk-offIf commodity FX is anything to go by, we could be in for a bout of risk-off. The yen and US dollar were the strongest majors, which saw AUD/JPY and NZD/JPY pull back from cycle highs and form bearish outside days alongside AUD/USD and NZD/USD.
The fact that AUD/USD reversed at its 200-day average and closed beneath the 200-day EMA makes it likely the 2-day bounce from support we anticipated has run its course. And with NZD/USD hitting new cycle lows with a bearish engulfing day and closed beneath its 100/200-day EMAs likely brings 60c into mind for bears, and 65c for AUD/USD bears.

The most important chart in your trading career.Merry Christmas to all, I hope you and yours are well.
My present to you this year is the one chart you should ALL be watching. SPX/GOLD
Risk On (Equities), Risk Off (Gold). It will save you a TON of time/headaches, if you follow this chart.
In this video I go over why you should use it. How your portfolio would have been managed the last 50yr, and at the end give a quick method for managing your ratio between Risk On/Off.
As always, good luck in your trading, have fun, and practice solid risk management.

EURUSD Short IdeaExpecting Lower EURO and higher Dollar
Risk OFF Scenario
Dollar UP other foreign Currencies Down
Focus down on SELLSIDE

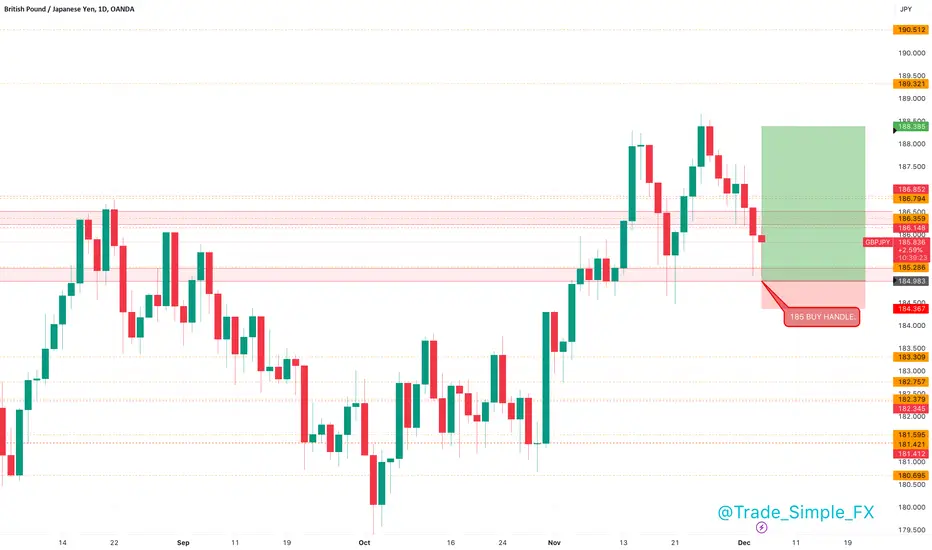
GBPJPY D1 - Long SignalGBPJPY is flirting between this 185 support price and 188 region, a solid 300 point range, we are hopeful to see a pullback and another opportunity to enter long from this 185 psychological price zone. From here we can look to targets 1R, 3R, 6R respectively.
A lucrative setup, with lots of mileage upside, nothing to say we can't target 190.00.
Bullish reversed Head & Shoulders on VIXThe VIX seems to have validated a bullish pattern, the reversed Head & Shoulders with a target around 27 and intermediate resistance with the line linking the tops near 24.
Only a break below the shoulders level around 15 would invalidate this view.

WHY is #BITCOIN rolling over???Explain to me
Bearish divergence
Super UGLY candlesticks
The corn and #crypto not looking like they wanna go up
not even sideways
but actually some down for a little while
curious since we had such great news a few days ago

LIQUIDITY MATTERS! Global liquidity vs #BitcoinLook at how the bullish green arrows and bearish red arrows show how global liquidity correlates HEAVILY with the direction of Bitcoin. T
You don't have to be a genius to see how beautiful this correlation is.
And how sensitive #BTC is to excess capital in the system.
As a risk on asset
When ppl have easy money to gamble with , a portion of that ends up in the #Crypto markets.
Currently you can see how aggressive the withdrawal of liquidity is across the globe
In the USA, EU, China & Japan.
