YELLOW METAL Might Break The Neckline Of H&S Amid RISK ON MarketMarkets are in the RISK ON mood which usually puts pressure on safe assets and currencies including the yellow metal. Here we see a HEAD AND SHOULDER pattern on the verge of completion!
The neckline will likely be broken soon enough as the risk ON markets dominates the appetite of the investors. Once the neckline gets broken we should see the selling pressure building up towards the next ascending trendline support that lies in the region of 1260.00 level.
I am already short on this pair with my entry being at 1295.000 level , TP at 1267 & SL at 1321.00
My trade that is short has been active since one month and once the neckline breaks we can expect the TP levels to be reaching soon enough.
This is just an outlook behind the current yellow metal state and where its heading, if you want to enter i suggest you do that at your own risk as the price has drifted away from our entry level and the RISK TO REWARD RATIO will NOT be 1:1 in this case. Nonetheless its a very high probability setup both technically and fundamentally. If you like my analysis please drop me a LIKE and FOLLOW me if you would like to receive more future analysis. cheers and thanks
Riskon

DO NOT BUY USDJPY Until the Wedge breaks! Initial Target 114.000This pair has broken all the vital levels technically, furthermore fundamentally its easily on the course of hitting the next resistance that lies at 114.00 level after which it might likely further target 118.00 level! However even though USDJPY seems it might HIT 114.00 level by next week or the week ahead, technically we are confined in a very concrete wedge that has been respected on a numerous occasions!
Have a look at the main chart for weekly TF. The upper trendline of the wedge is clearly acting as potential resistance which needs to be broken (the weekly candle needs to close outside this trendline) for us to have technical confirmation to go LONG!
Markets are currently on a RISK ON appetite mood and it will likely intensify in the coming weeks which would drag the yellow metal down and other safe haven pairs such as eurjpy and usdjpy. Its an excellent opportunity to take this trade LONG whilst the markets are in RISK ON mood.
Have a look at the image above taken from the daily TF of this pair. H & S Patterns are reversal patterns however in some cases they act as consolidation patterns! Here we see an inverse H & S present on the DAILY TF, a break of the neckline would likely propel the price to break the LONG TERM trendline on weekly charts. After this is done we can wait for the price to retrace slightly before entering a LONG position.
THIS JUST REPRESENTS MY ANALYSIS ON THIS PAIR AND SHALL THE CRITERIA MEET I WILL POST THE TRADE DETAILS IN A NEW POST. Please if you like my analysis give it a LIKE and FOLLOW me if you would like to receive more analysis. cheers

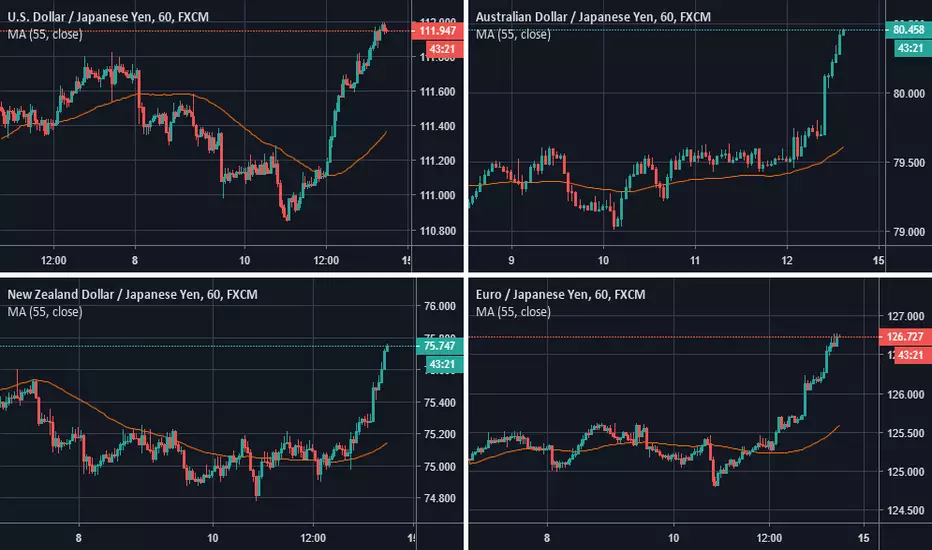
Jpy Crosses - Risk on a common theme in FXWe are finally getting some intermarket movement with Risk On contamination from Indices into FX.
When you see multiple currency pairs moving in tandem, there is usually an underlying theme in the working.
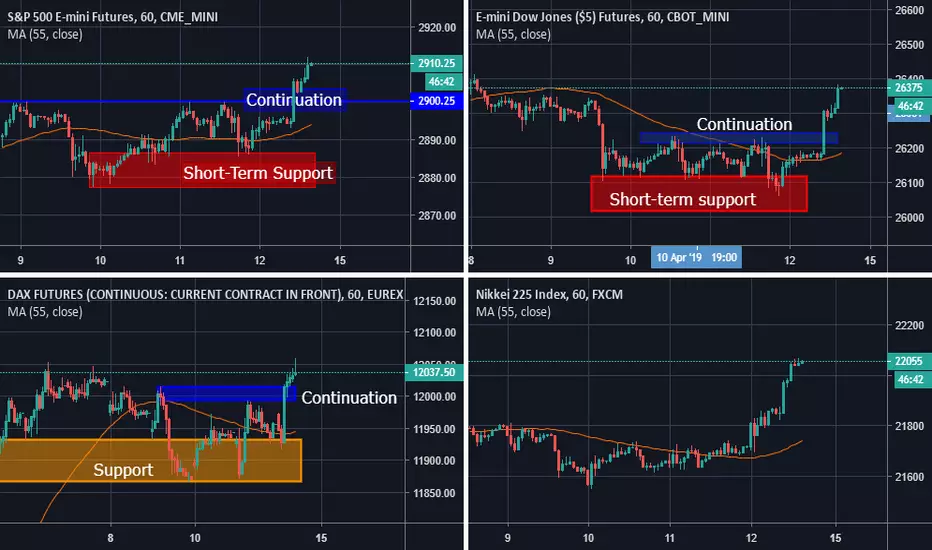
Indices - Risk On is the Theme of the DayNice moves in Indices but beware of earnings from US banks today: JPMorgan and Wells Fargo will be watched closely for signs of economic slowdown or recession.
Elliott Wave & Intermarket Analysis For DOW JONES And AUDJPYHello traders! Today we will talk about positive correlation between stocks and xxx/jpy cross pairs, while we are in RISK ON sentiment.
Well, as you know, stocks are in uptrend and there can be room for more upside once a bigger correction fully unfolds. At the same time, xxx/jpy pairs are usually in positive correlation with stocks that can be clearly seen in the first chart above!
The best examples at this stage are Dow Jones and AUDJPY, where we see a potential bullish triangle in progress which may take some time, because we still see an unifinished five-leg A-B-C-D-E sideways movement. Currently we are observing a three-wave (A)-(B)-(C) rally to the upper side of a triangle range for wave D, from where we may see another sell-off for wave E and once a wave E completes, this is when a big triangle can be finished that can push the price back to highs!
These triangles are valid while price keeps trading above blue wave A swing low and bullish confirmed can be only above blue wave B swing high! That said, we are patiently waiting to see if the triangle will unfold as we wish!
Trade well!
Disclosure: Please be informed that information we provide is NOT a trading recommendation or investment advice. All of our work is for educational purposes only.

Short USD/JPY via risk=> Here we are isolating the Yen once more and expecting a worsening outlook of US assets to continue which will raise the prospect of asset repatriation out of the US.
Whilst risk may be rebounding temporarily as the FED attempts a dovish shift, and US-China trade tensions are likely to continue de-escalating, USDJPY will still like remain on offer amid broader USD weakness.
Here we also expect the rebound in risk sentiment to be temporary rather than fixed, meaning JPY will see some inflows. If Japanese banks tighten conditions further we will have a greater incentive for real money to reduce their exposure in the US.
The only risk here is if risk on sentiment stays supported and the US macro outlook improves.
For those interested in more details on the "flash crash" please see our previous USDJPY weekly chart!
Good luck and all the best for those invested in the US.

Ethereum Rally into Constantinople Fork / Alt-Season (Risk on)Ethereum is sitting on strong historical support vs. BTC and is exhibiting bullish divergences in both momentum and volume.
With the upcoming Constantinople hard fork, which is reducing the block reward from 3 to 2 Eth, Eth may rally into the event after months of downtrend vs. BTC.
As is indicated via the chart, Ethereum rallies vs BTC (eth outperforming btc) have led to a risk on approach to higher risk crypto assets known as altcoins. Many refer to this event as "Alt Season".
If Ethereum can manage to rally vs. btc, other higher risk assets may see explosive rallies, as sellers have become extremely exhausted and sell side liquidity is almost non existent.

SPX500USD (H4)After price formed a double bottom at key level support, a strong bullish impulse took place breaking all barriers of the downtrend structure. Price closed this Friday with a bullish engulfing candlestick breaking above resistance along with the major descending trendline. Will be anticipating a slight pullback to retest broken resistance (61.8 fib) as new support for a further push to the upside.
This pair is important to watch as it has a strong correlation to the forex market. When price pushes up, AUD & NZD gain strength. When price moves lower on the SPX, this causes fear in the market & people move their money to safe haven assets like the CHF & JPY.

Long NZDJPY After my colossal mis-read of the risk sentiment I managed to get out of GBPJPY at breakeven. I now expect the Kiwi to be bid as a more risk on sentiment and recent bounce in economic data should support the antipodean currency. Given the risk on tone and the combination of strong Asia equities close and Kuroda's comments pouring water on any plans to scale back BOJ QE. There should be safe haven out flow weighing on the JPY.
I have an order Long NZDJPY from the 38.2 pullback the mornings rally. Stops behind 61.8 and targets at the 1.13 extension.

EURCAD / SHORT OPPORTUNITY / H4EURCAD
Trading Bias: Short
Technical Strategy: Re-test of broken rising wedge
Fundamental Strategy: Shift to risk-on sentiment with news regarding US-China trade relations
*IF you do not know how to trade using this analysis please send me a PM for help*

EurJpy. A revisit of old levels with new perspectives.On Oct 5, did an analysis on Eurjpy where the trade was triggered only 3 days later. From execution to achieving the exact Target profit was a total of 8 days.
They always ask what will you do differently if you get to relive your live again or if you are young again?
But the interesting thing about trading is that you get to relive redo and reenact your beliefs and mindsets within hours, days and weeks
The only difference is that every trade is a new trade.
Do not remember the previous winning or losing trade. Focus on the task at hand. It's a NEW trade.Full-s
Key levels to formulate one's trading will be at 130.60 and 129 levels.
Other levels is a waste of time.

USDCHF: Time for a retracement soon ?The usdchf hit a low of 0.9540 before retracing to 0.9960 . That's a whopping 460 pip of retracement.
Thus what's the revelation? U can never be too sure about the extent of how much a currency pair would retrace and if (surprise surprise) it could eventually even start an uptrend on its own.
Such is the reality. The analysis is as good as it gets at the point of time but making provisions for different scenarios to play out and all the stop checks the trader has put in place to ensure that the analysis is still on track is essential for survival in any market.
Thus in the case of the usdchf, with key levels taken out at 0.9890 and 0.9850 it actually opens the door to lower supports at 0.9790 and 0.97 being revisited again.
However, with the longer term trendline at 0.97 holding at the moment, this is at best a retracement to Revelation Trading at the moment.
We ultimately trade into the unknown and as usual the market will show us where it eventually wants to go.

EURUSD A Turn of Tides A Eurusd short was attempted at the break of 1.1450 which was shortlived as it has chosen to reverse its original course of action.
At the moment as long as prices maintain above 1.16 more upside is expected with a probable target of 1.1750
Any break below 1.1540 would be a warning sign to reassess all long positions initiated.

CADJPY Story Intraday (refer to top left chart), price almost touching the weekly range. When that happens, I am biased on a retracement. Mid-term (refer to H4 and D1 chart), price have touched the Monthly projection and tested 87.000 price which was rejected mid May 2018.
Plenty of trading plan can be produced from this. Bearish Engulfing Candle on H4 and/or H1 would warrant me to short the pair between Frankfurt open until London Close. A bearish moving average crossover on the 30-min chart during London-US session overlap until London close, would warrant me a scalping trade as well.
Anything bullish today, I will observe and re-evaluate. Commodity-backed currencies (Canadian Loonie is one of them) have been well supported after market risk tone shift inspite of the Chine Tariffs was slapped but there was "good news" on the North Korean Nuclear plan issue as well. I am anticipating the market to sell this (fully priced in) eventually and that means dumping commodity currencies.
The range projection for this pair is :
Monthly = 320 pips
Weekly = 160-170 pips
Daily = 70-75 pips

USDJPY - Low Volatility Breakout in PlayUSDJPY is benefitting from Risk-On tone and higher US yields. We have also printed a low-volatility breakout and hence expect to see further upside.

BTPs at Key Resistance Italian politicians are attempting to calm the markets.
Today this seems to be working, and driving risk-on.
Eyes on the key levels.

GOLD, short position on the break of the trend line, 4 hour After a great dollar rally, gold confirmed a trend line yesterday. After slight pullback it is testing the level again. A break can trigger a short position with a good Risk-Reward ratio.
So far the dollar strength seems to continue and unless political tension escalate, like Iran/China trade/North Korea and so on, selling pressure on gold should push the commodity through the trend line.
We are also still in risk-on mood, with risk currencies like AUD and NZD inching higher.
Happy Trading!

AUDJPY - Going Contrarian to News & Media?We have been hearing some negative sentiment in the market, about how the next recession is near and coming...
The thing here is you need to realize where you are 'hearing' such news from. Ahem... most of the time, likely from the news or media.
The question here is are they really that reliable?
Well... based on our analysis (not the AUDJPY of course), we are unlikely going to see the next recession in the coming 6 to 12 months.
That being said, if the macro analysis tells us that we are unlikely to see a recession so soon, will we then be transiting back into a risk-on environment?
If that's the case, then the analysis here on AUDJPY will be good opportunity as a potential carry trade :)
Disclaimer - this is not a trade recommendation. Ensure you have proper trading and risk management plan before you execute any trades.

Learning how USD corrolates with non-USD currencies. EURCADMy CURRENT definition of RISK.
RISK ON
USD down, moving XXX/USD currencies up and USD/XXX currencies down.
or
RISK OFF
USD up, moving XXX/USD currencies down and USD/XXX currencies up.
Mid term (3 wks-6mo) I lean bias towards 2018 trading in RISK ON mode. Which means
EURUSD is a buy mid-term.
USDCAD is a sell mid-term.
In the last several months we have been in RISK ON mode with EURUSD in a obvious uptrend. I've noticed EURCAD trends UP when we are risk on.
So mid-term we cannot expect to short EURCAD because we know the underlying currencies are in up trends. Short term I do believe there is room for a pullback to the 1.53 or 1.52 levels coupled with a pullback in EURUSD. But ultimately I will be looking to trade EURCAD higher in months to come.
Full Disclaimer: This is a test I'm running to better understand how correlations among two USD pegged pairs perform when pegged against each other. I will be referencing both EURUSD and USDCAD often. EURUSD is perfectly 1-1 inversely correlated with USD. This is because the EURUSD is the strongest correlated currency to the USD in the world and ultimately controls EURCAD by nature. Trade between the United States and the European Union is over half of USD transactions so EURO's are the most strongly correlated out of all other currencies. That being said when I'm looking at the price of EURUSD, I'm actually reflecting on the price of USD if that makes any sense. EURUSD is up when USD is down BECAUSE USD is down! I track USD with the US Dollar index. Ticker DXY.
If you found this useful or thoughtful Likes/Comments/Follows are much appreciated!
Disclaimer: Oanda data shown. Material is educational only. Trade at your own risk!
and ultimately controls EURCAD by nature

Practical Exercise - Market Risk EnvironmentGenerally, the market will either be in a risk-on or a risk-off environment.
During uncertain times, the market is considered to be in a risk-off mode where investors prefer to park their money on lower risk investments.
During recovery or bullish times, the market is considered to be in a risk-on mode where investors are willing to park their money on higher risk investments.
Practical Exercise
1) Using the market risk indicator, identify what is the current market risk environment.
2) List down what are the financial instruments to take note, and the likely impact on them.
3) Post your exercise on the comment section in the thread.

Long USDJPY Trading PlanRationale for the plan :
1. 'Hawkish' statement from Powell
2. Equity markets as of now is positive. Potential Risk-On mode today.
3. Technical Sentiment is bullish USDJPY as price making higher-highs /lower lows since testing 110.900 handle
R isks for the plan (that could invalidate the plan) :
1. Poor U.S Prelim GDP numbers later (Forecast 3.3%, Previous 3.0%).
2. Escalation of North Korea Missile test issues, which would potentially shift the market into risk-averse (Safe Haven flow - Yen will strengthened)
3. Any negative language came out from tax reform news

Gold to fall with DX correction Risk on?Major resiatsnce formed on weekly chart around $1250 even handle, fib level and structure. Now double top forming H4 looking to trade back down T1 $1232-30 then extended target of $1205

USDJPY waiting to enter long on a reversal signal!As we mentioned in our previous note that dollar may not be able clear 115.10 area.
After having a series of central banks decisions, Markets are posing toward Risk-On mode now. AUS, Kiwi along with stocks welcomed Fed's softer tone.
Fed remain dovish with respect to market expectations and turned down the hast for raising rates. On the other hand Boj remained unchanged inclined toward keeping expansionary monetary policy with bond buying and -ve rates.
We expect dollar to lose a little more against high yielding currencies (aussie and kiwi) but gain against carry currencies, Yen in particular, EURO may be an exception because inflation has started picking up there , although at fragile levels.
Technically USDJPY is retesting the confluence supp at swing low 111.68 and trend break line.
The big picture shows a prospective bullish flag setup. We will wait for a reversal signal before taking a long positions.
Trade with care....
NOTE: OUR IDEAS ARE APPLICABLE ON DAILY TIME FRAMES ONLY....
