Pricol Ltd – Bearish on 1D Time FramePricol Ltd - Symmetrical Triangle Breakdown giving us a potential short trade.
You can use your own strategy and trade accordingly.
Give me some energy!! ✨
We pour our heart and soul into uncovering potential opportunities and crafting ideas that truly matter to you. Your support fuels our passion and keeps us going! 💚
With gratitude,
ProfitsNinja
✅ Thank you for being part of our journey! For more insights and ideas, show some love with a ❤️ Like ❤️ and 🌟 Follow 🌟!
⚠️ Stay alert!
Markets are dynamic and unpredictable. Even with the best signals, shifts can happen swiftly and powerfully. Stay prepared, stay ahead!
Risological

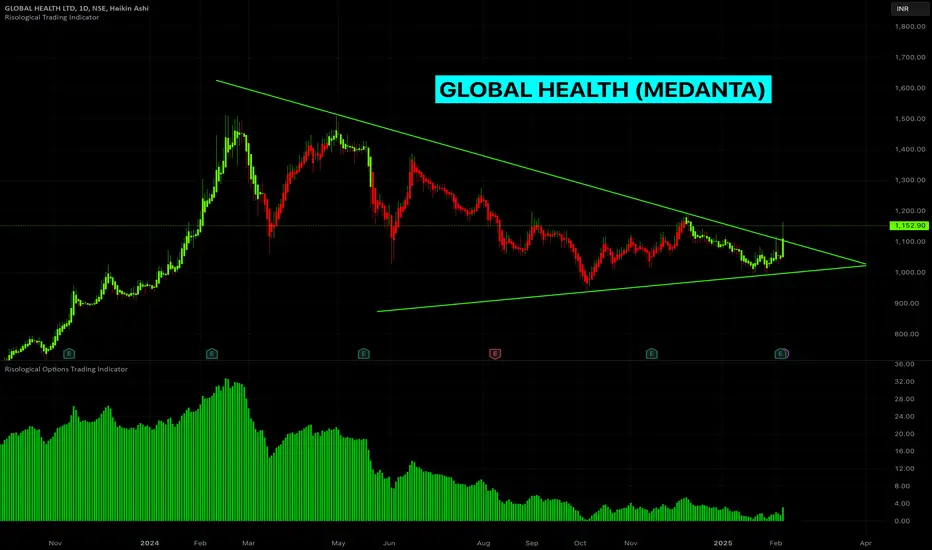
GLOBAL HEALTH LTD - Symmetrical Triangle BreakoutThis is still an open candle and need to wait till this candle closes in GREEN on Friday end of the day. If the candle is green and is clearly breaking out from the triangle on Friday, it is a Bullish sign.
On the daily time frame, the daily candle has closed in GREEN, which is a good sign.
The Risological indicators confirm the bullish movement as seen below.
ENTRY:
The stock can be purchased on the daily time frame as the Risological indicators gave the confirmation
EXIT:
Hold the BUY position till the Risological indicator gives a reversal
Exit on first RED candle close on the daily time frame.
OR, Exit if the Risological options trading indicator turns into RED.
Hope this helps!
Cheers!
__All info = educational only__
ANANT RAJ Ltd 38% in 5 Days!!!ANANT RAJ Ltd Stock - Short Trade in 15m timeframe
The Risological Options Trading Indicator crossover to the bearish side happened on 23 Jan, 2024 at 11:30 am, where I entered the short trade (spot).
Wanted to close it today, however, the stock hit lower circuit.
Hopefully I will get a chance to exit tomorrow, wish me good luck!

Mangalam Cement: Profitable Long TradeTrade Overview: Mangalam Cement demonstrated a strong bullish move on the 15-minute chart, with all targets (TP1 to TP4) successfully achieved using the Risological Swing Trading Indicator . The trade capitalized on a well-timed entry near ₹919.05, with a stop loss (SL) set at ₹907.45, and hit the final target of ₹994.05, showcasing high accuracy.
Key Levels:
Entry Price: ₹919.05
Stop Loss: ₹907.45
Take Profits:
TP1: ₹933.35
TP2: ₹956.55
TP3: ₹979.75
TP4: ₹994.05
Fundamental Analysis: Recent news supports the price movement:
Strong Quarterly Earnings: Mangalam Cement reported a net profit of ₹32.8 million for the September quarter, signaling financial resilience.
Improved Profitability: The company has shown consistent growth in quarterly profits, boosting investor confidence.
Market Stats:
Current Price: ₹1,007.75 (+1.66%)
Volume: 142.78K (above average)
52-Week Range: ₹610.30 - ₹1,093.70
Mangalam Cement's robust fundamentals and the Risological Indicator's precision have once again delivered a profitable trade setup.

BALAJI TELEFILMS, Bullish Momentum!BALAJI TELEFILMS (15-Minute Timeframe): Long Trade in Progress!
BALAJITELE Trade Details:
The long trade setup on the 15-minute timeframe has already hit TP1, showcasing a strong upward momentum. The chart indicates a likely continuation towards the remaining profit targets as per the Risological Trading Indicator.
Key Levels:
Entry: 61.67
Stop Loss (SL): 59.67
Take Profit Targets:
TP1: 64.14 ✅ (Hit)
TP2: 68.14
TP3: 72.13
TP4: 74.60
Analysis:
The trade setup reflects a robust bullish trend with price action supported by moving averages. Buyers appear to maintain control, suggesting further upside potential.
Outlook:
With the first target achieved, focus shifts to TP2, TP3, and TP4. If market conditions persist, this trade setup could deliver exceptional gains.
Stay tuned for updates as Balaji Telefilms approaches its profit milestones!

POLICYBAZAAR (POLICYBZR) Trade UpdateTrade Overview: A strong bullish momentum is evident, with TP1 already achieved at 1709.20. The remaining targets are well within reach, given the current trend.
Key Levels:
Entry: 1677.05
Stop Loss (SL): 1651.05
Take Profit Targets:
TP2: 1761.20
TP3: 1813.20
TP4: 1845.30
Technical Insight: The price is holding above the critical support levels, with the GREEN trend line from the Risological Indicator signaling continued upward movement. Traders are advised to trail the stop loss to lock in profits as the trade progresses.
Keep monitoring for trend continuity!

KPI GREEN Stock Plummets – All Short Targets Smashed in 15-MinKPI GREEN Stock Technical Analysis:
KPI Green on the 15-minute timeframe has completed its short trade with a clear break below the Risological dotted trendline, and all targets have been successfully hit.
Key Levels:
Entry: 811.55
Stop Loss (SL): 820.70
Target 1 (TP1): 800.25
Target 2 (TP2): 782.00
Target 3 (TP3): 763.75
Target 4 (TP4): 752.50
Observations:
The price respected the resistance offered by the Risological trendline and steadily declined.
Bears are in control, with the stock making lower highs and lower lows throughout the session.
The short trade played out perfectly for KPI Green, hitting all predefined targets. Watch for potential consolidation or further breakdown below TP4 for more opportunities.

BankNifty Finally Reversal?BankNifty, after a massive rally of 2400+ points on the CE Buying side, now looks ready for a nice short opportunities (PE Buying side).
I close my CE position today in a good profit and opened a PE buy position. Usually after such big moves, market becomes range-bound. And that, only next week can tell.
So, stay tuned, dont forget to enjoy your weekend.
Trust me, we deserve it.
