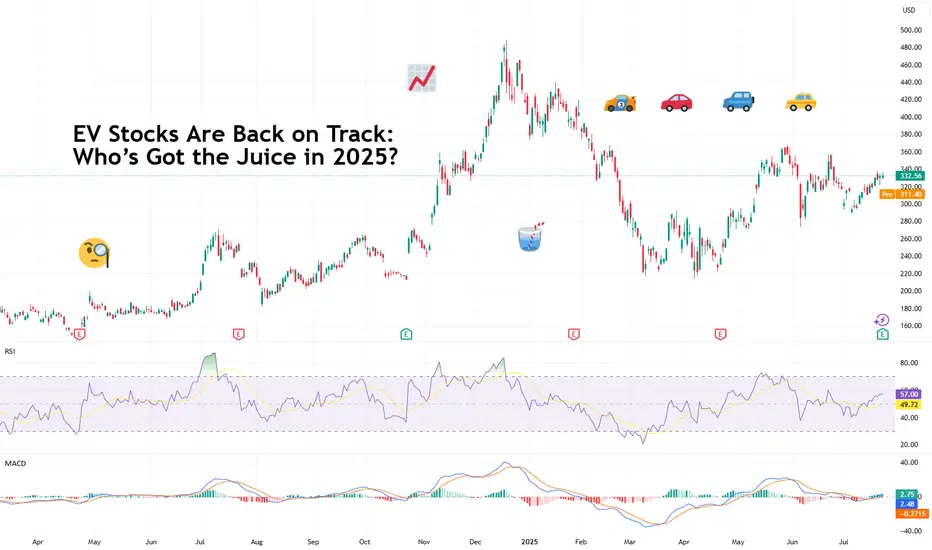
EV Stocks Are Back on Track: Who’s Got the Juice in 2025?This year is big for the EV sector so we figured let’s do a piece on it and bring you up to speed on who’s making moves and getting traction — both in the charts and on the road.
What we’ve got here is a lean, mean lineup of real contenders. Let’s go for a ride.
🚗 Tesla: Still King of the Road (for Now)
Tesla NASDAQ:TSLA isn’t just an EV company. It’s a tech firm, an AI shop, a robotaxi rollout machine, and an Elon-flavored media event every quarter. Even so, when it comes to margins, global volume, and name recognition, Tesla is still the benchmark everyone else is chasing.
In 2025, Tesla’s bounceback is fueled not just by EV hype but by its push into autonomous driving and different plays into the AI space.
The stock is down about 13% year-to-date. But investors love a narrative turnaround. Apparently, the earnings update didn't help the situation as shares slipped roughly 5%. Well, there's always another quarter — make sure to keep an eye on the Earnings Calendar .
🐉 BYD: The Dragon in the Fast Lane
BYD 1211 is calmly racking up sales, expanding across continents, and stealing global market share without breaking a sweat. The Chinese behemoth is outselling Tesla globally and doing it with less drama and more charge… literally .
Vertical integration is BYD’s secret weapon — they make their own batteries, chips, and even semiconductors. The West might not be in love with BYD’s designs, but fleet operators and emerging-market governments are. And that’s where the real growth is.
⛰️ Rivian: Built for Trails, Not Earnings (Yet)
Rivian NASDAQ:RIVN still feels like the Patagonia of EV makers — rugged, outdoorsy, aspirational. Its R1T pickup truck has cult status, but the company had to tone down its ambitions and revised its guidance for 2025 deliveries to between 40,000 and 46,000. Early 2025 projections floated around 50,000 .
The good news? Rivian is improving on cost control, production pace, and market fit. The bad news? It’s still burning cash faster than it builds trucks. But for investors betting on a post-rate-cut growth stock rally, Rivian may be the comeback kid to watch. It just needs a few solid quarters.
🛋️ Lucid: Luxury Dreams, Reality Checks
Lucid NASDAQ:LCID , the one that’ll either go under or make it big. The luxury carmaker, worth about $8 billion, came into the EV game promising to out-Tesla Tesla — with longer range, more appeal, and a price tag to match.
But here’s the rub: rich people aren’t lining up for boutique sedans, especially when Mercedes and BMW now offer their own electric gliders with badge power and a dealer network.
Lucid’s challenge in 2025 is existential. The cars are sleek, the tech is strong, but the cash runway is shrinking and demand isn’t scaling like the pitch deck promised.
Unless it nails a strategic partnership (Saudi backing only goes so far), Lucid could end up as a cautionary tale — a beautifully engineered one, but a cautionary tale nonetheless. Thankfully, Uber NYSE:UBER showed up to the rescue ?
💪 NIO : Battling to Stay in the Race
Remember when NIO NYSE:NIO was dubbed the “Tesla of China”? Fast forward, and it’s still swinging — but now the narrative is more about survival than supremacy. NIO's battery-swap stations remain a unique selling point, but delivery volumes and profitability are still trailing.
The company’s leaning into smart-tech partnerships and next-gen vehicle platforms. The stock, meanwhile, needs more than just optimism to get moving again — it’s virtually flat on the year.
✈️ XPeng: Flying Cars, Literally
XPeng’s NYSE:XPEV claim to fame used to be its semi-autonomous driving suite. Now? It's working on literal flying vehicles with its Land Aircraft Carrier. Innovation isn’t the problem — it's execution and scale.
XPeng is beloved by futurists and punished by spreadsheets. It’s still getting government love, but without a clear margin path, the stock might stay grounded.
🏁 Li Auto: The Surprise Front-Runner
Li Auto NASDAQ:LI doesn’t get the headlines, but it’s quietly killing it with its range-extended EVs — hybrids that let you plug in or gas up. A smart move in a country still building out its charging infrastructure.
Li is delivering big numbers, posting improving margins, and seems laser-focused on practicality over hype. Of all the Chinese EV stocks, this one might be the most mature.
🧠 Nvidia: The Brains of the Operation
Okay, not an EV stock per se, but Nvidia NASDAQ:NVDA deserves a spot on any EV watchlist. Its AI chips are running the show inside Tesla’s Full Self-Driving computers, powering sensor fusion in dozens of autonomous pilot programs, and quietly taking over the brains of modern mobility.
As self-driving becomes less sci-fi and more of a supply-chain item, Nvidia's value-add grows with every mile driven by data-hungry EVs.
🔋 ChargePoint & EVgo: Picks and Shovels
If you can’t sell the cars, sell the cables.
EV charging companies were once seen as the “safe bet” on electrification. Now they’re just seen as massively underperforming.
ChargePoint BOATS:CHPT : Still the leader in US charging stations but struggling with profitability and adoption pacing. Stock’s down bad from its peak in 2021 (like, 98% bad).
EVgo NASDAQ:EVGO : Focused on fast-charging and partnerships (hello, GM), but scale and margin pressures remain.
Both stocks are beaten down hard. But with billions in infrastructure funding still flowing, who knows, maybe there’s potential for a second act.
👉 Off to you : are you plugged into any of these EV plays? Share your EV investment picks in the comments!
RIVN
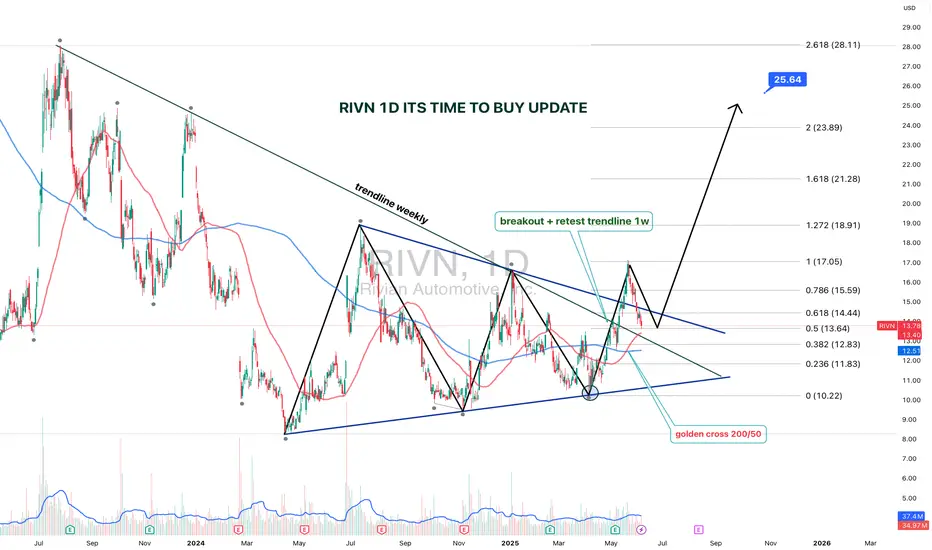
RIVN 1D — It’s Time to Buy: Setup UpdateThe setup on Rivian (RIVN) just got upgraded from “interesting” to “strategically significant.” We’re looking at a textbook symmetrical triangle that’s been developing since July 2023, with a clean breakout and retest on the weekly trendline.
The breakout was followed by a bullish retest, right at the intersection of the triangle base and the key trendline. Volume kicked in, price held — and that’s what smart money calls confirmation.
Now, the Golden Cross is live: the 50-day MA just crossed the 200-day MA from below. Price is confidently holding above both — momentum is shifting hard. Fibs from the bottom (10.22) to the last local top (17.05) project the first target at $17, and the extended Fibonacci confluence gives us $25.64 as a long-range goal (2.618 extension).
The weekly trendline — which acted as resistance for over a year — has flipped to support. Price action respects it, bulls are loading, and structure is clean.
This is not just a bounce. It’s a technical rotation from accumulation to expansion.
The time to talk about potential is over — price action has spoken.
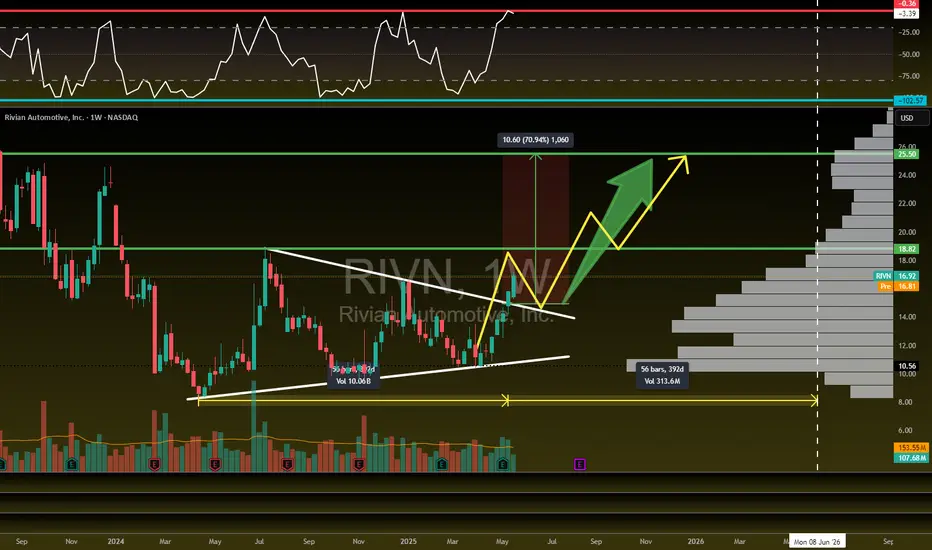
Rivian is flying! 71% UpsideNASDAQ:RIVN is flying! ✈️
Looking for a pullback to retest our breakout then move higher to our profit targets...Posted this setup last week in the community.
🎯$18.82📏$25.50
- Bullish H5_L Indicator
- Running into Red barrier (Need WCB to form)
- Volume shelf launch
RIVIAN Huge 1-year Triangle about to break. Trade the break-out.Rivian Automotive (RIVN) is trading within a 1-year Triangle pattern since the April 15 2024 Low. Right now the price is on the 1W MA100 (green trend-line), almost hitting the top (Lower Highs trend-line) of the pattern.
This is the second time ever that the 1W MA100 is tested, the previous on was on the last Lower High in late December 2024, giving slightly more probabilities for a bullish break-out above it.
If this is materialized, buy the break-out and target the 2.0 Fibonacci extension on the long-term at $26.50.
If it fails to break and instead is rejected back towards the Triangle's bottom, wait for a confirmed break of the Higher Lows trend-line and sell towards the -1.0 Fibonacci extension at $6.50.
-------------------------------------------------------------------------------
** Please LIKE 👍, FOLLOW ✅, SHARE 🙌 and COMMENT ✍ if you enjoy this idea! Also share your ideas and charts in the comments section below! This is best way to keep it relevant, support us, keep the content here free and allow the idea to reach as many people as possible. **
-------------------------------------------------------------------------------
💸💸💸💸💸💸
👇 👇 👇 👇 👇 👇

Is the trend changing for Rivian?NASDAQ:RIVN 's stock price, which has dropped by nearly 80% since September 2022, has started to move upward again in November 2024 with renewed demand.
The possibility of retesting the trendline formed during the 2022-2024 period has strengthened with the demand seen in the past month.
If this upward movement continues, the initial price target could be $19. Should the trend persist, price movements could extend to $28 and even $41.

RIVN Rivian Automotive Options Ahead of EarningsIf you haven`t sold RIVN after the recalls:
Now analyzing the options chain and the chart patterns of RIVN Rivian Automotive prior to the earnings report this week,
I would consider purchasing the 16usd strike price Calls with
an expiration date of 2025-4-17,
for a premium of approximately $0.93.
If these options prove to be profitable prior to the earnings release, I would sell at least half of them.

LCID to $5Bullish price action developing in LCID stock as a potential low is in.
This could head to $5.4 quickly in the new year.
Idea invalidated with a daily close below $3.00

RIVIAN LOOKS PRIMED! 120% UpsideNASDAQ:RIVN
Is it finally time for Rivian to break out of the multi-year downtrend?
-Falling wedge
-Symmetrical triangle
-Inverse H&S
-Williams CB formed
-H5 is GREEN
TRADE once we get B/O
Breakout: $16
SL: $9.52
Targets: $28/ $36
Risk/Reward ratio: 3
Not financial advice

Rivian - Where is this truck running to? 100%+ Upside PotentialChart #29/ 40: NASDAQ:RIVN 🔋🛻
-Falling Wedge needs to breakout at $16
-H5 Indicator needs to flip to Green
-Williams Consolidation Box needs to break -80 and then create support for form the consolidation box.
-AVP Shelf to launch off with volume GAPs
🎯$28📏$36⏳ Before 2026
NFA

RIVIAN Is this EV maker dead??Rivian is bearish on its 1D technical outlook (RSI = 42.757, MACD = -0.170, ADX = 26.255) as it is extendint today yesterday's massive rejection on the 1D MA200. The long term pattern is a Channel Down and we are on the latest bearish wave and about to form a 1D MACD Bearish Cross. The two previous bearish waves of the pattern reached the 1.618 and 2.0 Fibonacci extension respectively, so a progressive lower low is identified there potentially. In any event, we expect at least the 2.0 Fibonacci level to be tested (TP = 8.65).
See how our prior idea has worked out:
## If you like our free content follow our profile to get more daily ideas. ##
## Comments and likes are greatly appreciated. ##

RIVN HTF RUN TO $44NASDAQ:RIVN looks a lot like NASDAQ:COIN did last year. HTF bull div on 1M coming out of oversold.
Think this is a long term hold, but even a 1yr tf should be fruitful. Not to mention, I love their trucks. Cool design, cool tech. gud car.

Long-Term Outlook: Polestar's Potential on the 3-Day CandlesticLong-Term Outlook PSNY: Polestar's Potential on the 3-Day Candlestick Chart
Looking at the 3-day candlestick chart, we can observe some promising signs for the long term. While the price action may seem gradual, it reflects a steady build-up that could lead to significant growth in the years ahead. For those following Polestar, this chart provides a clearer picture of the broader trends and potential shifts in momentum. As always, patience is key. If the fundamentals align as expected, we could see a strong upward movement by 2026. For now, stay focused on the bigger picture and keep an eye on any key market shifts.

PSNY - Adjusting the short-term vision onlyThe stock closed last week with a clear reversal candle, showing weakness in the technical indicators after achieving 95% of the target for the current first wave. We expect the stock to aim for a deep correction in wave 2 or a , and if it holds above the 61% Fibonacci level around the 1.10 - 1.00 area, it will continue its bullish wave in the medium term. In the short term, there is a shift towards a bearish outlook, while positivity remains on the medium-term horizon,
Hence, we see the current rebound as an opportunity to close speculative positions, while maintaining investment positions unchanged.

RIVIAN giving highly accurate signals within this Channel Down.Rivian Automotive (RIVN) couldn't have been giving us more accurate signals since May (see charts below), as not only did we get a timely entry at the bottom (chart 1, May 17) but also sold at the very top (June 26 chart 2) of the Channel Down:
Right now we face a technical similarity with September 2023, exactly 1 year ago, where the price failed to utilize the 1D MA50 (blue trend-line) as Support and started a new long-term Bearish sequence.
However we do realize the potential long-term trend changing effect that a potential new cycle of interest rate cuts might have in two weeks, so again our trading plan will prepare for both scenarios with clear break-out signals and levels.
Obviously as long as the price remains within the 2-year Channel Down, the trend is bearish and the action will be 'sell on every high'. The Sell Signal on the September 2023 fractal was given when the 1D RSI hit the 60.00 level (red arrow, Sep 14 2023). Naturally we will wait for another such trigger to sell and Target 10.55 on the 0.5 Fibonacci retracement level, which is where last year's sell signal bottomed (October 30 2023).
If on the other hand, the price closes a 1W candle above the 1W MA100 (yellow trend-line), we will buy that clear long-term bullish break-out signal and Target 28.00 (just below Resistance 2). This could emerge as a Channel Up pattern.
-------------------------------------------------------------------------------
** Please LIKE 👍, FOLLOW ✅, SHARE 🙌 and COMMENT ✍ if you enjoy this idea! Also share your ideas and charts in the comments section below! This is best way to keep it relevant, support us, keep the content here free and allow the idea to reach as many people as possible. **
-------------------------------------------------------------------------------
💸💸💸💸💸💸
👇 👇 👇 👇 👇 👇

RIVN DOUBLE TOP SHORT TO $7.54 AHEAD OF EARNINGS DECLINEThe chart has reached a new short-term high. The RSI on the 2 hour chart is over 70. Perfect short to $12 or lower.
Invest smart, invest hard.
Boost my post if you like this idea 💡
Also follow and subscribe for more uproars. Let's spread the word together.
Roaring Puppy 🐶 out.

TSLA basing on its volume profile for a trade LONGTSLA on the highly reliable weekly chart is at the bottom of its volume profile in the lower
part of the high volume area. The TTM Squeeze Indicator ( TTM = Trade the Market John Carter)
has printed a signal for four weeks. The RSI faster and slower lines are near to the 50 level.
The mean relative volatility has steadily decreased and this is in an increasing squeeze state.
This is a setup for a patient trader to take a position in a swing trade. I am looking for a trade
into the upper part of the high volume area and so to the 240-280 range. I will get some shares
as well as a few call options for November (ITM). TSLA will be subjected to a number of
variables making the trade a bit risky including the Musk compensation battle, the China
economy, competition with Chinese EVs in Europe, federal rate actions and the presidential
elections as well as the evolution of self-driving. It is TSLA's volatility that makes it a great
trade. My entry signal here is a TTM indicator going black to white.

LCID Anchored VWAP based swing trade LONGLCID on the 15 minute chart is shown with two sets of anchored VWAP lines overlaid being set
at the pivot low of April 22 and the pivot high of May 6th. LCID completed a trend down today
which began on May 6th. Price has reversed and is breaking up through VWAP band lines on the
chart. The faster green RSI line has crossed over the 50 level in the past trading session. Price
is now about to cross over the longer mean black VWAP line. I am taking a long trade here
targeting 2.88 for 25% of the position, 3.10 for 50% of the position and the reminder for a
runner position to extend for the uppermost band lines. The first two targets are based on the
intermediate VWAP lines as well as the upper and lower boundaries of a standard Fibonacci
retracement. The stop loss will be raised incrementally from its initial setting of
2.74 at the top on the EMA cloud. As the trend down took a few weeks. I am expecting a 2-3
week long trade following a projected trend up.

$RIVN Perfect for Shorting the 2hr High RSI to $12The chart has reached a new short-term high. The RSI on the 2 hour chart is over 70. Perfect short from $16.73 to $12 or lower.
Invest smart, invest hard.
Boost my post if you like this idea 💡
Also follow and subscribe for more uproars. Let's spread the word together.
Roaring Puppy 🐶 out.
NASDAQ:RIVN

RIVN Rivian Automotive Options Ahead of EarningsIf you haven`t sold RIVN when they started to recall vehicles due to loose fasteners:
Then analyzing the options chain and the chart patterns of RIVN Rivian Automotive prior to the earnings report this week,
I would consider purchasing the 10usd strike price Calls with
an expiration date of 2025-1-17,
for a premium of approximately $3.05.
If these options prove to be profitable prior to the earnings release, I would sell at least half of them.

Volkswagen AG to invest 5 billion USD in Rivian AutomotiveVolkswagen AG is set to invest 5 billion USD in Rivian Automotive Inc., marking a strategic move to solidify its position in the electric vehicle (EV) market. This investment aims to optimise Volkswagen’s business processes and production efficiency by leveraging Rivian’s expertise in electric vehicle technology.
Despite being regarded as the future of the automotive industry, the electric vehicle sector is facing challenges such as slowing demand. The fact that even industry leaders like Tesla are compelled to implement aggressive price cuts to attract buyers highlights the intense competition and price wars affecting the newer, loss-making entrants like Rivian and Lucid Group Inc. particularly. This landscape poses new challenges for Volkswagen as it seeks to enhance its market stance through this strategic investment.
Examining potential investment opportunities, let’s review the stock chart of Rivian Automotive Inc. (NASDAQ: RIVN) from a technical analysis perspective:
On the Daily (D1) timeframe, Rivian’s stock has broken the resistance level at 12.15 USD, with support now established at 9.85 USD. An uptrend is beginning to form. Should a downtrend initiate, a potential downside target could be 5.50 USD.
If the current uptrend continues and the stock price rebounds off the resistance level, there could be a buying opportunity with a short-term target of 19.50 USD. For those considering a medium-term investment strategy, the stock price might rise to 24.45 USD if the positive momentum persists.
—
Ideas and other content presented on this page should not be considered as guidance for trading or an investment advice. RoboMarkets bears no responsibility for trading results based on trading opinions described in these analytical reviews.
The material presented and the information contained herein is for information purposes only and in no way should be considered as the provision of investment advice for the purposes of Investment Firms Law L. 87(I)/2017 of the Republic of Cyprus or any other form of personal advice or recommendation, which relates to certain types of transactions with certain types of financial instruments.
Risk Warning: CFDs are complex instruments and come with a high risk of losing money rapidly due to leverage. 69.88% of retail investor accounts lose money when trading CFDs with this provider. You should consider whether you understand how CFDs work and whether you can afford to take the high risk of losing your money.

RIVIAN Time to get bearish despite the VW $5 billion investment?Rivian Automotive (RIVN) reached today as high as $16.35 following Volkswagen's $5 Billion investment and got just shy of our $17.00 long-term target, as we called on our last analysis (May 17, see chart below):
Despite the excellent news, we have to call for caution this time as the technicals come in center stage. As you can see, the prevailing long-term pattern remains a Channel Down since the September 2022 High and unless the 1W MA100 (yellow trend-line) breaks and closes a 1W candle above it, we won't continue buying.
We change now our outlook to medium-term bearish and expect a rounded top to be formed below the 1W MA100 in the next 3 weeks, which we will sell and target the 0.618 Fibonacci Channel level at $13.50. Check also how the 1D RSI sequences between the current and the previous Lower High formation in July 2023 are similar.
Add to the bearish mix the fact that today's rise stopped exactly on the 1W MA50 (red trend-line). In any case, as mentioned, we are only willing to buy after a 1W MA100 break, in which case we will target $28.00 (just below Resistance 2).
-------------------------------------------------------------------------------
** Please LIKE 👍, FOLLOW ✅, SHARE 🙌 and COMMENT ✍ if you enjoy this idea! Also share your ideas and charts in the comments section below! This is best way to keep it relevant, support us, keep the content here free and allow the idea to reach as many people as possible. **
-------------------------------------------------------------------------------
💸💸💸💸💸💸
👇 👇 👇 👇 👇 👇

RIVN falls to fair value for swing LONGRIVN is here on a 30 minute chart with VWAP bands and a dual time frame RSI added. Price
fell from the top of the trend up after the last earnings. It is now between the mean
anchored VWAP and the first lower VWAP line which is where the reversal occurred on May 8th.
I will look for an entry long on a lower time frame chart. I am looking for a 1.75 move up
toward the second upper VWAP line in this trade while risking 0.25 making the reward for
the risk taken about 7.

RIVN a trade from deeply undervalued LONGRIVN on a 60 minute chart with set of anchored VWAP lines appears to be finishing a double
bottom at the 8.5 level and making a move higher in a VWAP band breakout potnetially rising
to the mean anchored VWAP and beyond it into the upper bands. I will take a long trage here
with the targets in a textbox on the chart. I am interested in the action of the lesser EV stock
while TSLAs fundamentals are challenged by earnings constraints in the face of downward
pricing and whether discounting will stimulate demand or instead accelerate the path down as
investors may perceive the pricing scheme as a sign of weakness ( or even desperation).
