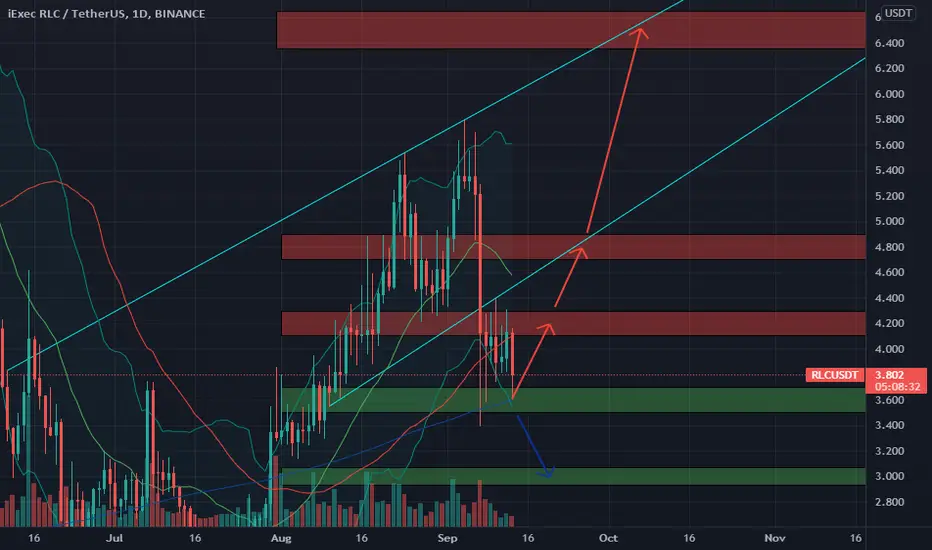
🆓iExec RLC (RLC) Sep-13 #RLC $RLCRLC is continuously recovering from the $3.6 zone and if it doesn't lose this zone, it will rally back to the $4,2, 4.8 and even $3.5 zone in the near term. But if it loses the $3.6 zone, it will fall back to the $3 zone
📈BUY
🔴Buy : 3.5-3.7$. SL if B
🔴Buy : 4.1-4.3$ if A. SL if B
🔴Buy : 4.7-4.9$ if A. SL if B
📉SELL
🔴Sell : 4.1-4.3$. SL if A
🔴Sell : 4.7-4.9$. SL if A
🔴Sell : 6.35-6.65$. SL if A
♻️BACK-UP
🔵Sell : 3.5-3.7 if B. SL if A
🔵Buy : 2.93-3.07$. SL if B
❓Details
📈Red Arrow : Main Direction as BUY and SELL section
📉Blue Arrow : Back-Up Direction as BACK-UP section
🟩Green zone : Support zone as BUY section
🟥Red zone : Resistance zone as SELL section
🅰️A : The Close price of 1-day candlestick is Above the zone
🅱️B : The Close price of 1-day candlestick is Below the zone
RLC
RLC BIG MOVE INCOMING!iExec is starting wave 5. We might see another touch of the diagonal trend line, but that's highly improbable.
I hope found the idea interesting:)

BTC Update BTC has been rejected 3 times by $47,400 level and is now creating a ascending triangle with higher lows. Needs more volume to crack this resistance otherwise a strong rejection could see a dump down to $42,000.

RLC Head and ShouldersRLC Head and Shoulders formation slowly forming.
Bullish market so will be interesting to see what happens

RLC about to pumpRLC is a fav of Crypto Inc and looks set to go on another run after a nice healthy correction. Breaking resistance here now and looks very bullish.

I WAS DEFINITELY PROVEN WRONG, $RLC UPDATERLC reclaimed the key area as asked, and currently consolidating above, this looks ready for a move upwards to at least those 2 objectives. Didn't give any short trigger as asked, so I was sidelines waiting for some clean PA. Currently spot long from 4.5$ and adding some buy orders below, from 4.5$ to 4$, waiting to get filled. If they get filled, nice, if they dont, nice too. I dont want to see the price close back below 3.85$, thats the line in the sand for me.

EOS trade enteredNice formation here on EOS, looking for a clear breakout here and trade entered accordingly.

RLCUSDTHello to you all. Mars Signals team wishes you high profits at all times.
We are in a 4-hour time frame. As you can see, the price has started to move upwards after the break of the resistance line. Pull back may hit his previous resistance line and start moving towards our target again. But if it penetrates into our support line and stabilizes, we consider the possibility of falling to the next support.
Warning: This is just a suggestion to you and we do not guarantee profits.
Wish you luck!

RLCBTC 1D long setup; Bounce off support zone and above EMAsTA explained
RLC consolidated above the 1D EMAs and support zone . Ready for the pullback move of the downtrend at least.
Trade setup
Best entries: 0.00008212 - 0.00009150
TP1: 0.00010633
TP2: 0.00012306
TP3: 0.00014146
SL: 0.00007470
RR: 4.36
Max leverage: na
—————
MDSquared Crypto Lounge
—————
Do Your Own Research (of course)
Trade at own risk (of course)
Only trade what you can afford to lose (of course)

RLC/USDT { IEXECRLC } - BULLISH SETUPANALYSIS 🔎
- RLC/BTC is printing an ascending triangle pattern.
- This is a bullish build up pattern.
- There's a breakout potential.
BUY ENTRY ⬆️
- Market entry: current market price.
- Stop limit entry: breakout above the ascending triangle's horizontal resistance (@0.00009289)
- Limit entry: test of the ascending triangle's inclined support.
TARGETS 🎯
- Fibonacci extension levels.
SETUP INVALIDATION ❌
- Breakdown below the ascending triangle's inclined support.

RLC/USDT { IEXECRLC } - BULLISH SETUPANALYSIS 🔎
- RLCUSDT is printing an ascending triangle pattern.
- This is a bullish build up pattern.
- There's a breakout potential.
BUY ENTRY ⬆️
- Market entry: current market price.
- Stop limit entry: breakout above the ascending triangle's horizontal resistance (@3.9469)
- Limit entry: test of the ascending triangle's inclined support.
TARGETS 🎯
- Fibonacci extension levels.
SETUP INVALIDATION ❌
- Breakdown below the ascending triangle's inclined support.

Keep your eye on RLCA great project with great potential and a long term hold for me (not financial advise)
if we break 3.75 and retest successfully this GEM is about to fly.
5.49 will be my first take profit point but am a long holder till 29 ;)
DYOR


RIGHT UNTIL WRONGClear close and consolidation above red would be key for a bullish continuation, until then, I will be looking to short the retest, with those objectives in chart.


Of the few non-Chinese currencies: the French RLCAccording to the chart in the daily time frame, volume chart and of course candlestick! What do you think about continuing the uptrend?
So far, more than 29% of the price floor has grown.

RLC Double BottomClear double bottom and trend reversal to the upside with RLC which is severely undervalued right now.

RLC broke out resistance#RLCUSDT
$RLC broke out from resistance, and stay above a long term support.
RSI is above HMA, and HMA looks bullish
buy $RLC here

RLC > Moving in a Channel > Next Move?Hello Friends,
Hope you all are having a thrill in your trading journey.
I am presenting you my analysis of RLC.
According to my technical analysis, RLC is moving in a channel. Now, It will do a pullback then a move to the upside.
"My analysis is valid until i don't see a breakout from channel"
I hope my analysis is pretty clear to you guys.
Kindly do your own research and follow proper risk management.
Feel free to share your views in the comment section. Like and Follow!
Best Regards,
Shaswat Naman
TradeThrill, India🇮🇳
Disclaimer: The analysis provided is purely informative and it should not be used as financial advice. Remember that you need a plan before you start trading; so, take this knowledge and use it as a guidebook that will ultimately help you understand the market and easily predict your next move.

RLC AnalysisRLC / USDT
Still above uptrendine which started since beginning of 2021
there are some dynamic resistance (200d EMA)
after closing above this resistance daily it will become bullish
Invalidation: closing below uptrendine by daily close turn bearish
Best of luck

RLC Breakout Asd we have accumulated waiting for this and its broken out nicely, currently testing 1st level of resistance.
RLCUSDT Triangle Formation!RLCUSDT (1H CHART) Technical Analysis Update
Triangle Breakout
RLC/USDT currently trading at $2.97
Buy-level: $2.94 - $2.96 (Wait for the small retracement)
Stop loss: Below $2.82
Target 1: $3.08
Target 2: $3.20
Target 3: $3.56
Max Leverage: 2X
ALWAYS KEEP STOP LOSS...
Follow Our Tradingview Account for More Technical Analysis Updates, | Like, Share and Comment Your thoughts.

