Waiting for pullback on RNDR
RNDR didn't manage to break its all-time high leaving a nice cup & handle pattern
Expecting a pullback for the handle before going higher.
I will accumulate heavily on the pullback
Rndr

RNDR - Breakout will yield a LONG signalBINANCE:RNDRUSDT (4H CHART) Technical Analysis Update
RNDR is currently trading at $7.325 and currently its inside a descending the triangle, a breakout
The price can break up or down of the descending triangle, we will enter the trade based on the direction of the breakout
>> SHORT TRADE <<
Entry level: $7.787
Stop loss level: $ 6.998
Target 1: $ 8.198
Target 2: $ 8.624
Target 3: $ 9.159
Target 4: $ 10.400
>> LONG TRADE <<
Entry level: $ 6.838
Stop loss level: $ 7.590
Target 1: $ 6.548
Target 2: $ 6.305
Target 3: $ 6.062
Target 4: $ 5.689
Max Leverage: 3x
Don't forget to keep stop loss.
Follow Our TradingView Account for More Technical Analysis Updates, | Like, Share and Comment Your thoughts.
Cheers
GreenCrypto

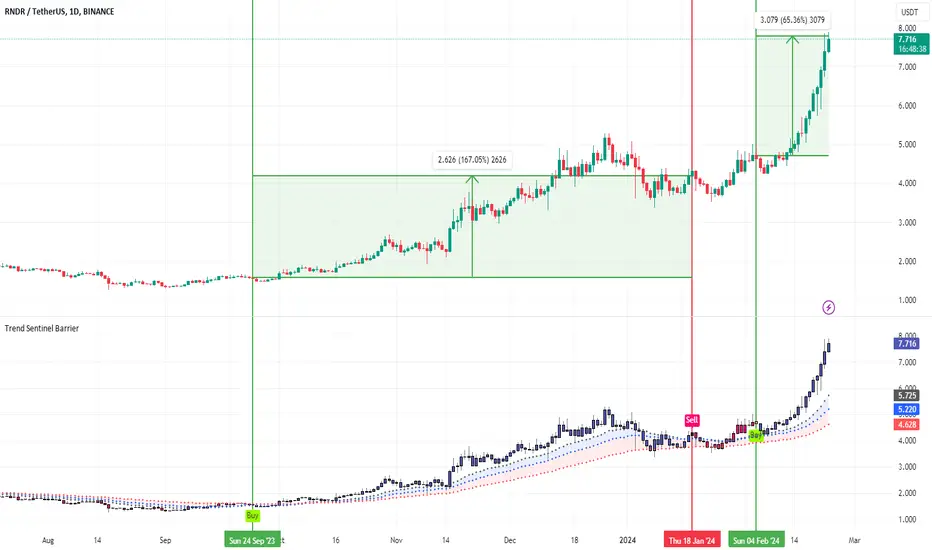
NVDA in the crypto - RNDROpenAI’s SORA ignited the AI sector in various markets last week. Yesterday, NVDA announced its fourth-quarter financial report. The profit exceeded expectations, and the AI sector in the crypto market rose again.
What we are talking about today is RNDR. This project is a Depin concept project established in 2016, specifically a decentralized GPU solution. There is no direct relationship like WLD and OpenAI. RNDR's strong performance is based on the same GPU business as Nvidia. Although there is currently no RWA business benchmarking US stocks, activist investors like to look for opportunities in tokens in related industries, just like WLD.
However, as one of Alameda Research's investment projects, RNDR also has certain risks. The current M.Cap of RNDR is US$2.926b, ranking second in the AI category announced by CMC.
From a technical analysis perspective, RNDR remains in a strong, bullish trend. As early as September 24, 2023, the TSB indicator prompted a BUY signal, and on January 18, 2024, a SELL signal appeared during the fluctuation, with the gains increasing by 167.05%, almost remaining above the wavy area of the indicator during the period. After the fluctuation ended, RNDR started its second round of rise again, while the TSB indicator prompted a BUY signal on February 4, with the current increase being 65%.
Introduction to indicators:
Trend Sentinel Barrier (TSB) is a trend indicator, using AI algorithm to calculate the cumulative trading volume of bulls and bears, identify trend direction and opportunities, and calculate short-term average cost in combination with changes of turnover ratio in multi-period trends, so as to grasp the profit from the trend more effectively without being cheated.
KDMM (KD Momentum Matrix) is not only a momentum indicator, but also a short-term indicator. It divides the movement of the candle into long and short term trends, as well as bullish and bearish momentum. It identifies the points where the bullish and bearish momentum increases and weakens, and effectively capture profits.
Disclaimer: Nothing in the script constitutes investment advice. The script objectively expounded the market situation and should not be construed as an offer to sell or an invitation to buy any cryptocurrencies.
Any decisions made based on the information contained in the script are your sole responsibility. Any investments made or to be made shall be with your independent analyses based on your financial situation and objectives.
RNDR Navigating Virtual Reality Boom with 360% Upside PotentialToday, our focus is on RNDR coin, a potential powerhouse in the long-term landscape. Given the rapid advancements in Virtual Reality technology and the expanding marketplace, RNDR stands poised to play a pivotal role, potentially leading to a meteoric rise in its value over the years. While the long-term outlook is promising, let's delve into the potential price perspectives for the next 3-6 months.
To kick things off, RNDR has solidified a robust uptrend, with each preceding supply area seamlessly transitioning into a demand zone. Notably, RNDRUSDT recently breached the resistance uptrend trendline, signaling an intensified bullish pressure. For the upcoming months, our attention turns to three key resistance levels determined by the Fibonacci retracement indicator.
The initial hurdle, the 361.8% Fibonacci level, could catapult RNDR by an impressive 140%.
The second, more significant challenge lies at the 561.8% Fibonacci level, promising an enormous 250% growth.
The pinnacle of this bullish cycle rests at the 761.8% Fibonacci level, translating to an astounding 360% surge from the latest demand zone.
In summary, RNDR's future appears exceptionally optimistic, and we remain vigilant, closely monitoring this coin's trajectory.

RNDR is Ready to Explode !RNDR is an uptrend for a while and actually, it hasn't even gave the value it's supposed to give.
What do we have ? Let's discuss:
RNDR will pump more after a small correction according to Elliot wave theory. We are currently in wave 3. But inside that wave three we are about the see corrective wave known as A-B-C .
After the C ends, it will start a new uptrend with a 5 small waves. Because the main trend is going up.
+Nvidia is about the make an operation based on these kinds of products and RNDR is a partner of Nvidia. It can also help the price to pump more.
According to my analysis, RNDR should go 6.5 at least. Of course it's for only wave 3. After correction wave 4, we can expect more.
If you are willing to invest on this product, I'd not suggest to use leverage. There is already high potential gain and no need to risk it with leverage incase of an event after some bad news.
I'll share updates about this one often so you better keep up!
Good luck to us all.

RNDR mid term 📌 analysis ⏰Pls 🙏 DO your own research 🔎 it's just my opinion
It's spot wallet not leverage trade 📌
It's just scalping High risk reward one 🕐 so I use 2% of my portfolio 💰
Buy :-: yellow 🟡 30% & 70% on chart 📉📈
Sell <•> GREEN 💚 50% & 50% on chart 📉📈
Stop 🛑 ( i recommend complete day below )

Render completed a setup for the next pumpHi dear friends, hope you are well and welcome to the new trade setup of Render Token (RNDR) with US Dollar pair.
Previously we caught a almost 111% pump of RNDR as below:
Now on a 2-hr time frame, RNDR has formed a bullish AB=CD move for the next pump.
Note: Above idea is for educational purpose only. It is advised to diversify and strictly follow the stop loss, and don't get stuck with trade.

RNDR/BTC - Render: Super Trend◳◱ On the $RNDR/ CRYPTOCAP:BTC chart, the Super Trend pattern suggests indications that the trend may be gaining or losing strength. Traders might observe resistance around 0.000105 | 0.0001145 | 0.0001288 and support near 0.0000907 | 0.0000859 | 0.0000716. Entering trades at 0.0001008 could be strategic, aiming for the next resistance level.
◰◲ General info :
▣ Name: Render
▣ Rank: 50
▣ Exchanges: Binance, Kucoin, Huobipro, Hitbtc
▣ Category/Sector: Services - Shared compute
▣ Overview: RNDR is an ERC-20 compatible utility token used to pay for animation, motion graphics and VFX rendering on the distributed RNDR Network, which is a peer-to-peer GPU compute network that connects creators in need of additional computation power for rendering their scenes, to providers that receive RNDR tokens for their GPU power. It allows complex GPU-based render jobs to be distributed and processed on a P2P network, making the transactional process of rendering and streaming 3D environments, models, and objects simpler for end users.
◰◲ Technical Metrics :
▣ Mrkt Price: 0.0001008 ₿
▣ 24HVol: 29.394 ₿
▣ 24H Chng: 6.217%
▣ 7-Days Chng: 9.59%
▣ 1-Month Chng: 18.77%
▣ 3-Months Chng: 100.43%
◲◰ Pivot Points - Levels :
◥ Resistance: 0.000105 | 0.0001145 | 0.0001288
◢ Support: 0.0000907 | 0.0000859 | 0.0000716
◱◳ Indicators recommendation :
▣ Oscillators: BUY
▣ Moving Averages: STRONG_BUY
◰◲ Technical Indicators Summary : BUY
◲◰ Sharpe Ratios :
▣ Last 30D: 4.19
▣ Last 90D: 3.28
▣ Last 1-Y: 1.62
▣ Last 3-Y: 1.48
◲◰ Volatility :
▣ Last 30D: 0.77
▣ Last 90D: 1.08
▣ Last 1-Y: 1.05
▣ Last 3-Y: 1.73
◳◰ Market Sentiment Index :
▣ News sentiment score is N/A
▣ Twitter sentiment score is 0.57 - Bullish
▣ Reddit sentiment score is 0.49 - Bearish
▣ In-depth RNDRBTC technical analysis on Tradingview TA page
▣ What do you think of this analysis? Share your insights and let's discuss in the comments below. Your like, follow and support would be greatly appreciated!
◲ Disclaimer
Please note that the information and publications provided are for informational purposes only and should not be construed as financial, investment, trading, or any other type of advice or recommendation. We encourage you to conduct your own research and consult with a qualified professional before making any financial decisions. The use of the information provided is solely at your own risk.
▣ Welcome to the home of charting big: TradingView
Benefit from a ton of financial analysis features, instruments and data. Have a look around, and if you do choose to go with an upgraded plan, you'll get up to $30.
Discover it here - affiliate link -

🚀🔬 RNDR Analysis - Testing Heights! 📈💡📈 Technical Overview:
RNDR: Testing the top of the range support level at $4.40.
Potential opportunity for a long trade.
Consider taking profits at $5.00 - $5.30 and then at $6.00 - $6.50.
Place the stop loss just below the lower support level, around $4.18.
📊 Trade Strategy:
Trade Opportunity: Long trade.
Profit Targets: $5.00 - $5.30, $6.00 - $6.50.
Stop Loss: Below the lower support level, approximately at $4.18.
🚨 Note: Market dynamics may influence outcomes.
Scaling heights! 🚀📈 #RNDR #TradeAnalysis 🌐✨

#RNDRIn time h4, there is a three-wave correction, which is moving upwards in a corner, and if it has no ability to go up in the red box, or if it breaks the trend, you can enter a sell position.

RNDR is bearish! be carefull!Based on the data we now have on the RNDR chart, it looks like this symbol is forming a large diametric.
This diametric seems to have started from the place marked "START" on the chart.
Now the bullish wave E is ending and the price from the specified supply range is susceptible to a serious drop to complete the wave F of this diametric.
We specified the targets on the chart.
We also specified the invalidation level on the chart. Closing a daily candle above this level will violate the analysis.
For risk management, please don't forget stop loss and capital management
When we reach the first target, save some profit and then change the stop to entry
Comment if you have any questions
Thank You

RNDR could breakout!!!!RNDR is at the supply zone if this will is flipped then its next target is $4.9625
Entry: closing of 4 hours above the supply zone
TP: 4.9625
SL: 4.119 if 4 4-hour candle closes below the demand zone which is currently a supply zone.

🚀 Rndr/Usdt Analysis: 📈The market structure of Rndr/Usdt is indicating a promising setup for a potential breakout.
I am expecting direct breakout of this trend line resistance soon
Please note that this information is not intended as financial advice, rather as an analysis of the current market conditions. 🙅♀️ It's important to conduct further research and consult with a financial advisor before making any investment decisions. 💼💡
Remember, trading involves risks, and it's crucial to consider your own risk tolerance and financial goals. Happy investing! 🌟📊
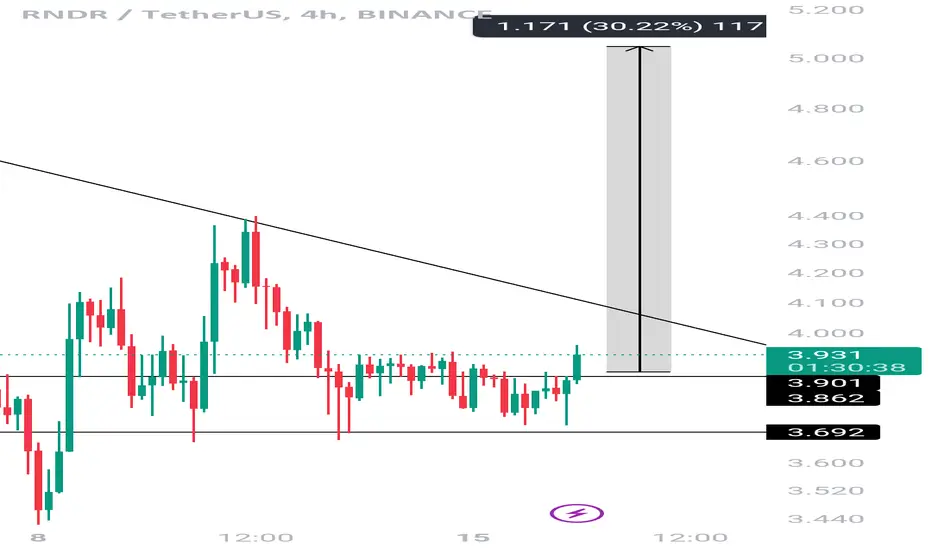
Strat uptrend(RNDR)📊Analysis by AhmadArz:
Wait for break renge and we can get big target.
🔍Entry: 3.935
🛑Stop Loss: 3.862
🎯Take Profit: 4
🔗"Uncover new opportunities in the world of cryptocurrencies with AhmadArz.
💡Join us on TradingView and expand your investment knowledge with our five years of experience in financial markets."
🚀Please boost and💬 comment to share your thoughts with us!

RNDR DCA ZONE An altcoin that started its growth exactly from January 1 and made 12x so far. The zone I'm looking at matches the trend, 0.381- 0.5 Fibonacci + high volume VAH + 200DMA. I expect a lot from this coin and will take it if it comes to this price, maybe even lower.

RNDR IS VERY BULLISHWe are in the big C wave. This wave has become a diametric. It has stabilized on the key level of 2.66 and the historical dynamic resistance has been broken. The chart is susceptible to a 3D pattern that the third drive can end in the 5-6 dollar channel. Also classically on the chart in the above timeframes we have a cup and handle pattern. This well-founded symbol may have positive news on November 19-20 that will cause a heavy price pump. Until RNDR is at the level of $2.6, it is very bullish

Render (RNDR) looks ready for a move - longI don't think Render wan't stop!
Stoch RSI (4h) raising.
Stoch RSI (D) at bottom
RNDR now crossing 20 (4h) moving average.
If we see a close above 4.7, I see continuation to local top, 10% potential move.
Set your stop loss based on your risk tolerance. In the chart 1.0 risk reward is highlighted.

RNDR symbol will be pumped more than 100% againBy checking the chart, you can see a symmetrical pattern for RNDR. We are now in the G wave and this symbol can advance to the inserted targets. A strong G wave is expected.
For risk management, please don't forget stop loss and capital management
When we reach the first target, save some profit and then change the stop to entry
Comment if you have any questions
Thank You

long RNDRCRYPTOCAP:RNDR bounced off the support level and the ascending trendline. Bullish movement to resistance level at $4.9 is expected to happen.

RNDRing a Bullish Impulse 🏹Hello TradingView Family / Fellow Traders,
📈 RNDR has maintained an overall bullish trend , trading above the red trendline that serves as a non-horizontal support. Currently, it is undergoing a correction phase and is approaching the trendline once again.
Moreover, the zone between 3.8 and 4.0 is a robust support level.
🎯 Therefore , the highlighted red circle represents a significant area to consider for potential buy setups, as it marks the intersection of the blue support and the red trendline.
📚 As per my trading style:
As RNDR approaches the red circle zone, I will be actively searching for bullish reversal setups to capture the next bullish impulse movement.
📚 Always follow your trading plan regarding entry, risk management, and trade management.
Good luck!
All Strategies Are Good; If Managed Properly!
~Richard Nasr

Curection midle-term (RNDR)❤️❤️Thanks for boosting 🚀 and supporting us!
📈we have big shadow in down-trend so this watched that start big renge or bearish trend.
📊 (sell) : 4.350
🔴 Stop Loss : 4.064
🎯 Take Profit : 3.796 - 3.490 - 3.227 - 2.980
🔗 For more communication with us, In the footnote and send a message in TradingView.
👨🎓 Experience and Education: Our trading team has five years of experience in financial markets, especially cryptocurrencies.

"RNDR is heading towards $7?"🚀🎗️
🔴Render has reached the mid-point of its trading channel and is poised to break through the $4.045 resistance level. If it does, it could reach the channel's upper limit of $6.866.‼️
⚠️If buying pressure fails to break through the mid-point of the channel, a short trade could be a good entry point at the first trigger of 3.554.📉
🔆What do you think about this triangle? Does it exist‼️

RNDR heading towards 5 dollar zoneThe price has been rallying upward since it bounced from the monthly support. This has been a very significant move. THere was a weekly resistance on the way which just made the price pause a bit but eventually it went further up. Now the price is aiming for the next resistance which is a weekly resistance labeled as WR1 on the chart. But such resistances do not carry significant value as they are very old one and as it gets older, its effect weakens. And therefore, it should not be attributed a lot of importance, however, it can definitely provide some hints about the price direction by looking at the price action when the price hits this area. Anyways, long story short, I think the price is definitely going to aim for that resistance irrespective of what it does after that.
