RNDR shortRNDR looks heavy atm... Time for a short position...
It lost the trendline, made a deviation allready...
See chart for more info...
Rndr

RNDR IS REALY BEARISH (1D TF)rndr has been forming a large bearish triangle for some time now. We now seem to be in wave E.
The waves of this triangle are for the daily time frame and it takes time.The red box is the right place for the termination of the last wave of this triangle, i.e. wave e, and then the symbol can enter a strong falling wave. You must control your risk and do not enter a position without capital and volume management.

RNDR/USDT Break the key level area, Bullish Momentum ??? Yello Paradisers, Potential Coin!
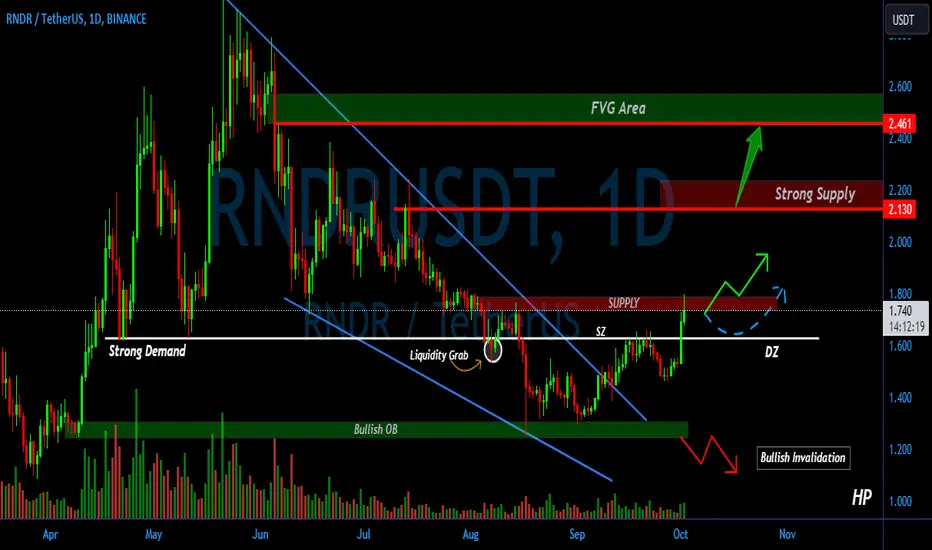
💎 RNDR has surpassed a crucial level area, solidifying the anticipation of bullish movement. Additionally, RNDR has broken out of a Major falling wedge pattern, enhancing the prospects of bullish momentum.
💎 Prior to breaking out of the falling wedge, RNDR faced challenges maintaining its stance in the Bullish OB Area. It’s observable that RNDR touched the Bullish OB area thrice and consistently rebounded, leading to the assumption that RNDR was still in the accumulation phase before finally breaking out of the major falling wedge area.
💎 Post breaching the key level area, RNDR faced rejection in the supply area and is likely to undergo a downward test in the strong demand area around $1.65, with the expectation of resuming upward movement subsequently. It is plausible that RNDR will experience significant movement towards testing a strong supply area.
💎 This scenario would be deemed invalid if RNDR breaks and closes below the Bullish OB area.

4 Gaming Projects With 4-10x Growth Possibility!!!1. CHZ
Chiliz is the leading digital currency for sports and entertainment by the eponymous Malta-based FinTech provider. It operates the blockchain-based sports entertainment platform Socios, which enables users to participate in the governance of their favorite sports brands.
2. RNDR
RenderToken (RNDR) is a distributed GPU rendering network built on top of the Ethereum blockchain, aiming to connect artists and studios in need of GPU compute power with mining partners willing to rent their GPU capabilities out.
3. ILV
Illuvium is an open-world fantasy battle game built on the Ethereum blockchain. Often touted as the first AAA game on Ethereum, Illuvium looks to provide a source of entertainment to both casual gamers and hardcore DeFi fans through a range of collecting and trading features.
4. ENJ
Enjin Coin is a project of Enjin, a company that provides an ecosystem of interconnected, blockchain-based gaming products. Enjin's flagship offering is the Enjin Network, a social gaming platform through which users can create websites and clans, chat, and host virtual item stores.

Render (RNDR) long and hold for whileRender (RNDR) has set a higher low.
If RNDR reclaims 1.66, (0.5 FIB-level), I think it goes for higher highs on weekly time frame (85% gains)
If you have conviction on RNDR this could also be a good DCA spot.
RNDR moves fast, so this long time move can play out faster than you think!

RNDR IS VERY BEARISH (4H TF)RNDR has reached a daily resistance. RNDR actually returned to this resistance, which is a falling order block, to gather orders.
CH has made a downtrend which is a good confirmation. In my opinion, RNDR is very runny.
I have specified the goals.
I have specified the invalidation level, closing 1 daily candle above this level will cause an analytical violation.
For risk management, please don't forget stop loss and capital management
When we reach the first target, save some profit and then change the stop to entry
Comment if you have any questions
Thank You

RNDR SHORTBINANCE:RNDRUSDT SHORT
Deviation above range highs to hunt stops and back inside the range again.
Bearish divergence building up on 6h since last Friday.
Entry now: 1.48
Target: 1.33
Stop: 1.54

RNDRUSDT Promising Trajectory💎 On May 19th, #RNDRUSDT reached its highest point in 400 days, testing the $2.95 level. However, what followed was a persistent decline, resulting in a substantial 57% drop.
💎 A noteworthy aspect of this decline is the price action surrounding the 61.8% Fibonacci support level. Bulls have demonstrated resilience in defending this critical level. Simultaneously, a bullish divergence pattern has emerged on the MACD indicator, hinting at a potential trend reversal.
💎 Adding to the positive developments, last week witnessed a decisive breakthrough above the downtrend trendline by #RNDR. This represents another significant piece of the price action puzzle.
💎 With these factors combined, it becomes plausible to consider that the probability of an uptrend has significantly increased. As long as #RNDRUSDT maintains its foothold above the current support area, the prospect of a sustained long-term uptrend remains intact.
💎 A formidable resistance barrier looms at the psychologically significant level of $3.00, coinciding with the 161.8% Fibonacci retracement level. This implies substantial upside potential, amounting to nearly 140%. However, it's essential to recognize that such a robust move may unfold over weeks, if not months.

BTC / RNDR / ID / ASTR = coin analysisif you like the idea, please "Like" it. This is the best "Thanks!" for the author 😊 P.S. Always do your own analysis before a trade. Put a stop loss. Fix profits in installments. Withdraw profits in fiat and please yourself and your friends.

RNDRUSDT heading towards weekly resistanceThis one is going as per expectation. The monthly support is doing its job and holding the price well and making the price bounce if the price hits that level. High time frame view is still the same and expectation is there that the price will be held by the monthly support and will head towards weekly resistance. I do see that weekly resistance stopping the price and making it stop its upward move at least temporarily but we will reevaluate once the price reaches that resistance zone.

RNDR SHORTBINANCE:RNDRUSDT SHORT. Horizontal resistance and 6hr bearish divergence. Rejected at range highs, looking for a move towards range lows again.

Can be a reversal pattern, double top | Short BiasDaily Chart
Render Token is in consolidation phase in range 1.25 - 1.55 and it's trading at 1.485 now. Very nearly resistance
Chart 4H TF
BINANCE:RNDRUSDT is still uptrend and moving up to resistance around 1.55
This level is very strong, so I don't think RNDR can break out now. Besides, this level is retracement 0.618 Fib that's why I more likely for short position.
Wait for next move

long RNR$RNDR broke through the descending trendline and resistance level. BUllish movement to $1.73 is expected to happen.

Downtrend is coming back | Short BiasChart 4H TF
Render Token BINANCE:RNDRUSDT has been recovering to resistance at 1.55 and rejected this level.
Now, it's trading at 1.465
I expect price will test resistance one more time before turn back to main trend
Wait for next move

Crypto Cup & Handle Alert! 🚀 Entry .90c-1.00 | Targeting $8.00Entry .90c-1.00
Clear cup and handle pattern.
Repeat of cup from .93c gives a completion target of around 8.00

RNDR on monthly support, very likely to head higherAs mentioned in the original post, this one has hit the monthly support and has been since trading around that support zone. The price has bounced from there and I think it is getting ready for the upward move. I think this is a very good opportunity. Even if the price dips again into the support zone, the probability of bouncing from there is very high although I do not see very likely that the price will dip deeper into the support zone again. This is also characterized by the last weekly candle close which rejected any attempt to go lower than the previous weekly low.

🔥 RNDR Bearish Triangle TradeRNDR was great early in the year, but is losing it's gains in a quick manner. This trade is based on the idea that RNDR will give away most of it's 2023 gains and will move down towards the support level of the triangle.
To increase the risk-reward, I'm going for an aggressive entry at 1.44, stop just above the recent local high, target at the bottom support of the pattern.

#RNDR/USDT 1D (Bybit) Rising wedge breakdown and retestRender Token pulled back to 50MA resistance and could push a bit higher before resuming the retracement down to 200MA support.
⚡️⚡️ #RNDR/USDT ⚡️⚡️
Exchanges: ByBit USDT, Binance Futures
Signal Type: Regular (Short)
Leverage: Isolated (2.2X)
Amount: 5.0%
Current Price:
2.27450
Entry Zone:
2.29510 - 2.52750
Take-Profit Targets:
1) 1.89170
2) 1.50035
3) 1.10905
Stop Targets:
1) 2.84610
Published By: @Zblaba
CRYPTOCAP:RNDR #RNDRUSDT #Render #AI #BigData #GPU #Web3
Risk/Reward= 1:1.2 | 1:2.1 | 1:3.0
Expected Profit= +47.4% | +83.1% | +118.8%
Possible Loss= -39.7%
Estimated Gaintime= 1-2 months
rendertoken.com

RNDRUSDT at monthly support and the support likely to holdThe price has hit the monthly support zone. It has bounced from there but a revisit possibility to that zone cannnot be denied. However, this is a high time frame support and shall hold on monthly basis and therefore offers long opportunity. The first resistance that would be faced by the price in case of upward move is the weekly resistance sitting around 1.63-1.72.

RNDR LOOKS BEARISHHi, dear traders. how are you ? Today we have a viewpoint to SELL/SHORT the RNDR symbol.
For risk management, please don't forget stop loss and capital management
When we reach the first target, save some profit and then change the stop to entry
Comment if you have any questions
Thank You

RNDR/USDT is Building Momentum for Next Rally
💎 On the 1D timeframe, RNDR is sketching an optimistic scenario, suggesting a potential bullish surge.
💎 The MACD is tilting towards a bullish divergence, signaling a possible upward shift following the consolidation breakout.
💎 A retrospective glance reveals the price took a downturn after establishing equal highs. Moreover, the shift from demand to supply further intensified the bearish pace.
💎 There's a clear untouched supply and bearish territory. It seems likely that RNDR will target this area for equilibrium in the near future. However, if the price slips past the support zone, brace for a potential drop.
💎 In the dynamic realm of crypto, staying informed is essential. Keep an eye out for further insights and relish your trading adventure.

Breakdown the support | Short BiasDaily Chart
BINANCE:RNDRUSDT has broken down the support and now it's retesting to drop again.
Render Token has the support at lower line of ascending channel.
So wait for rejecting and short
