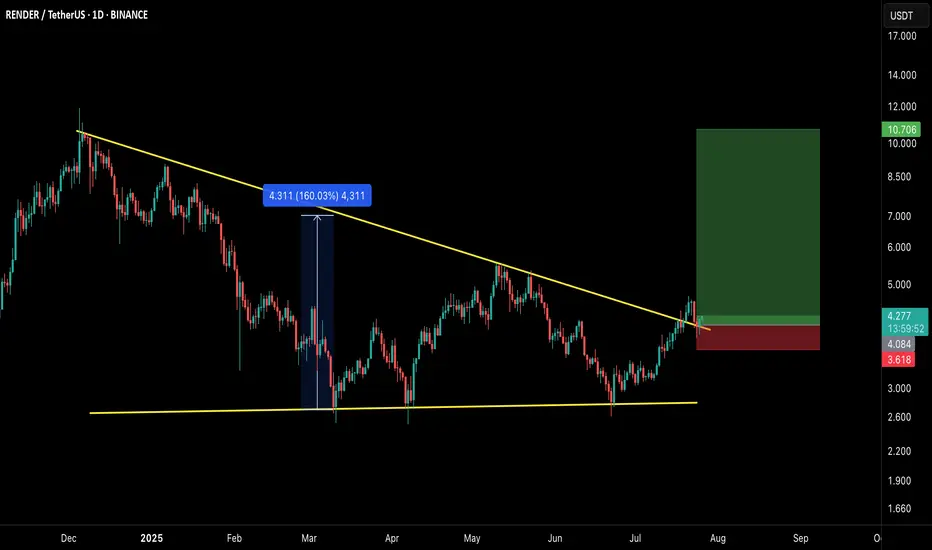
$RNDR/USDT – Breakout Setup Alert!RNDR has officially broken out of the long-standing descending trendline, confirming a bullish reversal structure. This breakout comes after a sustained consolidation phase and successful retest, indicating strength in buyer momentum.
🔍 Technical Breakdown:
Descending triangle breakout confirmed
Previous breakout from similar structure yielded a massive 160% rally
Currently retesting the breakout zone, providing a high R:R long entry opportunity
Clear invalidation point below the recent local support
🟢 LONG Setup:
Entry Zone: $4.00–$4.30
Stop Loss: $3.60 (below breakout retest & structure)
Targets:
TP1: $6.00
TP2: $8.00
TP3: $10.70+ (full breakout projection zone)
🧠 Strategy Insight:
This setup aligns with a broader bullish market structure across multiple altcoins. If momentum continues, this could mirror the prior explosive leg. Always manage risk accordingly.
⚠️ This is not financial advice. DYOR and use proper risk management.
💬 Let me know your thoughts or if you’re riding this wave!
RNDRUSDT
Render is at an inflection. Bounce or LL?RENDER technically is still in a downtrend. Given the current events, it is likely that a lower low will confirm the trend continuation. Keep in mind that the price is now oversold. Time to watch for support signals.
Full TA: Link in the BIO
RNDR Trade Setup – Double Bottom & Support ReclaimRender (RNDR) has shown strong resilience by forming a double bottom and reclaiming the key $4 level, signaling potential strength. We’re now watching for a sweep into downside liquidity (sub-$4 wick), with a daily close still holding above $4—this would confirm a strong long opportunity.
🔹 Entry Zone:
$3.50 to $4.00
🎯 Take Profit Targets:
🥇 $5.64
🥈 $6.70
🛑 Stop Loss:
Daily close below $3.00

RNDR Long Swing Setup – Double Bottom at Key SupportRNDR has formed a textbook double bottom at the $3.00 high-timeframe support, hinting at a potential trend reversal. The strong bounce off that level shows bullish intent, and we’re now eyeing the $3.50–$4.00 zone for a potential throwback entry, turning old resistance into new support.
📌 Trade Setup:
Entry Zone: $3.50 – $4.00
Take Profit Targets:
🥇 $5.25
🥈 $6.60
Stop Loss: Daily close below $2.70

ALTS Shine, +55% INCREASE !! FTM | RNDR | Render and Fantom have made steep increases over the past two weeks.
In the past two weeks, FTM increased a whopping 55%:
And RNDR increased around the same amount:
This naturally makes it likely to see a correction soon, which may be the ideal time to get into the accumulation boat - or just for a swing trade.
________________________
GEMINI:RNDRUSD CRYPTO:FTMUSD

RNDRUSD - W Pattern BreakoutRNDR Looks as if it has formed a double top but it is secretly a W pattern waiting to form within this wedge / triangle structure
Still bullish as long as price stays above the dotted white line
Bullish on this daily timeframe

RNDR SHORT/LONGWe had a strong reaction from $3.5, with a bounce of nearly 50%. Currently, the price is at a support level of around $4.1.
From here, the price could either consolidate or gradually move lower toward $3.5, possibly even $3, as the Stoch RSI still has room to go down.
However, a short-term rally toward the 21 EMA on the daily timeframe ($5.6) is also possible.
I'm considering entering a short if the price makes a fakeout above the 21 EMA, targeting at least $4. After that, if the setup aligns, I would look for opportunities to scale into long positions. We also need to remember that on February 11, RNDR will release 0.10% of its total supply into circulation.
This could add some selling pressure, so it’s worth considering when evaluating potential price movements.

Render Network RENDER Long: EWT Analysis & Cycle Peak Targets+ Possible overextended Wave 5 count now?
Trading within Wave (3) of Wave V impulse.
Any major peaks in RENDER have extended as high as the following fib extensions...
The target is the peaks of the parallel channel, confluence with the fib extensions targets:
- 1.414
- 1.618
Last Rally for Cycle Wave V (five) topping around Nov/Dec 2025 being a blow off top.

RNDR | BULLISH ALTS | RNDR Incoming ATH Render has been one of my top alts since Jan 2024, and it hasn't disappointed, currently standing at 140% increase, and if you account for the ATH in March, 245%.
As Bitcoin trades range we're patiently waiting for Ethereum to make a new ATH. This will encourage the rest of alts to make a final push up, that is AFTER ETH made a new ATH. That's why it's so important to watch Ethereum, and the Bitcoin dominance chart.
More on that topic HERE:
____________________
GEMINI:RNDRUSD

$RENDER prepares for growthThere is already a consolidation above the 50 EMA, on a Fibonacci level I would expect a price around 1.618 ($20). Meta AI is starting, Render is one of the big projects in this area. I wish everyone good luck!
Horban Brothers.

Long-Term Accumulation Opportunity in RNDRUSDTI would like to share a long-term accumulation strategy for RNDRUSDT that I've been eyeing.
Chart Patterns and Indicators:
Descending Channel: The price is currently moving within a descending channel, indicating potential breakout opportunities.
Harmonic Pattern (XABCD): The pattern suggests potential reversal points at identified accumulation zones.
Volume Analysis: Increased volume at support levels indicates strong buying interest and validation of accumulation zones.
Current market sentiment shows a mix of consolidation and potential bullish reversal, supported by the harmonic pattern and volume spikes at lower levels.
This long-term accumulation strategy for RNDRUSDT focuses on systematically entering positions at identified support levels and distributing at key resistance points. This methodical approach aims to capitalize on both the technical patterns and market sentiment, ensuring a balanced risk-reward ratio.
Additional Details about Render Token (RNDR):
Market Cap: Approximately $3.92 billion
Fundamentals: Render Token is a decentralized GPU rendering network that connects artists and studios needing GPU compute power with mining partners willing to rent their GPU capabilities.
Potential: High demand for GPU rendering in the fields of VR, AR, and complex 3D modeling.
Text Help by GPT :P, trust me he is way better at words!

RNDR Long Position (Accumulation Phase)Market Context: RNDR has been through an extended markdown phase, with market makers taking profits, driving prices down to fair value. Now, the market appears to be in an accumulation phase, where most of the weak hands have exited. This creates an opportunity for strategic entry, positioning for the next bullish move.
Trade Setup:
Entry: $4.70 - $5.30
Take Profit:
First target: $6.30
Second target: $7.50
Third target: $9.00
Stop Loss: Daily close below $4.50
This trade aims to capitalize on the potential accumulation phase as RNDR prepares for a possible move higher. #RNDR #Crypto #Accumulation #PriceAction #Trading

RENDER/USDT longSL: 4.59
TP: 7.32
HL and HH, good Risk/Reward ratio.
Move stop loss to entry price if close above 5.92$.

RNDR Long Spot Position (Support Consolidation)Market Context: RNDR has been consolidating in a key area of support, providing a good opportunity to enter a long spot position.
Trade Setup:
Entry: Ladder into a long spot position in the $4.20 - $5.00 support zone.
Take Profit:
First target: $5.90 - $7.05
Second target: $9.80 - $11.00
Stop Loss: Just below $3.90
📊 This setup takes advantage of the support consolidation with defined risk and potential upside. #RNDR #Crypto #LongTrade

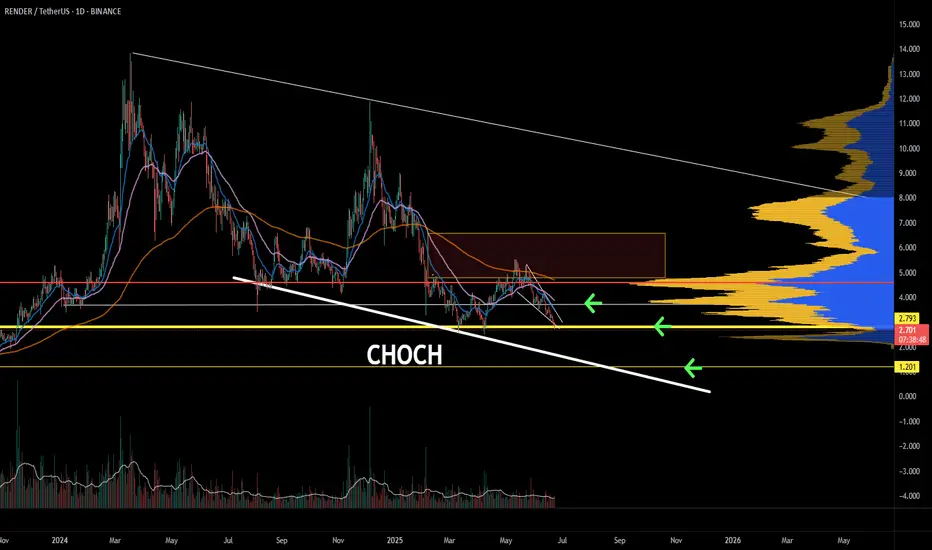
Is #RENDER still in a downtrend?#Render 1D chart;
Continues the downtrend that started in March with lower highs
It was last downtrending at $6.3 (CHoCH)
A close above the $7.2 level is required before we can talk about a rebound
Otherwise, the levels where it can go by making lower highs;
First OB support at $3.7
If it loses here, the IMB level will be $2.8.
Of course, although its first priority in every upward move is to overcome the previous low peak, it should not be forgotten that the downward trend line (red line) will also act as resistance.

RNDR: Render BEST BUY ZonesRENDER is one of my top altcoin pics for 2024.🏆
It increased a generous 305% since the beginning of the year, and a new bullish cycle is likely next s soon as we hit the ideal re-accumulation zones where whales prefer to buy back.
A -77% retracement hit the next major demand zone, where I expect to see a decent bounce. Between this zone and the lower zone , I'd be looking to re-accumulate for a loner term hold position:
👍 Follow Us to make sure you stay updated
_____________________________
BINANCE:RENDERUSDT

#RNDR/USDT#RNDR
The price is moving in a descending channel on the 4-hour frame and is about to break upwards
We have a trend to stabilize above the moving average 100
We have a downtrend on the RSI indicator that supports the rise by breaking it upwards
We have a major support area in green at a price of 3.40
Entry price 4.00
First target 5.00
Second target 6.00
Third target 7.13

RNDR USDTRNDR is moving inside the descending channel and bounced from the support zone (Blue) at $2.866 - $3.272. Currently the price finds the support at $4.245 level and resistance at the middle line of descending channel.
If the price breaks above the descending channel and the resistance zone (Green) at $5.747 - $6.038 with high volume.
If the price fails to holed the support level at $4.245 and the support zone (Blue) then we will see more decline in the price to the next levels.
Everything is on the chart

Render Token / RNDRThe price of RNDR is $1.83 today with a 24hour trading volume of 180 million dollars. This represents a 4% price increase in the last 24 hours and a 333% price increase in the past 30 days!
Render token is a distributed GPU rendering network built on top of the Ethereum blockchain, aiming to connect artists and studios in need of GPU compute power with mining partners willing to rent their GPU capabilities out. Backed by parent company OTOY, the RNDR team is based out of Los Angeles, with team members throughout the world. The RNDR advisory board boasts industry leaders such as Ari Emanuel (Co-Founder and Co-CEO, WME), JJ Abrams (Chairman and CEO, Bad Robot Productions) and Brendan Eich (Founder and CEO, Brave Software and BAT)
bulls broke 0.8, 1.2 and 1.6 resistance and ready to claim 2$. I got into rndr wen it has 220 million market-cap and here we are at half a billion dollar mc. as you see market is in correction phase which is normal and healthy so don't panic if you see couple of red candles after 300% pump

What is next for RENDER?Hello everyone,
Here are my targets for CRYPTOCAP:RNDR during the bull market, as shown on the chart:
I'm setting the ATH (All-Time High) of this coin at $47 this season. However, as I've mentioned before, you cannot predict what will happen in a bull market. So, I always have a plan B with a more ambitious target of $320.
Although supports and resistances are demonstrated on the chart.
I say this because some altcoins will experience significant price surges during the bull market, far exceeding others.
Especially lately, CRYPTOCAP:RNDR has migrated to the CRYPTOCAP:SOL blockchain. Therefore, if SOL experiences a significant surge, all Solana-related altcoins could see substantial upside movement.
Feel free to ask any questions you may have.
Have a nice day!
Note: Charts and ideas will be updated as necessary.

What is next for RENDER?Hello everyone,
Here are my targets for RENDER during the bull market, as shown on the chart:
I'm setting the ATH (All-Time High) of this coin at $47 this season. However, as I've mentioned before, you cannot predict what will happen in a bull market. So, I always have a plan B with a more ambitious target of $320.
Although supports and resistances are demonstrated on the chart.
NOTE: RENDER was previously known as RNDR, it`s now migrating on Binance and will be re-listed at 26th of July
I say this because some altcoins will experience significant price surges during the bull market, far exceeding others.
Especially lately, RENDER has migrated to the SOL blockchain. Therefore, if SOL experiences a significant surge, all Solana-related altcoins could see substantial upside movement.
Feel free to ask any questions you may have.
Have a nice day!
Note: Charts and ideas will be updated as necessary.

Trading opportunity. ETH, BNB, NEAR, RNDRHi traders and investors!
I have chosen 4 assets on which to look for purchases.
The price of each asset formed a sideways trend on the daily TF and is now at the lower boundaries of these sideways (above the lower boundaries).
ETHUSDT. Current buyer vector 10-11 on the daily TF. Potential target – 3977.
On the hourly timeframe, the price has formed a sideways trend and now the buyer is attacking the upper boundary of the sideways trend. You can search for purchases:
after the launch of a long trend on the hourly timeframe (the buyer protects the exit from the sideways trend on the hourly timeframe and the formation of a new buyer impulse)
from protection by the buyer of the lower boundary of the sideways trend 2822 -2810.
BNBUSDT. Current buyer vector 10-11 on the daily TF. Potential target – 645.2
On the hourly time frame, the price has formed a sideways trend and now the price is near the upper boundary of the sideways pattern. You can search for purchases:
after the launch of a long trend on the hourly timeframe (the buyer protects the exit from the sideways trend on the hourly timeframe and the formation of a new buyer impulse)
from protection by the buyer of the lower boundary of the sideways trend 471 - 454.
NEARUSDT. Current buyer vector 5-6 on the daily TF. Potential target – 6.89
There is a short trend on the hourly timeframe. It is advisable to look for purchases when the buyer overcomes the beginning of the last impulse of the seller 5.003, protects this level, and forms a new impulse.
RNDRUSDT. Current buyer vector 8-9 on the daily TF. Potential target – 11.88
There is a short trend on the hourly timeframe. It is advisable to look for purchases when the buyer overcomes the beginning of the last impulse of the seller 8.273, protects this level, and forms a new impulse.

Target 7-7.4-7.9Following daily chart.
Falling wage was broken, also got a long signal from my indicator.
TP1 7
TP2 7.4
TP3 7.9
Not a super good RR but I'll stop below 6.
