RNDRUSDT is in a tough spot! See why hereLooks like we could see momentum ranging and then we see a big dump.
Because price is below Center of Contraction on the 2H timeframe, we are only looking for shorts!
RNDRUSDT

Important update on the Crypto Market; understand RNDR!Quick Intro
In this fundamental analysis article, we will explore RNDR (RenderToken), a distributed GPU rendering network built on the Ethereum blockchain. RNDR aims to revolutionize the rendering industry by connecting artists and studios with GPU providers in a decentralized manner. We will delve into the workings of RNDR, its token utility, and the notable aspects of the project.
Overview of RNDR:
RNDR was conceptualized by Jules Urbach, CEO of OTOY, Inc., in 2009 and launched in 2017.
The project conducted its first public token sale in October 2017, followed by a private sale period from January to May 2018.
RNDR raised a total of 117,843,239 tokens during the private sale, with each token priced at $0.25 USD equivalent.
The RNDR Beta Testnet involved early adopters, including beta node operators and artists, who collaborated with the team to refine and test the network.
On April 27th, 2020, RNDR went public with its official launch.
How RNDR Works:
RNDR operates on the Ethereum blockchain, utilizing the ERC-20 standard for its utility token.
Artists on the network can exchange RNDR tokens for GPU compute power provided by GPU operators, enabling efficient rendering of complex graphics.
RNDR employs a combination of manual and automatic proof of render mechanisms to ensure the successful completion of rendering tasks before payment is disbursed and the artwork is released.
The network utilizes the inherent security properties of the Ethereum blockchain to hash and distribute proprietary assets to nodes for rendering.
Payments for rendering services are held in escrow during the process and released to node operators upon manual verification by the commissioning artist.
To prevent malicious activities, rendered assets remain watermarked until payment is received, and all payments are held in escrow until successful verification.
About RNDR:
RNDR is backed by OTOY, Inc., with its team based in Los Angeles and members located worldwide.
The advisory board includes industry leaders such as Ari Emanuel, JJ Abrams, and Brendan Eich, providing guidance in aligning the project's objectives with the cryptocurrency and Hollywood production communities.
RNDR has seen growth in its user base, with the number of active addresses reaching 29,000 compared to 22,000 three months ago, indicating increasing adoption and interest.
tldr:
RNDR presents a unique use case for blockchain technology in the rendering industry, providing artists and studios with access to efficient GPU compute power. The combination of decentralized rendering, secure payment mechanisms, and a renowned team backing the project positions RNDR as a potential disruptor in the field. As the project continues to grow its user base and expand its network, the future adoption and utility of RNDR will be key factors in determining its long-term success.
My mid-term thoughts on the price:
The TPI is currently in the negative territory, to we might go lower in the mid-term (couple of days / weeks).
On the Long term I do see the price of RNDR going up if the strength of the cryptomarket continues to go up; the current long-term TPI is quite high.
Long term Crypto market is only slightly bullish on the long-term TPI:
Down below I linked a previous idea I made where I explain how the TPI works
I also linked the momentum channel indicator that I made, it's free for use here on TradingView, I made it a public script

RNDRUSDT long ideaThis can be a good scenario for a long position. We have both static support and dynamic support at this point. There is also a possibility of a head and shoulder pattern forming. The numbers in the chart do not mean my entry or exit point and I will enter the position after confirmation
⚠️ "Daily crypto market analyses I provide are personal opinions & not financial advice. Trading carries risks, so do your own research & seek advisor's help."

RNDRUSDTHello and welcome back,
*Mars Signals Team wishes you high profits*
This is a one-day-time frame analysis for RNDRUSDT
According to our last analysis on May 4, we expected a decline for the price to happen and currently we have this expectation happening well. In the present chart, R1 and R2 are the resistance areas to mention and both express the unsuccessful attempts of price in order to rise. S2 and S3 used to be resistance areas. And finally at the bottom, S1 is a long-term support line at which the support of price at various points is clearly seen. We can observe that the price was in a rising trend after breaking S3 upward but via some rejections and disabilities in order to rise more to higher amounts, it was supported well at S1 line and made its rise toward R2. There the pressure of sellers forced another decline and it fell toward S1 line again via a negative Marubozu Candle. At the moment, the price is fluctuating below R1 area and we believe the price to have more decline to touch S2 area or even by falling more and activating our stop-loss point, more support and fixation would happen and another rising trend is waiting for it to reach higher amounts such as R1 or R2 (which are believed to be great points to save your profits). By the time the price loses the support at S2 and moves below this area, it certainly faces more decline toward S3. So wait for it to have some support and fixation there, and then enter trading in its retest trend upward. Our prediction would be less decline when the price is moving and fluctuating over S1 line. Please be cautious about various points and details and remember that for enjoying less risky trades. You can obtain every piece of information and details through our analyses and updates. So keep moving with our team.
Warning: This is just a suggestion and we do not guarantee profits. We advise you to analyze the chart before opening any positions.
Have a great time

RNDR Finishing its ABC waveRNDR Finishing its ABC wave, might see an upward movement from here for a while.
Good luck.

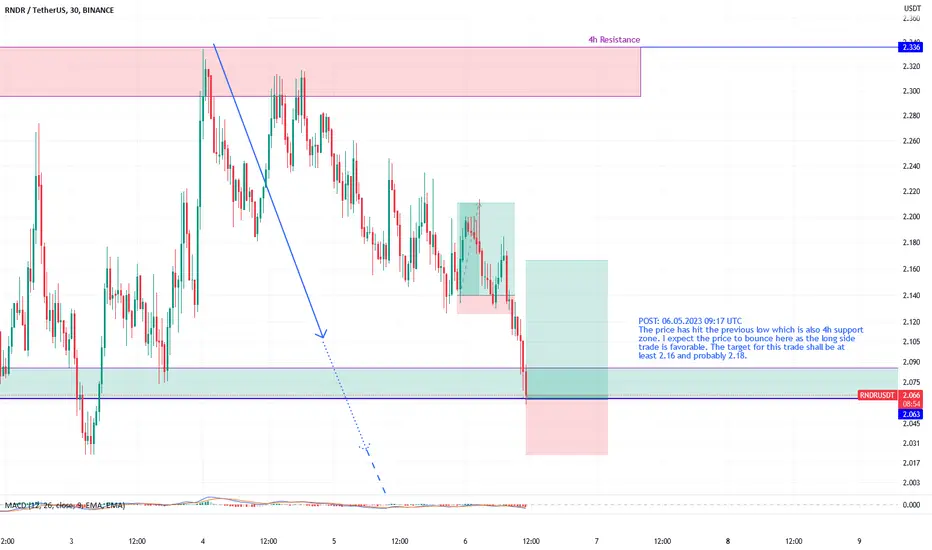
RNDRUSDT on 4h support and likely to head to 2.16The price has hit the previous low which is also 4h support zone. I expect the price to bounce here as the long side trade is favorable. The target for this trade shall be at least 2.16 and probably 2.18.
Rndrusdt Retesting Rndrusdt
Retesting big horizontal breakout level on higher time-frame
Incase of succesful breakout expecting massive bullish wave
Keep eyes on it

RENDER TOKEN BUY 🚀RNDRUSDT is currently forming a higher low before creating a higher high. My target is at arround the $3.00 mark.

RNDRUSDTHello again,
*Mars Signals Team wishes you high profits*
This is a one-day-time frame analysis for RNDRUSDT
As we analyzed on April 23, we predicted a rise to happen and here we observe a great rising trend which means our expectation happened correctly. In the present chart, R1 is the resistance area to mention and it expresses the unsuccessful attempts of price in order to rise. S1, S2, and S4 used to be the resistance areas. And finally at the bottom, S3 is a long-term support line in which the support of price at various points is clearly seen. We can observe that the price was in a rising trend when it broke S4 upward and could rise toward S1 but at some rejections, it faced a decline down to S3 line at which it received well supports and finally at its last point support, it experienced a notable rise toward higher amounts. The existence of some candles with shadows at R1 shows the pressure of sellers which made the price to fall again via two negative Marubozu Candles. Hence, it is fluctuating over S1 when it was supported there and we believe the price to have another increase by giving us more fixation and rising signs and then more increase is waiting for it up to R1; that is a good point for having your profits saved but wait for the price to reach this area and after retesting the market situation and the trend of the price, you can make sure of saving your profits. By the time we have the fluctuation of price over S1, we won’t have so much decline. Bear in mind that by the time the price loses the support at S1 and moves below this area, it faces more decline certainly toward S2. Our suggestion is less decline when the price is moving and fluctuating over S1 line. Please be cautious about various points and details and remember that for enjoying less risky trades. You can obtain every piece of information and details through our analyses and updates. So keep moving with us.
Warning: This is just a suggestion and we do not guarantee profits. We advise you to analyze the chart before opening any positions.
Good luck

rndrWe are in this box. It can break from any side, it can lead to a possible path. Downward and support lines, or the upward path that I am thinking of.


RNDRUSDT at resistance, a retrace likelyThe price has hit 4h resistance. I expect a pullback from here. Actually I am expecting more than a pullback. The price may slide to the next 4h support around 2.26 zone. Lets see how it develops. I will adjust the targets accordingly.

RNDRUSDT a long favorable from 2.36There was short trade opportunity from the target of the previous long trade. I had an order open overnight and closed that short now. I believe now there is a long opportunity with some profit if price moves to 2.36 level. The target shall be 2.423.

RNDRUSDT likely to head towards 2.488Bought some RNDR again at 2.386 for a target up to 2.488.It seems the price wants to move up to the next resistance zone after a bit of pullback from the current resistance zone.

RNDRUSDT likely to head to 2.436The price is at hourly support zone. A long is favorable here for a target to 2.436. However, there is chance that it breaks this support before bouncing enough from this support and reaching the trade target. In that case a long from 4h support zone 2.24-2.27 will be favorable.

Crap on daily TF RNDRUSDTCrap detected on daily TF
We have two PRZ
1st short it @ 2.7842
SL @ 3.0155
Target in fibo
2nd if stop loss hit second area short @ 3.1507
SL@ 3.4172
Will update the target once we got the short

RNDR/USDT SHORT 🔴RNDR / USDT SHORT 🔴
Leavareage 10x
Entry price- 2.52$
Take profit - 2.23$
Stop loss - 2.63$
@msrcrypto1

Long setup on RNDRUSDTButterfly pattern detected
Will try to take the wave from C to B
We have bullish OB expected the price to bounce from there to butterfly target mentioned in chart

Long setup RNDRUSDT 15M TFBat pattern detected got my long setup on PRZ ZONE 2 and liquidity area @ 2.1551
SL @ 2.1230
Targets in fibo
Mentain your stop loss

RNDR ShortShorting RNDR for a potential return of 40%. First off what drew me to enter shorting RNDR was the recent increase in price over the past two weeks. it has had a gain of over 50%. since the gains have been so big over the past two weeks i feel profit taking is about to begin when looking at the daily time frame. This idea is Supported by the bearish divergence, noted with a yellow ray, on both the Commodity Channel Index(CCI) and the Relative Strength Index(RSI). Although the 40% correction sounds tempting. I am looking for a more short term opportunity so I can reduce the likelihood of loosing money. with takin that into consideration I am looking to short to a range of $1.80-$2.00. This will yield me approximately 20-25% return on a $4000 short with translates to approximately HKEX:1000 profit. If I am right about the direction. The amount of time this short will take looks like it could be anywhere between 1-2weeks open.

Render token RNDR price is preparing to shoot up 🚀Looking at the price chart of RNDRUSDT, we can say with certainty that the increased interest of buyers in is
If you know why this project is interesting, please share your thoughts in the comments.
The price of RNDR has approached a strong liquidity zone, and it looks like buyers will try for the fourth time to break higher. That is, there is probably at least 60% upside ahead.
In our opinion, it is safe to enter long position:
- above $2.20 on the blue route
- if force majeure occurs and the price drops sharply (which now looks rather unlikely), then long from $1.50
The main thing is not to rush and wait for confirmation of a safe entry.
_____________________
Did you like our analysis? Leave a comment, like, and follow to get more

RNDRUSD fresh breakout RNDRUSD buy at 2.3 target 3.3.
short term target .
a fresh breakout on hourly chart

RNDR ShortRNDR reach a strong demand, So this currency represents a short position.
Of course, the stop loss and mony management should also be considered.
