Resistance Ahead | Short BiasOn week chart
$4 is the strong resistance zone for this bullish
If RNDR can break and close above $4, the next target around ATH $8
Otherwise, RNDR will accumulating in range $2-3 a while before massive move will happen
Time will tell
RNDRUSDT

RNDRUSDTIs RNDRUSDT exhausting at highs?
As the price is been on high bull run but now it seems like price is lacking bullish momentum after printing double top pattern at resistance level and bearish divergence suggesting the sell pressure is about to start.
If the bears took control , the 1st target could be 2.8 followed by 2.4.
What you guys think of it?

PEPEUSD on the Daily, Trading Ideas - PEPEUSD - Daily Chart
If Legacy Holds Tomorrow This could fly - its Alt Time atm.
Render has done flown again. PUMP IT.
This Daily Pepe Chart has turned Bullish with Momentum and Direction.
I wonder what Pepe 2.0 is doing right now.
Tune in regular - I'll be more active now I'm watching the charts again.

buy RNDRHi traders
in time 1H
enter buy : 3.27 - 3.22
target : 3.60 - 3.70
follow me
BINGX:RNDRUSDT.PS
BINANCE:RNDRUSDT

RNDR: Resistance BreakoutTrade setup : Trends have reversed to Uptrend after price broke back above $1.70 key level and above 200-day moving average. After pausing briefly, it broke above $2.50 resistance to signal continuation of Uptrend with upside potential to $3.30 near-term and possibly even $4.00 resistance thereafter.
Trend : Uptrend across all time horizons (Short- Medium- and Long-Term).
Momentum is Bullish (MACD Line is above MACD Signal Line and RSI is above 55).
Support and Resistance : Nearest Support Zone is $2.90 (previous resistance), then $2.50. The nearest Resistance Zone is $3.30, which it broke, then $4.00.

Pollback for Continue bull-trend❤️❤️Thanks for boosting 🚀 and supporting us!
📈break resistance and start bull-trend by big candle.
📊 (Buy) : 2.886$
🔴 Stop Loss : 2.717$
🎯 Take Profit : 3.199 -3.434$
🔗 For more communication with us, send a message in TradingView.

Target 3Following weekly chart.
My 2 indicator gave a green light for a long signal, also it's ready to break cup & handle formation.
TP 3
SL 1.23 - wait for weekly candle close.

Supply | Short BiasOn day chart
Render Token hit Supply Zone that is also the 2.0 Fibo Channel in my last idea.
First sign, RNDR failed at 2.6 and can pull back to Support around 2 this zone is good to join
You can trade on lower TF
Wait for next move

Rising from the bottom section above 2.566Hello traders!
If you "Follow" us, you can always get new information quickly.
Please also click “Boost”.
Have a good day.
-------------------------------------
(RNDRUSDT chart)
The key is whether it can receive support and rise in the 2.566-3.058 range.
(1D chart)
The key is whether it can rise above 2.987-3.415 based on the 2.773 point, or whether it can fall to the 2.209-2.566 range and receive support.
--------------------------------------------------
- The big picture
The full-fledged upward trend is expected to begin when the price rises above 29K.
This is the section expected to be touched in the next bull market, 81K-95K.
-------------------------------------------------- -------------------------------------------
** All explanations are for reference only and do not guarantee profit or loss in investment.
** Trading volume is displayed as a candle body based on 10EMA.
How to display (in order from darkest to darkest)
More than 3 times the trading volume of 10EMA > 2.5 times > 2.0 times > 1.25 times > Trading volume below 10EMA
** Even if you know other people’s know-how, it takes a considerable amount of time to make it your own.
** This chart was created using my know-how.
---------------------------------

Render (RNDR) ultra long, mega bullishA daily close above 2.75 and RNDR looking hot hot. Could this be the start of a mega break out, that you could hold for the whole bull run - I think so.
Either way, here's a set up for a potential 30% trade.
Zoom in on daily timeframe or just remove the noice and look have beautiful this chart is on weekly timeframe.
RNRD is risky - but it could be huge next year - non financial advice.
A potential pull back can happen (after the explosion today), but I think the time for a good entry is start to running out. Play it with your risk tolerance.

$RNDR to $60Fundamentals: #RENDER has announced building on #SOLANA as breakpoint. On of the leading AI-projects that will impact Film and Animation industry. Expect to see projects on SOL pump as Firedancer validator moves through test net and comes online.
Technical: From ATH to ATL, RNDR has formed a Wave 1 & 2 with 0.38 fib correction, now breaking through the 0.618 fib retrace and using it as support. Larger formation is the Wave 3 back to ATH, with speculated Wave 5 around $60.
Confluence with both 1.618 levels for Fib extension and Fib projections. If you don't know the difference -- one is placing the target from the ATH and ATL, while the other is projecting the target from Wave 1 and Wave 2 with a three-point measure.

Trade signal | Render Token (RNDR) setting up for upto 27% pumpHi dear friends, hope you are well and welcome to the new trade setup of Render Token (RNDR) with Bitcoin pair.
Previously we caught almost 13% pump of RNDR as below:
Now on 2-hr time frame, SANTOS is completing the final leg of a bullish AB=CD move for the next price reversal.
Note: Above idea is for educational purpose only. It is advised to diversify and strictly follow the stop loss, and don't get stuck with trade.

RNDR target 5.512h time frame
-
RNDR is creating a bottom structure under 3, and there is a first pumping wave started from 0.4 to 2.99 which verify the resistance of 3 again. However, RNDR got support on 0.382 Fibonacci Projection and keep pumping, this is a good bullish sign. Through Fib, the first target is around 3.7~4 and next is 5.5, then we can set up a trading plan.
TP: 3.7~4 / 5.5
SL: 1.67150

Recovering Phase from $2.1 to $2.3Daily Chart
Render Token is in Ascending Multi Channel by #FiboChannel
Now, it's trading around $1.88x and it's not below resistance $1.9 and nearly the higher trend line of channel
If BINANCE:RNDRUSDT fail, it can create Double Top which Reversal Pattern then come back to support $1.65 that's good zones to buy in my opinion
Just wait for next move

RNDR: Overbought at ResistanceTrade setup : Trends have reversed to Uptrend. Price bounced up off of support at $1.30 and broke back above $1.70 resistance and above 200-day MA (~$1.78) to signal resumption of Uptrend. However, price is now very overbought (RSI > 80!) just as it approaches $2.50 resistance. Hence, near-term, we’re likely to see it pause here on some profit taking.
Trend : Uptrend on Short- and Medium-Term basis and Neutral on Long-Term basis.
Momentum is Bullish but extremely overbought. (MACD Line is above MACD Signal Line). RSI is bullish (> 55) but extremely overbought (> 80) which could imply that price could briefly pause or pull back if it reaches Resistance.
Support and Resistance : Nearest Support Zone is $1.70 (previous resistance), then $1.30. The nearest Resistance Zone is $2.50, then $2.90.

RNDR VOLUME INCREASEThank you for reading our update. Please remember that this is not advice for trading.
RNDR Looks to have a new uptrend volume


RNDR shortRNDR looks heavy atm... Time for a short position...
It lost the trendline, made a deviation allready...
See chart for more info...

RNDR LONG SWING IDEA +60%Current price holding and rejection from POC.
Opens the door to the VAH level, but before that I expect another drop because the 100 and 200 Dma arrive at the daily level of 1.72.
If the setup appears down again at POC or a little below the last monthly level, you can entry to swing long and try to capture 60% of the profit.
I showed where I would hold a stop loss if this idea comes up.
A hidden bullish divergence appeared on the weekly.
Below stop loss to be passive, possibly a DCA who follows and believes in this project.
If you like this post, check my profile and find something useful!

RNDR IS REALY BEARISH (1D TF)rndr has been forming a large bearish triangle for some time now. We now seem to be in wave E.
The waves of this triangle are for the daily time frame and it takes time.The red box is the right place for the termination of the last wave of this triangle, i.e. wave e, and then the symbol can enter a strong falling wave. You must control your risk and do not enter a position without capital and volume management.

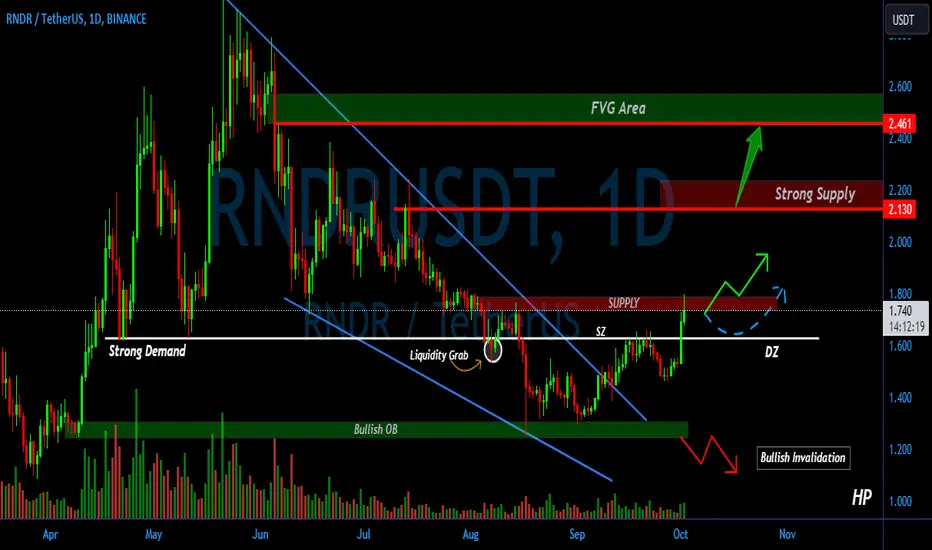
RNDR/USDT Break the key level area, Bullish Momentum ??? Yello Paradisers, Potential Coin!
💎 RNDR has surpassed a crucial level area, solidifying the anticipation of bullish movement. Additionally, RNDR has broken out of a Major falling wedge pattern, enhancing the prospects of bullish momentum.
💎 Prior to breaking out of the falling wedge, RNDR faced challenges maintaining its stance in the Bullish OB Area. It’s observable that RNDR touched the Bullish OB area thrice and consistently rebounded, leading to the assumption that RNDR was still in the accumulation phase before finally breaking out of the major falling wedge area.
💎 Post breaching the key level area, RNDR faced rejection in the supply area and is likely to undergo a downward test in the strong demand area around $1.65, with the expectation of resuming upward movement subsequently. It is plausible that RNDR will experience significant movement towards testing a strong supply area.
💎 This scenario would be deemed invalid if RNDR breaks and closes below the Bullish OB area.

Render (RNDR) long and hold for whileRender (RNDR) has set a higher low.
If RNDR reclaims 1.66, (0.5 FIB-level), I think it goes for higher highs on weekly time frame (85% gains)
If you have conviction on RNDR this could also be a good DCA spot.
RNDR moves fast, so this long time move can play out faster than you think!
