ROKU abc down into Consolidation: Support for OcotoberWhile not an Elliott guru looks like a nice abc down into a solid support area. Fib fan along with fibs and a trend line indicate might be a good buy low location. The triangle represents multiple layers of support, a wall of sorts. ROKUs business model isn't broken. People like their stuff and I think they'll have a strong following despite aapl, disney, etc.
ROKU

$ROKU Long - Momentum TradeFor the public record -- I've taken a LONG position in ROKU at $104.00 minutes ago.
My trade is technical, and I've taken the trade given I perceive a positive momentum breakout to be on the horizon for the stock.
My opinions and trade actions are not recommendations to anyone to buy or sell any financial instrument. I'm simply posting the executions of my trades for the record.

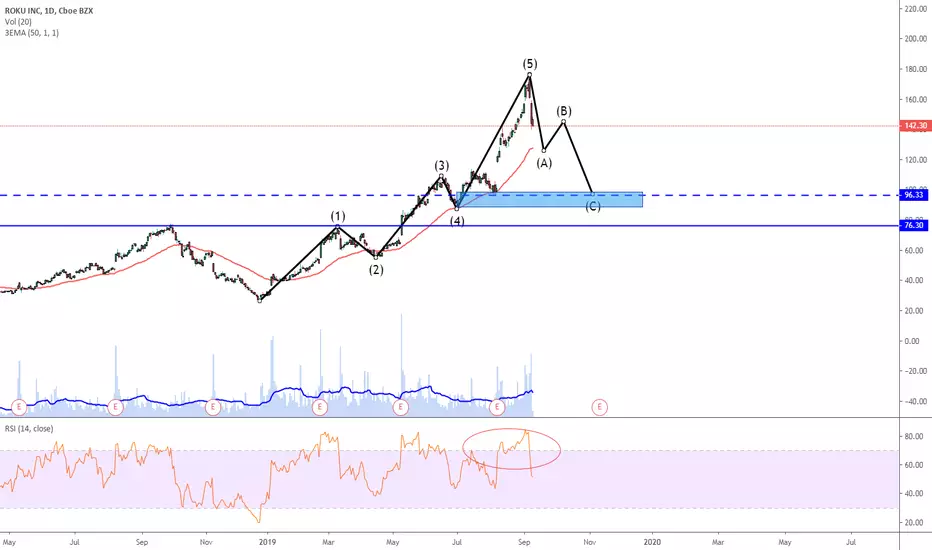
Roku - Downtrend remains despite lurking pullbackSince december 2018 Roku has been in a clear impulsive wave that topped at 175 and made a sharp reversal.
This correction has more the caracteristics of an impulsive wave than a correction, so, I suspect this to be only the first leg, wave A, of the overall correction.
For now we can count 3 waves which means we should see a small pullback for wave (iv) followed by a new push lower for wave (v) before we see it go higher for red wave ((b),
followed after by red wave ((c)) which should then make a new low.
Levels to Watch are the Fib retracements, 50% at 100.0, ; 61.8% at 82.3 ; and the last line of defense for bulls, the 78.6% level at 57.7.
Don't forget to keep an eye on RSI and MACD for some bullish divergence before considering wave ((a)) in place.

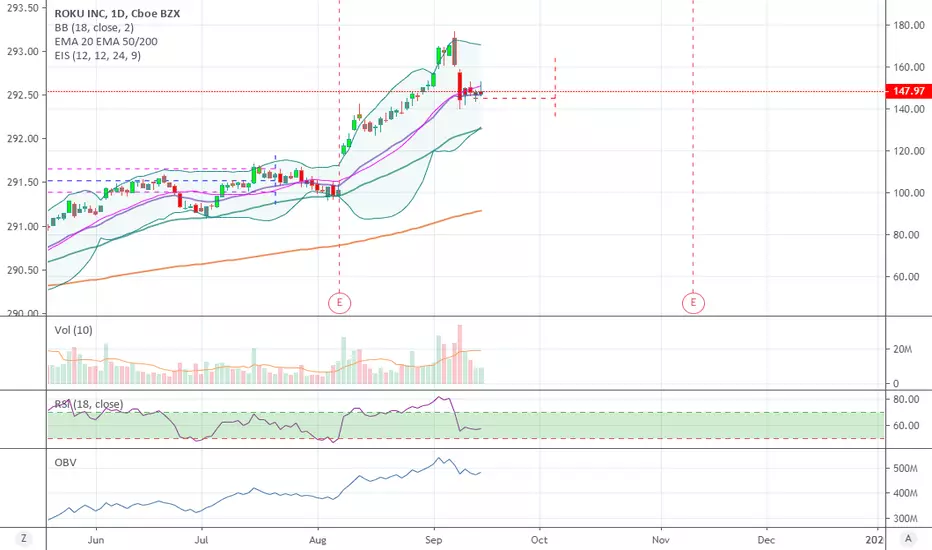
ROKU filled gap below, looking for upside potential long termROKU just filled the gap below created on the 7th of august due to an earnings report. Looks like a good price to buy for a long term investment. There is also good volume lately witch helps price go up as there is more interest in the stock.
A good stop loss would be a confirmation break of the 200 daily moving average. Then it could go down to the next big level of support which is the red trend line that I have drawn on my chart.
As this is an investment type trade, I don't have a take profit target. Anything could happen...
I wanted to include a YouTuber that specifically uses the gap strategy in his trading and has perfected it for months now. Here is the video on the trade and how he explains it in more detail: youtu.be

Watching ROKUWatching for ROKU to fall into the $93-$83 range. Here I will look at the lower time frames for a complete 5 wave structure within wave v.
Even considering a larger correction to play out, like and ABC flat or triangle, the next move is up. The .618 fib is the perfect spot to find support with the current wave structure.
I will decide at the time how to play this - likely a vertical options spread.

Market Legend Alex Vieira Refers to ROKU as Bubble SCAMIndeed 100% of Americans turned bullish when Alex Vieira was live selling ROKU $175

History might repeat itself..Another analysis, if history repeats itself.
50MA becomes resistance
Price starts to hunt for the 200MA, Once MA crosses that 50.
Then if breaks 200, It may come down to 60.
It's scary to take it long from here. Don't try to catch a falling knife.
Confirm first for a good entry on the D/W/ indicators, for any reversal signals.
Possible Next levels. 98 -> 88 -> 80 range (200MA) -> 60 range.
Thanks.

Gap filled. Time to buy??ROKU has been slaughtered over the last couple weeks. Is it time to buy for at least a bounce? I'm leaning towards yes... but I haven't really gotten an entry reason.
ROKU fell more than 40% from wick to wick on the candlestick chart. That's pretty incredible... however, they have had a tremendously good year. I'm not saying they will go up and retest their all time highs, but why not make a little money off a bounce that is bound to happen at some point. That some point might be now.

Roku approaching supportH/T David Belle (@macrodesiac_ on twitter) for the inspiration here. After a brutal selloff, I'm expecting ROKU to make a recovery towards the mid $140's heading into year end.

Roku's Fibonacci drop analysisTechnical analysis
OBV keeps a steady uptrend, surprisingly... Since its price has dropped about 40%.
Fibonacci retracement has its 61.8% line at $102.
We are at a SMA(100) support.
Market moving out of growth, into value.
Moving market news
Pivotal research downgrades to $60 (SELL).
Comcast (CMCSA) is gifting its streaming box, it was selling it before at $5.
Note
* Keeping a tight stop limit, there is a great risk reward ratio.


Really feel sorry for the bullsFeel sorry for them. It sucks. This is crazy, and I'm shorting this all day.


Stock Market Legend is Quadrupling His Fortune Short ROKUIndeed refer to the previous chart downgraded $175 on the American frenzy LOL

ROKU PUT SPREAD148/143 Put Spread 5 points EXP Oct 4th.
$2.31 Target profit target is $3.65 Max loss is $175
Lets see what happens, looks like its going to trend a bit lower.

NFLX Earnings playSimple Move. Either it pumps going into earnings or it dumps here to $250. Straddle could be effective here.


ROKU MarkUpSimply put, with ROKU's current market price I would be bearish. I'm noticing a correlation between multiple time frames, and when it cascades like this it will more than likely move in that directional sentiment.

Disney the Netflix Killer?I can't see Disney taking meaningful shares from Netflix but
the chart is rather bullish
Break out & gap up after good earnings (announcement of Disney plus)
Stock has been consolidating for a few months, since gap up
Trading between the low $130s, high $140s.
A break above $140 and this can potentially hit $200.
