ROKU

ROKU May 16th, 2019 - Losing Steam ?
This is currently how I believe ROKU is moving, following an elliott wave pattern but is currently stuck below the 0.786 fib(extension from start of wave 2 to end of wave 3, to bottom of wave 4.) If $86 is to be the peak, then this should be where wave 5 ends and we should be seeing a retracement in the near future.
Eyeing ROKU for a while now, they seem to have been doing really well due to a recent strong earnings report. This past week, despite trade war news, ROKU itself has been struggling to choose a direction. We are currently sitting right below the 0.786 fib and have been struggling to close above it since May 9th. We did see a couple of fake breakouts but no severe break/drop - still waiting on a big volume breakout for either direction to get a more clear picture of where this stock is headed. Based on the 3HR, we see a bearish crossover on the MACD as well as a break below 70 on RSI. We also see that 9MA has a support at ~$81.82 so unless we can close below this, we will not be able to set a price target of $77.42(0.618 fib) anytime soon.
The 4HR timeframe on ROKU has not had any clear indications that will help us to decide a direction either, but we should take notice of the current candlestick below $82.81, the 9MA. If we stay below this, should be a strong indication that we can close below the 9MA and aim to retest fib levels, or even the 26MA. STOCH RSI also crossed bearish once again so we should wait for a confirmation of a drop below 50 + RSI dropping below 70 to figure out if this stock has really become bearish or not.
The 1D timeframe on ROKU shows that the current 9MA and 26MA are far below the current price, with 9MA at $74.46 and 26MA at $70.69. STOCH RSI has crossed bearish and broken below the 70 and we should be waiting to see if RSI breaks below 70.
My position: ROKU $77 Puts for 5/24 - 7 contracts at $1.07 cost avg - $749 total , current price: $82.51
Notes: Currently down 29% (~$220) but I will be selling my contracts if by the end of this week, ROKU does not give a clearer indication of a possible downward move.
If you have any questions, comments, or concerns, feel free to leave them in the comments below and I'll get back to you
Rocky

ROKU Clear as day Bull flagROKU has a bull flag printing as it makes new highs
SPY is stagnant and is moving sideways.
ROKU may make new gains and move toward $90s
Journal Entry and not trading advice.

ROKU Short Opportunity to $73 and Below?Roku peaked this morning at $86 and fizzled throughout the morning. I'm seeing a potential Shooting Star Bearish reversal formation. I believe we continue to drop back down today and next week close or to the $70 level, potentially to bounce off of the $73 fibonacci level. ROKU

ROKU Run Defies Downtrending MarketROKU gapped and ran in a long white candle pushing through prior highs’ resistance easily. ROKU recently had a strong earnings report. This pattern completes the bottom formation.


ROKU ready to shortDownward sloping daily averages, descending triangle forming in both RSI and price action. Appears to be bear flagging daily.


Two Price targets on the way to being reached - mega double topUsing simple price patterns and fib extensions we get two targets wit juicy gains.
This is much like my NIO 21.7% trade
and also like ROKU 18% trade

Roku Oversold with a double topNASDAQ:ROKU is showing signs of a double top and retracing to support around ~$53. With a new shelf offering www.sec.gov for unknown reasons and RSI at oversold level, I believe Roku will be heading back to more recent support levels. Roku has positive news as well with support for Airplay 2 (coming soon) and a new Amazon Alexa skill. I don't believe the positive news will outweigh this oversold condition.
I am currently short NASDAQ:ROKU .

Top Momentum stocks for next 20 days 0 Unusual Options ActivityMomentum stock picks for next 20 days similar to NIO and ROKU 17% - 40% moves
BBY CLVS CRM INSP STNE AMRN ACAD MNK CRC HZNP MDCO BOX ZUO TME MTDR
See recent real trades idea: www.thetechnicaltraders.com


This stocks is Pop-N-Drop Pattern - Be Ready!I'm looking for $12.30 this week See Video
Other stocks like this #roku #amrn #momentum #stockpicks

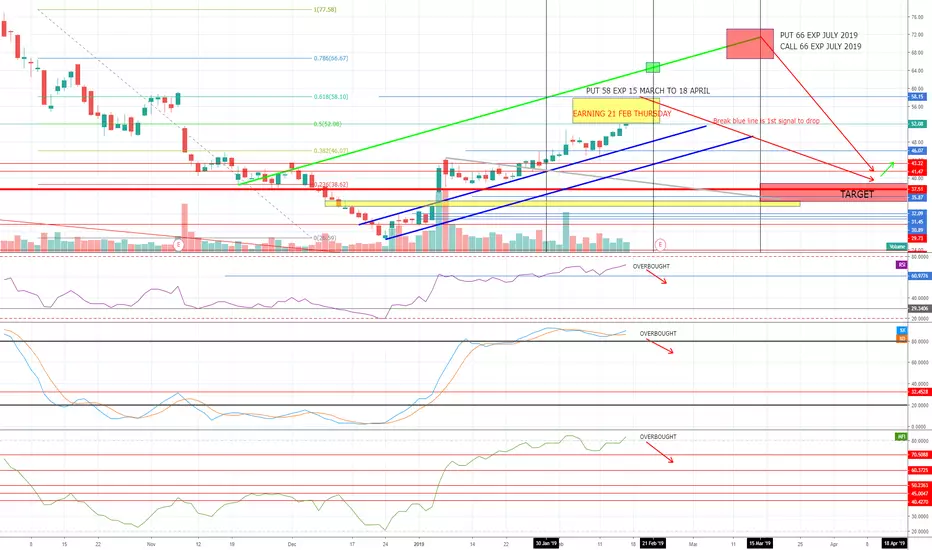
ROKU over-Bought Short at 58 or 66 to be dropped to 38 ROKU achieved all goals of current uptrend . Now at 52 with target remain at 58 but may be extend up to 66-72 as top peak then start falling to the latest gap between 34-37.. the perfect chance is to get short positions when reached 58 or 66 .
note the earning of current Q is on 21st Feb .
expected to have strong growth but less or lower profit as company started shifting hardware business into other services business such as subscription and other online services.
still ROKU have good future by expanding its business or by chance to be in form of acquisition with big firm but for now technically it reached overbought status on all levels
we can see indicators such as RSI MFI and even stochastic are overbought and exhausted . its time to get back and confirm support on area above 38 .
other trading scenario if earning beats estimation by big percentage then can take long positions targeting area between 66-72 but should be expired before mid of this year. (not recommended)
i still prefer to get the right moment to short positions from the top or near by the peak top which shall be formed during next week ... good luck

ROKU Earnings Play: BullishROKU huge run up from its initial listing in September of 2017. ROKU only made slight profit posted in Feb last year (surprised analyst with 158.54%). The surprise didn't bring much love to the name until the $29.00 pivot. Strong weekly uptrend started back in December of 2018 remains intact so far. Previous weekly pivots where at 52.70 and 58.80 and ATH of 77.57. ROKU is tightly correlated with the QQQ's and likes to ride its tailwinds.
Outlook going into earnings, Bullish IMO: Anticipation and pricing seems that we are going to be looking at a positive earnings report on 2/21. As we have seen good ERs don't always mean more upside action lately, so caution holding through that date is obvious. ROKU has some good tailwinds behind it as the QQQs and SPY remain strong unless the China deal falls through in the near term they should remain strong in the next few weeks. As shown on the 1HR chart ROKU has ran on the top channel of the Bollinger Bands since February last year and poked above a few times. Last week tightening Range on the 1HR, increasing volume into the close on 2/15, makes me feel bullish. Only flag is that the RSI is running a little hot on the 1HR and may slow things down a little into the open. Looking at the OPTIONS chain for Feb. 22nd expiry, the $55.00 strike price has the highest volume at 519 and Open interest at 1832. It appears to me that the masses are betting on the $55.00 and above strike into earnings, lots of premium burn would be to hold bellow that strike (Caution on the 2/22 expiry). On the positive side the 5, 8, and 13 MAs are all underneath including the middle BB for support and we have support (S1) at $51.54 as well. With one eye on the QQQ my play for this name would be to zoom in on the 5M watch for increasing volume at the open and once the algos work out the direction snatch some $55.00 strike 3/8 expiry Calls, especially if we back down to $51.65 price and bounce. At that point there will be some panicking and prices for the Calls should be low. If we break down further to $50.81 I will stop out, then if we go down any further I would be looking for a bounce play similar to described above. GLTA
Full Disclosure: At the time of this writing I do not have a position in ROKU. This trade idea is for educational purposes only, I am not a financial advisor, do not follow me or anyone else for that matter blind into a trade. No one loves your money as much as you do, do your own due diligence and seek professional financial advice when necessary.


ROKU SHORT Madness MethodIndicators are conformation tools of price action.
I like Volume, both Option & Stock Volume.. and technicals.. nothing fancy..
Simple supply and demand..
But the SETTINGS of the indicator of your liking will set you in the direction that should allow you time to execute a profitable trade..
Never rely on any indicator alone..only in tandem with your method..
So turn the news of and read the news so you do not get that bug in your telling you what to think.Read it in your voice.. It's important .
Hope this sparks an idea to someone.
Trade Safe

$ROKU Swing Idea (Short)Expecting short pull back/Gap Fill/break-up candle low test on $ROKU. Over bought...


